Publisher’s version / Version de l'éditeur:
Polymer Composites, 26, 5, pp. 636-646, 2005-10-01
READ THESE TERMS AND CONDITIONS CAREFULLY BEFORE USING THIS WEBSITE. https://nrc-publications.canada.ca/eng/copyright
Vous avez des questions? Nous pouvons vous aider. Pour communiquer directement avec un auteur, consultez la première page de la revue dans laquelle son article a été publié afin de trouver ses coordonnées. Si vous n’arrivez pas à les repérer, communiquez avec nous à [email protected].
Questions? Contact the NRC Publications Archive team at
[email protected]. If you wish to email the authors directly, please see the first page of the publication for their contact information.
NRC Publications Archive
Archives des publications du CNRC
This publication could be one of several versions: author’s original, accepted manuscript or the publisher’s version. / La version de cette publication peut être l’une des suivantes : la version prépublication de l’auteur, la version acceptée du manuscrit ou la version de l’éditeur.
For the publisher’s version, please access the DOI link below./ Pour consulter la version de l’éditeur, utilisez le lien DOI ci-dessous.
https://doi.org/10.1002/pc.20126
Access and use of this website and the material on it are subject to the Terms and Conditions set forth at
Bulk Fatigue Damage Evolution in Polyamide-6 and in Polyamide-6
Nanocomposites
Bellemare, Simon C.; Dickson, J. Ivan; Bureau, Martin N.; Denault, Johanne
https://publications-cnrc.canada.ca/fra/droits
L’accès à ce site Web et l’utilisation de son contenu sont assujettis aux conditions présentées dans le site
LISEZ CES CONDITIONS ATTENTIVEMENT AVANT D’UTILISER CE SITE WEB.
NRC Publications Record / Notice d'Archives des publications de CNRC:
https://nrc-publications.canada.ca/eng/view/object/?id=c46b8190-3bff-4c51-beaf-282c1c660e2d https://publications-cnrc.canada.ca/fra/voir/objet/?id=c46b8190-3bff-4c51-beaf-282c1c660e2d
Bulk Fatigue Damage Evolution in Polyamide-6 and in a
Polyamide-6 Nanocomposite
Simon C. Bellemare, J. Ivan Dickson
Programme de Ge´nie des Mate´riaux, E´cole Polytechnique, C.P. 6079, Succ. Centre-Ville, Montre´al, QC H3C 3A7, Canada
Martin N. Bureau, Johanne Denault
Industrial Materials Institute, National Research Council Canada, 75 de Mortagne, Boucherville, QC J4B 6Y4, Canada
The mechanical response of a polyamide-6 montmoril-lonite clay nanocomposite and of a polyamide-6 was monitored during axial fatigue tests performed at R-ratios of 0.1 and –1. For both materials, two transitions were usually observed in the evolution of all the stress-strain-time parameters studied after similar numbers of loading cycles, suggesting interrelationships between the mechanisms of molecular reorganization. Fatigue test monitoring indicated an initial decrease in the stor-age modulus and a subsequent trend for this modulus to increase, especially in polyamide-6. During all tests, a partially recoverable strain was accumulated because of viscoelastic deformation. Nanoparticles reduced this strain in the initial cyclic straining regime but not in the last regime, probably because such particles cannot in-hibit viscoelastic events constrained in a volume larger than their interaction volume within the matrix. Based on the accumulated volume variation measured, the nucle-ation and growth of microvoids can be expected to oc-cur in the last cyclic straining regime.POLYM. COMPOS., 26:636 – 646, 2005. © 2005 Society of Plastics Engineers
INTRODUCTION
Reinforcing polymers with exfoliated or intercalated/ exfoliated layered silicates has received considerable inter-est in recent years [1]. Such nanocomposites provide the possibility of improving the stiffness and strength of poly-mers at relatively low cost without significantly increasing their density. Large increases in Young’s modulus associ-ated with the presence of less than 5 wt% of such
nanopar-ticles have been reported for semicrystalline thermoplastic matrices, such as polyamide [2– 6], polybutylene terephtha-late [7], polypropylene [8], and polyethylene [9]. The in-crease in Young’s modulus appears to be controlled by the level of exfoliation [2], which can vary with the processing technique and conditions employed, as well as with the level of interaction between the nanoparticles and the matrix. Polyamide-based layered silicate nanocomposites are sys-tems frequently encountered in which both Young’s mod-ulus and the ultimate tensile strength (UTS) are increased significantly in comparison with the non-filled matrix [2– 6]. In these systems, the significant improvements in the UTS have been attributed to strong nanoparticle-matrix interac-tions [2]. These interacinterac-tions can have a direct effect on the strength of the interface, the level of exfoliation, and the supermolecular structure of the matrix.
The presence of exfoliated layered silicates is found to induce several changes in the supermolecular structure of the semicrystalline polymer matrix. In the molten state, pressure-volume-temperature measurements indicated that nanoparticles decrease the free volume, which is interpreted by a loss of mobility of the polymeric chains that are adsorbed on the nanoparticle surface [10]. Also, it has been suggested [9] that exfoliated layered silicates induce changes in the crystallization process. For compression-molded polyamide-6 (PA6), the presence of nanoparticles was found to lead to slight reductions in crystallinity as well as to induce a predominantly ␥ crystalline form rather than a predominantly ␣ form [11]. However, since this ␥ form is known to present a lower inherent strength than the ␣ form [12,13], such a change in the crystalline form cannot explain the increase in the tensile strength resulting from the pres-ence of exfoliated clays in the PA6 matrix. Exfoliated silicate platelets have also shown a tendency to become oriented locally parallel to the shear flow direction [14 –17] while crystallites in a polyamide-12-based nanocomposite were found to be oriented normally to the surface of the Correspondence to:M. Bureau; e-mail: [email protected]
Contract grant sponsor: NSERC.
Simon C. Bellemare’s current address is Dept. of Materials Science and Engineering, Massachusetts Institute of Technology, 77 Mass. Ave., Cam-bridge, MA 02139.
DOI 10.1002/pc.20126
Published online in Wiley InterScience (www.interscience.wiley. com).
silicate platelets [17]. These orientation effects can explain the superior improvements in Young’s modulus and tensile strength measured when the same materials are injection-molded rather than compression-injection-molded [11].
Since engineering semicrystalline thermoplastics have become commonplace in a variety of structural applications (e.g., more than 45 million kilograms of polyamides are employed by the U.S. automotive industry for the annual production of under-the-hood components [18]), semicrys-talline thermoplastics must withstand both constant and cyclic in-service loads. Fatigue testing primarily character-izes the resistance to cyclic loading; however, it has been suggested that such testing can also be employed as an accelerated technique to evaluate the long-term resistance to constant loads [19 –23].
Previous studies on the effect of reinforcing semicrystal-line polymers on the fatigue behavior indicated possible improvements on the crack growth resistance [24 –27] as well as on the fatigue life of non-notched specimens [28, 29]. When the interface strength and aspect ratio of the reinforcing particles are sufficiently high, such as in glass-fiber reinforced polymers, fatigue life increases are gener-ally seen when comparison with the non-reinforced polymer is made at the same stress amplitude, whereas decreases are seen when comparison is made at the same strain amplitude [28, 29]. With a nanocomposite system similar to that of the present study, the same trends with respect to fatigue life were observed [30]. This latter study also showed that the crack propagation resistance of that nanocomposite was lower than that of the non-reinforced matrix. Since fatigue life reflects the number of cycles required to initiate very small defects, to grow these defects until microscopic cracks are formed, and to propagate a dominant crack until final fracture, the overall improvements must originate from mechanisms that are precursors to the growth of a dominant crack.
Even if it is usually considered that the number of cycles to fracture is mainly controlled by crack initiation [31, 32], the literature contains very limited information regarding the mechanisms that govern this response. In an attempt to gain insight on these mechanisms that precede fatigue crack
growth as well as on how these mechanisms can be affected by reinforcing nanoparticles, this study presents and dis-cusses the bulk fatigue response of a PA6 montmorillonite clay nanocomposite and of an unmodified PA6 using the evolution of the macroscopic stress-strain-time relationship. Reference to relevant work will be made in the discussion.
EXPERIMENTAL
Materials Description
The polymer nanocomposite employed in the present study was obtained from UBE Industries, where it was prepared by an in situ polymerization process. As described in the literature [33], montmorillonite, which is a natural layered crystal member of the 2:1 phyllosilicate family [2], was first hydrated by the manufacturer in the presence of hydrochloric and aminolauric acids in order to replace the sodium cations present in the silicate interlayers by acid functions. The surface-modified product was subsequently mixed with monomers before polymerization. The dimen-sions of the resulting exfoliated nanoparticles are approxi-mately 1 nm in thickness and 100 nm in lateral dimensions [34].
Specimen Preparation
Pellets of PA6 containing 2 wt% of these exfoliated nanoparticles (UBE Industries, commercial grade 1015C2), designated PA6NC, were dried for 2 days at 80°C under vacuum prior to injection molding at a melt temperature of 225°C and a mold temperature of 80°C. The same drying and molding procedure was employed for the non-filled PA6 (UBE Industries, commercial grade 1015B), which had the same molecular weight as the PA6NC studied (A. Usuki, personal communication). The microstructural char-acteristics and tensile properties of the materials employed are summarized in Table 1. Because of the hygroscopic nature of PA6, the as-molded PA6NC specimens were fur-ther dried for two weeks at 80°C under vacuum to remove
TABLE 1. Microstructural characteristics and tensile properties of the materials studied.
Materials Microstructural characteristics Tensile properties [6]
Matrix PA6NC • In situ polymerization of -caprolactam in the presence of organo-clay
• Mn⫽ 22,200 g/mol [38]
• Predominant ␥ crystalline form with also ␣ form present, from DSC, FTIR and XRD [6, 11] • Young’s modulus of 4.1 GPa
• Crystalline index of 25%, from DSC [11] • UTS of 100 MPa
Clay • Strain at fracture of less than 10%
• Organo-modification: ion-exchanged montmorillonite intercalated with -amino dodecanoic acid • 2 wt% of organo-clay
• Completely exfoliated, from XRD [11]
PA6 • Same matrix as used for PA6NC • Young’s modulus of 2.7 GPa
• Predominant ␣ crystalline, from DSC, FTIR and XRD [6, 11] • UTS of 74 MPa • Crystalline index of 31%, from DSC [11] • Strain at fracture of 175%
any trace of humidity resulting from processing or post-processing operations. The corresponding glass transition temperature, Tg, was determined from the peak in the curve
of temperature vs. ratio of loss-to-storage shear modulus, which was obtained using a rheometric mechanical spec-trometer at a frequency of 1 Hz and at a constant heating rate of 2°C/min. For both materials, Tgwas 65°C ⫾ 0.5°C.
Tensile test results reported elsewhere [6] employing spec-imens processed and conditioned following the same pro-cedure are summarized in Table 1.
Fatigue Testing
The fatigue specimens were molded to their final dimen-sions according to the general recommendation of ASTM E606. These specimens had a nominal thickness of 3.1 mm and a gauge section width and length of 10 mm and 14 mm, respectively. The radius of curvature at the shoulders was 15 mm. Axial load-controlled fatigue tests were carried out employing an Instron 8511 servo-hydraulic testing machine. Axial loading tests were preferred to bending tests because they provide the possibility of employing extensometers to measure the strain in both the longitudinal and the long transverse directions. The load or R-ratio (R ⫽ min/max) was maintained constant at 0.1 except for few tests carried out in tension-compression (R ⫽ –1). Unless otherwise stated, a sinusoidal cyclic waveform and a cycling fre-quency of 5 Hz were employed.
For such fatigue testing parameters, two distinct fracture mechanisms are generally observed in polymers [24, 35, 36]. Above a certain level of cyclic load or above a certain loading frequency, an unstable increase of the specimen temperature induces a thermally-dominated fatigue fracture. At lower cyclic loads or lower cycling frequencies, the temperature increase is limited and generally becomes sta-ble, which permits mechanically-dominated fatigue fracture to prevail. Since thermally-dominated fatigue fracture is characterized by the formation of a neck zone in the spec-imen whereas mechanically-dominated fracture is macro-scopically brittle [37], observation of the fracture mode ensured that all results reported here were in the later regime.
During each test, the signals from the load cell and from the extensometers collected by the Instron controller were transferred to a computerized data acquisition system at a frequency of 500 Hz during preprogrammed cycles. In Fig. 1, two hysteresis loops plotted directly from these data are presented along with a visual representation of some of the parameters employed to characterize the accumulation of macroscopic deformation as well as the evolution of the dynamic properties. The parameters employed to character-ize the accumulation of macroscopic deformation were the accumulated longitudinal strain ⑀Acc, the rate of longitudinal
strain accumulation ˙t and the accumulated volume strain
(⌬V/Vo)Acc. Calculations were made using the following
relationships:
Acc⫽ Min⫺ Min
1 䡠 Min Min 1 , (1) ˙t⫽ t⫹1⫺ t⫺1 Nt⫹1⫺ Nt⫺1 , (2) ⌬V/Vo⫽ 共1 ⫹ L兲共1 ⫺ W兲 2 ⫺ 1, (3)
共⌬V/Vo兲Acc⫽ 共⌬V/Vo兲Min⫺ 共⌬V/Vo兲Min
1
(4)
where Min and Min are, respectively, the minimum
lon-gitudinal strain and the minimum cyclic stress during a single cycle; the superscript “1” in the latter symbols indi-cates that the value is measured during the first loading cycle, t⫹1 and Nt⫹1 are, respectively, the longitudinal accumulated strain and the number of cycles after t ⫹1 time intervals; ⌬V/Vo is the instantaneous volume strain; ⑀L is
the instantaneous longitudinal strain; ⑀Wis the instantaneous
long-transverse strain; and (⌬V/Vo)Min is the minimum
volume strain in a single cycle. In Eq. 1, the factor Min/
Min
1
was used to minimize experimental errors due to small variations in Minduring the experiments.
The parameters considered to characterize the evolution of the dynamic properties were the loss tangent Tan ␦ and the storage modulus E⬘, which were calculated from the following relationships:
FIG. 1. Typical stress-strain hysteresis loops at cycles 1 and 5000 used to define the strain at minimum stress during the first loading cycle (Min1 ),
the accumulated strain (Acc), the strain amplitude (Amp) and the stress
⌬t ⫽共Min⫹ 50%ⴱ2Amp兲 ⫺ bincrease mincrease
⫺共Min⫹ 50%ⴱ2Amp兲 ⫺ bdecrease mdecrease , (5) ␦ ⫽ ⌬tⴱ2ⴱf, (6) E⬘⫽Amp Amp cos ␦ (7)
where ⌬t is the time delay of the strain waveform relative to the stress waveform, Amp is the stress amplitude, f is the
frequency, and Ampis the strain amplitude. The parameters
mincrease and bincrease are, respectively, the slope and the
ordinate at time zero of the linear regression between stress and time. The seven data points closest to the stress target (of Min ⫹ 50%ⴱ2Amp)) in the increasing part of the
cycle were employed to calculate the latter linear regression. The parameters mdecreaseand bdecreaseare, respectively, the
equivalent, in the decreasing part of the cycle, of mincrease
and bincrease. All calculations were made using a
laborato-ry-designed pre-programmed routine.
RESULTS AND DISCUSSION
Most fatigue tests were carried out at R ⫽ 0.1 and at maximum cyclic stresses of 75 and 57 MPa for PA6NC and of 57 MPa for PA6. The average initial strain amplitude during tests on PA6NC at 75 MPa was 0.98%, while the average initial strain amplitude during tests on PA6 at 57 MPa was 0.93%. For this reason, the test parameters used enabled a comparison of the behavior of both materials at a similar stress amplitude and at a similar initial strain am-plitude. Based on tensile test data for both materials (Table 1), this similar initial strain amplitude also corresponds to a similar ratio of approximately 75% of the maximum cyclic stress with respect to the tensile yield strength.
Accumulation of Longitudinal Deformation
The accumulated strain, Acc, as a function of the
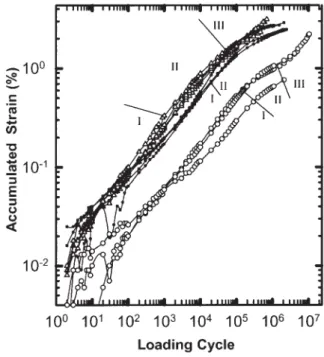
num-ber of loading cycles (N) was thus recorded during the fatigue tests. The corresponding plots are shown in Fig. 2 on a log-log scale for each of the three testing conditions. Transitions, indicated in Fig. 2, in the process of strain accumulation were observed during cycling. A first region, from approximately 10 –102 to 103–105 cycles, appears quite linear. This linearity indicates a power law relation-ship between Acc, and N. Based on the variability in results
and on the limited precision in the strain measurements, the small deviations from linearity during the first 10 –102 cy-cles are considered to be within the experimental error. After approximately 103–105cycles, a second region, char-acterized by a progressive decrease of the slope of this log-log plot, can be identified. This deviation from linearity
indicates that the inflection of the curves, the equivalent of a second derivative, becomes negative. Finally, a third re-gion, observed in all tests expect one, can be observed after 104–106 cycles. This third region is characterized by the slope progressively increasing with log N (positive inflec-tion). From these observations, three regimes can be defined for the deformation of PA6NC: an initial Regime I during which the response is linear on a log-log scale, a subsequent Regime II showing a negative inflection, and a final Regime III showing a positive inflection. For PA6, only a first linear region and a second region with a negative inflection can be clearly resolved from the curve in Fig. 2. Therefore, PA6 appear to present only the Regimes I and II previously defined, which could be a result of the limited number of cycles to fracture.
The process of longitudinal strain accumulation can also be presented by a curve of the logarithm of the rate of longitudinal strain accumulation ˙t vs. the accumulated
strain Acc, as originally proposed by Sherby and Dorn [38]
for creep deformation of polymeric materials. Such Sherby-Dorn plots are presented in Fig. 3. It can be seen that ˙t
initially decreases and can eventually reach an apparent plateau value. For the three tests on PA6NC at a maximum stress of 57 MPa, the inflection of the curves is initially positive but changes to negative after approximately 0.2% of Acc. For two of these three tests, a plateau value (zero
slope) of ˙t of approximately 2 ⫻ 10
–7
%/cycle at Acc ⬇
1.0% can be observed on the log ˙tvs. Accvs. ⑀Acccurve.
For all tests on PA6 at 57 MPa, the inflection of the curves is also initially positive and changes to negative at Acc ⬇
0.8%. These values of Acc for the transition between the
FIG. 2. Evolution of the accumulated strain during continuous cycling in tension-tension (R ⫽ 0.1) at a maximum cyclic stress of 75 (⌬) and 57 MPa (E) for PA6NC and of 57 MPa (F) for PA6. Straight lines indicate transitions between Regimes I, II, and III.
first and second regime are in general agreement with those identified in Fig. 2. For all tests on PA6NC at 75 MPa, the rate of strain accumulation decreases toward a plateau value of ˙t⬇ 2 ⫻ 10
– 6
%/cycle, but the value of ⑀Accat which this
transition occurred is not clearly defined in Fig. 3. Since the transition points at 57 MPa can be more pre-cisely identified on Sherby-Dorn plots from Fig. 3 than on regular log Accand log N plots from Fig. 2, the Accvalues
at which a transition is observed in the curves from the former are used as critical values of the transitions between the regimes at this maximum stress. Using these Acc
tran-sition values, the number of cycles at the trantran-sitions can be estimated from Fig. 2. Accordingly, the transitions between Regimes I and II occur at approximately 2 ⫻ 104cycles for both materials tested at 57 Mpa, whereas the transition between Regimes II and III occurs at approximately 106 cycles for PA6NC at 57 MPa. As mentioned previously, no transition between Regimes II and III is noted for PA6 at 57 MPa.
Based upon the curves of log Accvs. log N (Fig. 2) or
of log ˙tvs. Acc(Fig. 3), PA6NC and PA6 show a similar
behavior in Regime I when the comparison is made at a similar initial strain amplitude. During Regime II, this sim-ilarity was gradually lost and, toward the end of tests, the values of ˙t for both materials become similar at a similar
stress amplitude instead of strain amplitude (Fig. 3). These results suggest that the effect of the nanoparticles leading to strain accumulation is different in Regimes I and III. The microstructural processes by which strain accumulation oc-curs must be understood before an understanding of the differences in the effect of nanoparticles on the different regimes can be reached.
For the tests at maximum stresses of 57 MPa and at 75 MPa on PA6NC, the curves in Fig. 3 show that the value of ˙t levels off at an apparent plateau value before the end of
the tests. These constant values of ˙t observed at given
stress amplitudes suggest that Regime III is governed by a viscous-like behavior (i.e., a constant strain rate at a con-stant stress). However, these plateau values of ˙t are
ap-proximately one order of magnitude larger at 75 MPa (˙t⬇
2 ⫻ 10– 6%/cycle) than at 57 MPa (˙t⬇ 2 ⫻ 10
–7
%/cycle), which indicates a non-linearity between the applied stress and the rate of viscous-like flow. Regime III cannot be related to the growth of cracks or the formation of a neck since the latter would have resulted in strain measurements showing a significant increase in ˙t instead of the observed
plateau. Strain measurement curves during cyclic loading were similar, apart form their extension, for specimens that failed prematurely and for specimens that did not. It thus appears that the regimes observed from the macroscopic strain accumulation data reflect fatigue-induced deforma-tion processes that are macroscopic and approximately ho-mogeneous throughout the specimen gauge section.
To further understand these deformation processes, a test on PA6NC at a maximum cyclic stress of 75 MPa was interrupted after 715 kilocycles to study the recovery be-havior. The accumulated strain before test interruption was 3.2%. Figure 4 presents the recovered strain vs. the loga-rithm of recovery time. After 3.4 ⫻ 104seconds (⬇ 10 hr), the accumulated strain recovered was 0.8%, which shows that at least 25% of the total accumulated strain is revers-ible.
For a system similar to that presently studied, no infor-mation was found in the literature concerning the relative
FIG. 3. Rate of strain accumulation vs. accumulated strain (Sherby-Dorn plot) for the same tests for which results are presented in Fig. 2. Refer to Fig. 2 for the symbols.
FIG. 4. Accumulated strain curve and recovery curve for a fatigue test on PA6NC at a maximum cyclic stress of 75 MPa interrupted in Regime III after 715 kilocycles.
importance of the mean stress vs. the stress amplitude on the evolution of parameters characterizing the stress-strain-time response. Two additional tests on PA6NC were therefore carried out, with the loading conditions changed to fully reversed tension-compression (R ⫽ –1). A constant stress amplitude of 40 MPa was used for both tests, and the initial strain amplitude measured was approximately 1.08%. The initial values of the accumulated strain were negative when calculated using Eq. 1. This result can be explained by an initial increase in the storage modulus. After 106cycles, the average value of ⑀Acc was 0.18%. This value is
approxi-mately five times less than that of 0.88% measured after 106 cycles for tests at R ⫽ 0.1 on PA6NC at a maximum stress of 57 MPa. This difference in ⑀Accwhen R is changed from
0.1 to –1 indicates that an important fraction of the defor-mation at R ⫽ 0.1 can be attributed to the positive mean stress.
Variations in Dynamic Properties
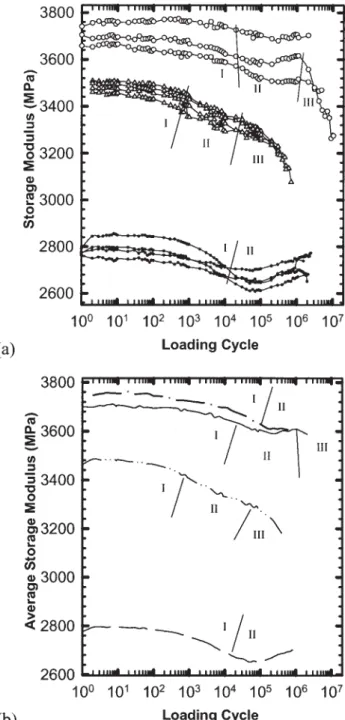
The storage modulus E⬘ vs. log N curves for PA6 and PA6NC at 57 MPa and for PA6NC at 75 MPa are presented in Fig. 5. The initial storage modulus values are in general agreement with the values of Young’s modulus reported in Table 1. As in the case of the log Accvs. N curves (Fig. 3),
transitions in the storage modulus E⬘ vs. log N curves are noted. After a very short stabilization period of 10 cycles or less, E⬘ progressively decreased toward a minimum value after which, in some cases, it progressively increased and then decreased again. For PA6 and PA6NC at 57 MPa, inflection points are noted after approximately 2 ⫻ 104 cycles. In the case of PA6NC at 57 MPa, a kink in the slopes of the curves is noted after 106cycles. The number of cycles at which these inflection points are noted corresponds to the number of cycles where transitions were previously noted from the accumulated strain response (see text referring to Figs. 2 and 3). The previously defined Regimes I, II, and III thus correspond, respectively, to the initial portion of the curve where the inflection is negative, to the subsequent portion where the inflection is positive, and, when present, to the final portion of the curve where the inflection be-comes negative again.
Contrary to the strain response, the transitions between the regimes for PA6NC cycled at the highest maximum stress of 75 MPa can be quite well estimated from the evolution of E⬘ (Fig. 5a). Regime II begins after approxi-mately 103 cycles and Regime III after approximately 5 ⫻ 104
cycles. Using Fig. 2, the corresponding critical values of Acc are thus approximately 0.3% for the onset of
Re-gime II and 1.3% for the onset of ReRe-gime III. From the log ˙tvs. Acccurves (Fig. 3), the portion of the curves between
these two critical values of ⑀Acc seems to have a smaller
curvature than prior to and after this portion, which supports the possibility that Regimes I, II, and III in PA6NC cycled at a maximum stress of 75 MPa are also characteristics of the process of accumulation of longitudinal strain.
The averaged curves of the storage modulus E⬘ vs. log N
for the same testing conditions are presented in Fig. 5b. In terms of transitions, the shape of the curves in Regimes I and II is more comparable in PA6NC and PA6 at the same stress amplitude than at a similar initial strain amplitude. The amplitude of the variations is, however, more pro-nounced for PA6. Also shown in Fig. 5b is a curve for the averaged evolution of E⬘ during the two tests on PA6NC carried out in tension-compression under the conditions previously described. The inflection of this last curve is negative up to approximately 2 ⫻ 105 cycles, which is
FIG. 5. Evolution of the storage modulus. a: Individual curves during the same tests for which results are presented in Figs. 2 and 3 (refer to Fig. 2 for the symbols); b: Average evolution curves for the tests in Fig. 5a as well as for the two tests at R ⫽ –1.
assumed to constitute the end of Regime I. During Regime I, the reduction of E⬘ was significantly larger than during the tests on PA6NC at R ⫽ 0.1 at a maximum stress of 57 MPa. This larger reduction was seen even if tension-compression loading reduced the accumulated strain by a factor of ap-proximately 5. Therefore, changes in E⬘ are not a direct consequence of strain accumulation.
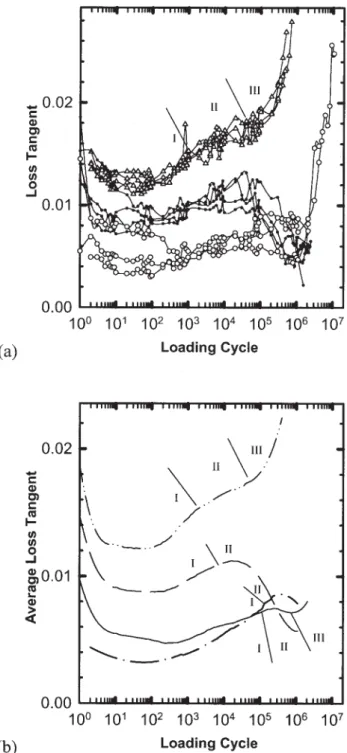
The other parameter used in the present study to inves-tigate the evolution of the dynamic properties is the loss tangent (Tan ␦), calculated from the time delay of the strain waveform relative to the stress waveform. Individual curves for the regular tests are presented in Fig. 6a. All values of Tan ␦ are of the order of 10–2 and are consistent with measurements made on the same materials using a rheomet-ric mechanical spectrometer [37]. In all cases, Tan ␦ ini-tially decreases and then increases. During the latter in-creases, the inflexion of the curves changes from positive to negative. For PA6NC at 75 and 57 MPa, the inflection subsequently becomes positive again after, respectively, approximately 4 ⫻ 104and 106cycles, after which a sig-nificant increase in Tan ␦ can be noted.
The data for each condition have been averaged to facil-itate a comparison between the different testing conditions and to identify transitions in the response. The averaged curves are presented in Fig. 6b. These averaged curves terminate at the shortest of the individual curves in Fig. 6a. Inflection points are observed at approximately 103and 5 ⫻ 105
cycles for PA6NC cycled with a maximum stress of 75 MPa and at approximately 2 ⫻ 104cycles for PA6 and PA6NC cycled with a maximum stress of 57 MPa. For PA6NC cycled at 57 MPa, a second inflection point has to be at approximately 106cycles since the curvature changes from negative to positive. As in the case of the evolution of E⬘, these transitions enable one to use the same regimes defined previously to describe the evolution of Tan ␦ during cycling. The inflection is positive in Regime I, negative in Regime II, and positive in Regime III. Although the transi-tion between Regimes I and II occurs at approximately the same number of cycles for PA6 and PA6NC cycled at 57 MPa, the slope of the curve in Regime II decreases more for PA6 than for PA6NC. As well, the curve obtained from the tension-compression test also indicates a first transition after 2 ⫻ 105cycles. Up to 2 ⫻ 104cycles, the variations in Tan ␦ are similar to those measured during the tests at R ⫽ 0.1 on PA6NC at a maximum stress of 57 MPa.
To gain more insight on the variations in the dynamic properties, a test on PA6NC at a maximum stress of 57 MPa and R ⫽ 0.1 was interrupted after 2 ⫻ 105 cycles and restarted after 4 hr. As shown in Fig. 7, the value of E⬘ just after restarting the test is nearly identical to that just before test interruption. After restarting, E⬘ gradually increases and the reduction in E⬘ observed in Regime I of all uninterrupted tests is not present. In contrast, the evolution of Tan ␦ as a function of the applied cycles after test interruption is al-most identical to that for the initial test. These results suggest that the variations of Tan ␦ in Regime I are revers-ible and recovered; whereas, the variations of E⬘ in Regimes
I and II are not, at least for the recovery period and test conditions investigated.
Accumulated Volume Strain
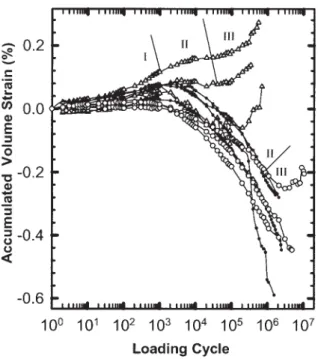
The last parameter considered from the stress-strain-time response is the accumulated volume strain (⌬V/Vo)Acc,
calculated using Eqs. 3 and 4. The evolution of (⌬V/Vo)Acc
FIG. 6. Evolution of the loss tangent. a: Individual curves for the same tests as in Figs. 2, 3, and 5a (refer to Fig. 2 for the symbols); b: Average evolution curves for the tests in Fig. 6a as well as for the two tests at R ⫽ –1.
vs. log N is shown in Fig. 8 for each condition tested. The volume apparently increases during the first 103–104cycles but then generally decreases. The variability between the tests is important, which can originate from the small vol-ume variations measured and from limitations of the exper-imental technique. For instance, a small error on the strain measurement in either of the two directions (longitudinal or transverse) can result in an apparent volume expansion or contraction while the material is deforming at constant
volume. This suggests that it is preferable to interpret the evolution of these curves from changes in their inflection rather than from the relative values of their slopes. Inflection points are found at approximately 4 ⫻ 104and 106cycles for the tests on PA6NC at maximum stresses of 75 and 57 MPa, respectively. Based upon the correspondence between these values and the number of cycles at the transitions observed with the other parameters, the inflection of the curves of (⌬V/Vo)Acc vs. log N appears to change from
negative to positive at the transition between Regimes II and III previously defined. From this change in inflection, it can be inferred that the dilatational portion of the accumulated strain is higher in Regime III. This inference is also sup-ported by the increases of (⌬V/Vo)Acc observed in Regime
III with PA6NC during three tests at 75 MPa and one test at 57 MPa. As previously proposed [39], this increase could be a measurement error resulting from strain localization. However, strain localization in Regime III should result in an increasing rate of strain accumulation rather than in a constant rate. Since deformation at a constant macroscopic rate is likely to occur macroscopically homogeneously, the observed change to a positive inflection of the curves of (⌬V/Vo)Accvs. log N could also be attributed to the
forma-tion of a distribuforma-tion of microvoids throughout the gauge section of the specimen.
DISCUSSION
The parameters used to describe the stress-strain-time response—namely the accumulated strain, the storage mod-ulus, the loss modmod-ulus, and the accumulated volume varia-tion—indicated the presence of three distinct regimes dur-ing the fatigue damage evolution of PA6 and PA6NC. Since for a given loading condition the number of cycles at the transitions between the regimes was similar for these dif-ferent parameters, the mechanisms responsible for the vari-ations in these parameters should be interrelated or con-trolled by common microstructural variables. However, these mechanisms also need to be somewhat different since they are differently affected by the R-ratio and by test interruption.
As concerns strain accumulation, it should first be noted that a power law relationship between Accand N, similar to
those observed in Regime I in the present study, has previ-ously been reported during similar tests on carbon fiber-reinforced polyamide-66 conditioned to a water content of approximately 3.5%. In the latter, the linear regime pre-vailed up to fracture and was proposed to be associated with the degradation of the interface between the reinforcement and the matrix [40]. In the current study, the tests performed on the non-reinforced PA6 allow one to rule out such a hypothesis. On the other hand, the fact it is only in the current study that the linear regime was followed by other regimes can be explained from differences in the condition of the polyamide, namely its lower intrinsic molecular mo-bility resulting from the drying treatment.
Using a trapezoidal rather than a sinusoidal waveform,
FIG. 7. Evolution of the storage modulus (F, E) and of the loss tangent (Œ, ‚) for tests with PA6NC at R ⫽ 0.1 and a maximum cyclic stress of 57 MPa. Filled symbols represent values before test interruption and open symbols after test interruption.
FIG. 8. Evolution of the accumulated volume strain for the same tests as in Figs. 2, 3, 5a, and 6a (refer to Fig. 2 for symbols).
previous axial fatigue studies on polycarbonate have shown that the loading rate had a very limited effect on the accu-mulated strain, whereas the effect of hold time at maximum and minimum stress was found to be significant [41]. It was also found that loading and unloading had a very important accelerating effect on the rate of strain accumulation in comparison to simply maintaining the load at maximum stress [42, 43]. Tests carried in the same fashion on PA6NC in the current study have shown these same trends [37]. These tests further confirmed the importance of loading/ unloading by opposition to the load rate and hold time. Therefore, the mechanisms that result in strain accumula-tion are distinct from those leading to a monotonic “plastic” strain since they are affected more by the time under load and by loading/unloading cycles than by the loading rate.
Also, because part of the accumulated strain was found to be recoverable by simply unloading the specimen, these mechanisms could be similar to those proposed to explain the viscoelastic deformation of flexible amorphous polymer chains in a succession of two different categories of mech-anisms [44, 45]. Initially, the deformation events of a given macromolecule are expected to be confined within a tube and may involve the migration of molecular kinks along the axis of this tube. After a certain combination of deformation and time, a relative displacement of the tubes is expected to become the dominant process. Even if the materials used in the current study were tested below their glass transition temperature, cyclic stressing can dramatically accelerate thermally activated processes and therefore enable impor-tant relative displacement of the chains. Based on this argument and on the experimental result that the strain rate progressively decrease before reaching a steady state, we believe that mechanisms of deformation leading to strain accumulation in Regime I should involve molecular events constrained within a small interaction volume. Over time, suitable sites for such events should progressively decrease in number until they are all activated, at which time Regime II would become dominant. In Regime II, the number of chain segments involved in the events of local deformation should increase up to the point where the dominant mech-anism becomes the slow relative motion of a large propor-tion of the chain segments, leading to the constant rate of strain accumulation, or viscous flow, observed in Regime III.
During Regime I, the addition of exfoliated nanoparticles in PA6 increases Young’s modulus and reduces the rate of strain accumulation at a given cyclic stress. The response of PA6NC during Regime I is similar to that of PA6 at a similar initial strain amplitude of the order of 0.95%, which indicates that the reinforcing effect on the rate of strain accumulation has the same origin as the stiffening effect measured during a tensile test. However, as the cyclic strain is accumulated during Regimes II and III, the rate of strain accumulation of PA6NC and PA6 becomes progressively similar (Fig. 3) at the same maximum stress of 57 MPa, which indicates that the reinforcing effect of the nanopar-ticles is gradually lost. This gradual loss of reinforcing
effect is proposed to originate from the incapacity of the nanoparticles to inhibit molecular events constrained in a volume larger than their interaction volume with the matrix. As indicated by comparing test data for different loading ratios, the accumulation of strain alone cannot account for changes in the storage modulus. Contrary to the accumu-lated strain, the evolution of the storage modulus was found to be approximately independent of the loading ratio and was not recovered upon unloading. For all testing condi-tions, the general effect of cycling was a decrease in the storage modulus. Similar results have been reported previ-ously for polypropylene [46] and polyacetal [32, 47, 48]. It is proposed that the decrease in average stiffness is the result of local rearrangement processes in the chain network activated by the stress fluctuation leading to a relaxation of the stress field in regions of the network that were initially subjected to stresses higher than the average. After Regime I and at the lower maximum cyclic stress of 57 MPa, softening stopped in PA6NC whereas significant stiffening occurred in PA6. Such stiffening has previously been re-ported in conditioned polyamide-66 [32], but not in a poly-acetal copolymer with similar glass transition temperature and crystallinity index [32]. Differential scanning calorim-etry (DSC) measurements on virgin and fatigued specimens of conditioned polyamide-66 [32] and of polypropylene [49] previously indicated small increases in crystallinity related to fatigue-induced damage. However, DSC measure-ments on material taken from fatigued specimens of PA6 and PA6NC did not reveal a difference in crystallinity or crystalline forms. Possible origins for the greater stiffening in PA6 as compared to PA6NC include a higher accumu-lated strain, a higher cyclic strain amplitude, and a different supermolecular structure.
From the measurements of (⌬V/Vo)Accin Fig. 8 and the
observation that the PA6NC used in the current study do form craze-like features during fatigue crack propagation [30], it can be expected that void nucleation and growth become dominant processes in Regime III. This expectation is consistent with the decrease in storage modulus E⬘ and the increase in the loss tangent Tan ␦ measured during Regime III, since the presence of voids leads to an increase of the compliance of a material. Their high surface tension has also been shown to theoretically increase the time-dependent response of polymers [50], leading to reductions in storage modulus E⬘ and increases in the loss tangent Tan ␦. Significant dilatation has been measured previously dur-ing fatigue of polyacetal [51] and polypropylene [52]. As well, observations on fatigued specimens of polypropylene revealed a regularly spaced array of fine crazes with an initial size smaller than 10 m [34]. Based upon these previous reports, the expected nucleation and growth of voids in PA6NC would not necessarily be a direct conse-quence of stress concentration effects near the interface between the nanoparticles and the matrix. Cavitation asso-ciated with Regime III could possibly have been observed in PA6 if the fatigue life had been as high as the 107cycles life obtained for PA6NC at a maximum stress of 57 MPa.
Cavitation, however, is not necessarily detrimental to the mechanical properties. Its effect depends on factors such as the size and distribution of microvoids, the deformation behavior of the matrix, and the specific mechanical proper-ties considered.
CONCLUSIONS
From the fatigue experiments of the present study, it is concluded that:
1) The experimental techniques used in this study allowed quantification of the effect of deformation processes that were small in magnitude and distributed macroscopi-cally homogeneously throughout the bulk of the speci-men gauge section.
2) Variations measured in the accumulated strain, the stor-age modulus, and the loss tangent result from deforma-tion mechanisms related to molecular reorganizadeforma-tions and controlled by common variables of the microstruc-ture, which need to be identified.
3) Exfoliated montmorillonite clay nanoparticles reinforce in situ polymerized PA6 by decreasing the rate of strain accumulation in the initial cyclic straining regime, but this reinforcing effect is gradually lost in the regimes that follow.
4) This gradual loss of the reinforcing effect can be attrib-uted to the incapacity of the nanoparticles to inhibit molecular events of viscoelastic deformation constrained in a volume larger than that of the interactions of these nanoparticles with the matrix.
5) For the nanocomposite, void nucleation and growth can be expected to become a dominant process of deforma-tion in the last regime of fatigue, which would not necessarily be a direct consequence of stress concentra-tion effects of the nanoparticles.
ACKNOWLEDGMENT
The collaboration of UBE Industries for providing the materials is gratefully acknowledged.
NOMENCLATURE
PA6 polyamide-6
PA6NC polyamide-6-based nanocomposite R loading ratio
Min minimum stress
Max maximum cyclic stress
Acc accumulated longitudinal strain
Min minimum strain
Min
1
minimum strain at first loading cycle Min
1
minimum stress at first loading cycle ˙t rate of strain accumulation
t⫹1 accumulated strain at time t ⫹ 1 Nt⫹1 number of loading cycles at time t ⫹ 1
⌬V/Vo volume strain
L longitudinal strain
W strain in specimen width direction
(⌬V/Vo)Accaccumulated volume strain
Tan ␦ loss tangent
⌬t time delay of the strain waveform relative to the stress waveform
mincrease slope of regression in increasing part of cycle bincrease ordinate at origin of regression in increasing
part of cycle
mdecrease slope of regression in decreasing part of cycle bdecrease ordinate at origin of regression in decreasing
part of cycle f frequency E⬘ storage modulus Amp stress amplitude
Amp longitudinal strain amplitude
N number of loading cycles DSC differential scanning calorimetry FTIR Fourier transform infrared XRD X-ray diffraction
REFERENCES
1. L.M. Sherman, Plastics Technol., 45, 52 (1999).
2. M. Alexandre and P. Dubois, Mater. Sci. Eng. Rep., 28, 1 (2000).
3. A. Okada and A. Usuki, Mater. Sci. Eng., C3, 109 (1995). 4. F. Yang, Y. Ou, and Z. Yu, J. Appl. Polym. Sci., 69, 355
(1998).
5. L. Liu, Z. Qi, and X. Zhu, J. Appl. Polym. Sci., 71, 1133 (1999).
6. M.N. Bureau, F. Glowacz, and J. Denault, SPE ANTEC Tech. Pap., Dallas, May 1–5, 59, 2125 (2001).
7. R.A. Kalgaonkar and J.P. Jog, SPE Conf. Polym. Nanocom-posites 2001, Montreal, September 17–19, Paper 20 (2001). 8. N.R. Krishna, N. Bulakh, and J.P. Jog, SPE Conf. Polym.
Nanocomposites 2001, Montreal, September 17–19, Paper 18 (2001).
9. J.A. Lee, T.G. Gopakumar, M. Kontopoulou, and J.S. Parent, SPE ANTEC Tech. Pap., San Francisco, May 5– 8, 60, 2230 (2002).
10. R. Simha, L.A. Utracki, and A. Garcia-Rejon, Compos. Inter-faces, 8, 345 (2001).
11. M.N. Bureau, J. Denault, K.C. Cole, and G.D. Enright, Polym. Eng. Sci., 42, 1897 (2002).
12. L. Penel-Pierron, C. Depecker, R. Seguela, and J.-M. Lefeb-vre, J. Polym. Sci. Part B Polym. Phys., 39, 484 (2001). 13. L. Penel-Pierron, R. Seguela, J.-M. Lefebvre, V. Miri, C.
Depecker, M. Jutigny, and J. Pabiot, J. Polym. Sci. Part B Polym. Phys., 39, 1224 (2001).
Fuku-shima, T. Kurauchi, and O. Kamigaito, J. Mater. Res., 8, 1185 (1993).
15. K. Varlot, E. Reynaud, M.H. Kloppfer, G. Vigier, and J. Varlet, J. Polym. Sci. Part B Polym. Phys., 39, 1360 (2001). 16. F.J. Medellin-Rodriguez, C. Burger, B.S. Hsiao, B. Chu, R.
Vaia, and S. Philips, Polymer, 42, 9015 (2001).
17. G.M. Kim, D.H. Lee, B. Hoffmann, J. Kressler, and G. Stop-pelmann, Polymer, 42, 1095 (2001).
18. E. Carlson and K. Nelson, Automotive Eng., 104, 84 (1996). 19. A. Shah, E.V. Stepanov, G. Capaccio, A. Hiltner, and E. Baer,
J. Polym. Sci. Part B Polym. Phys., 36, 2355 (1998). 20. A. Shah, E.V. Stepanov, A. Klein, A. Hiltner, and E. Baer, J.
Mater. Sci., 33, 3313 (1998).
21. M. Parson, E.V. Stepanov, A. Hiltner, and E. Baer, J. Mater. Sci., 35, 2659 (2000).
22. Y. Zhou, X. Lu, and N. Brown, Polym. Eng. Sci., 31, 711 (1991).
23. E. Jinen, J. Mater. Sci., 22, 1956 (1997).
24. R.W. Hertzberg and JA Manson, Fatigue of Engineering Plastics, Academic Press, New York (1980).
25. R.W. Lang, J.A. Manson, and R.W. Hertzberg, J. Mater. Sci.,
22, 4015 (1987).
26. M.G. Wysgoski and G.E. Novak, J. Mater. Sci., 26, 6314 (1991).
27. J. Karger-Kocsis, Composites, 21, 243 (1990).
28. J.J. Horst and J.L. Spoormaker, Polym. Eng. Sci., 35, 2718 (1996).
29. J.J. Horst and J.L. Spoormaker, J. Mater. Sci., 32, 3641 (1997).
30. S.C. Bellemare, M.N. Bureau, J. Denault, and J.I. Dickson, Polym. Compos., 25, 433 (2004).
31. S. Rabinowitz and P. Beardmore, J. Mater. Sci., 9, 81 (1974). 32. A.J. Lesserm, J. Appl. Polym. Sci., 58, 869 (1995).
33. A. Yamashita, A. Takahara, and T. Kajiyama, Compos. Inter-faces, 6, 247 (1999).
34. Y. Kojima, A. Usuki, M. Kawasumi, A. Okada, Y. Fuku-shima, T. Kurauchi, and O. Kamigaito, J. Mater. Res., 8, 1185 (1993).
35. R.J. Crawford and P.P. Benham, J. Mater. Sci., 9, 1297 (1974).
36. R.J. Crawford and P.P. Benham, Polymer, 16, 908 (1975). 37. S.C. Bellemare, “Effect of Nanoparticles on the Fatigue
Be-havior of a Semicrystalline Polymer,” M.A.Sc. Thesis, E´ cole Polytechnique de Montre´al (2002).
38. O.D. Sherby and J.E. Dorn, J. Mech. Phys. Solids, 6, 145 (1958).
39. S.C. Bellemare, M.N. Bureau, J. Denault, and J.I. Dickson, SPE ANTEC Tech. Pap., 60, 2235 (2002).
40. E. Jinen, J. Mater. Sci., 21, 435 (1986).
41. J. Remmerswaal, 3rd Int. Conf. Low Cycle Fatigue and Elasto-Plastic Behav. Mater., Berlin, 37 (1992).
42. M.J. Mindel and N. Brown, J. Mater. Sci., 8, 863 (1973). 43. M.J. Mindel and N. Brown, J. Mater. Sci., 9, 1661 (1974). 44. M. Doi and S.F. Edwards, The Theory of Polymer Dynamics,
Oxford University Press, New York (1986).
45. I.M. Ward and D.W. Hadley, An Introduction to the Mechan-ical Properties of Solid Polymers, John Wiley & Sons, New York (1993).
46. N.A. Jones and A.J. Lesser, J. Polym. Sci. Part B: Polym. Phys., 36, 2751 (1998).
47. W. Mizuno, M. Kawagoe, J. Qui, and M. Morita, Int. Conf. on Deform., Yield Fracture Polym., Cambridge, UK, April 7–10, 431 (1997).
48. A. Lazzeri, A. Marchetti, and G. Levita, Fatigue Fracture Eng. Mater. Struct., 20, 1207 (1997).
49. J.-P. Trotignon and J. Verdu, J. Appl. Polym. Sci., 34, 19 (1987).
50. E.J. Kramer and L.L. Berger, Adv. Polym. Sci., 91/92, 1 (1990).
51. A.J. Lesser, Polym. Eng. Sci., 36, 2366 (1996).