The BRAIN Initiative Cell Census Consortium: Lessons
Learned toward Generating a Comprehensive Brain Cell Atlas
The MIT Faculty has made this article openly available.
Please share
how this access benefits you. Your story matters.
Citation
Ecker, Joseph R., Daniel H. Geschwind, Arnold R. Kriegstein, John
Ngai, Pavel Osten, Damon Polioudakis, Aviv Regev, Nenad Sestan,
Ian R. Wickersham, and Hongkui Zeng. “The BRAIN Initiative
Cell Census Consortium: Lessons Learned Toward Generating
a Comprehensive Brain Cell Atlas.” Neuron 96, no. 3 (November
2017): 542–557.
As Published
http://dx.doi.org/10.1016/J.NEURON.2017.10.007
Publisher
Elsevier BV
Version
Author's final manuscript
Citable link
http://hdl.handle.net/1721.1/119192
Terms of Use
Creative Commons Attribution-NonCommercial-NoDerivs License
The BRAIN Initiative Cell Census Consortium: Lessons Learned
Toward Generating a Comprehensive Brain Cell Atlas
Joseph R. Ecker1, Daniel H. Geschwind2, Arnold R. Kriegstein3, John Ngai4,5, Pavel
Osten6, Damon Polioudakis2, Aviv Regev7, Nenad Sestan8, Ian R. Wickersham9, and
Hongkui Zeng10
1Genomic Analysis Laboratory and Howard Hughes Medical Institute, Salk Institute for Biological
Studies, La Jolla, CA 92037, USA
2Program in Neurogenetics, Departments of Neurology and Human Genetics, David Geffen
School of Medicine, University of California, Los Angeles, Los Angeles, CA 90095, USA
3Eli and Edythe Broad Center of Regeneration Medicine and Stem Cell Research, Department of
Neurology, University of California, San Francisco, San Francisco, CA 94143, USA
4Department of Molecular and Cell Biology, Helen Wills Neuroscience Institute, QB3 Functional
Genomics Laboratory, University of California, Berkeley, Berkeley, CA 94720, USA
6Cold Spring Harbor Laboratory, Cold Spring Harbor, NY 11724, USA
7Klarman Cell Observatory, Broad Institute of MIT and Harvard, Department of Biology, Koch
Institute of Integrative Cancer Research, and Howard Hughes Medical Institute, Massachusetts Institute of Technology, Cambridge, MA 02142, USA
8Departments of Neuroscience, Genetics, Psychiatry and Comparative Medicine, Program in
Cellular Neuroscience, Neurodegeneration and Repair, Yale Child Study Center, Kavli Institute for Neuroscience, Yale School of Medicine, New Haven, CT 06510, USA
9McGovern Institute for Brain Research, Massachusetts Institute of Technology, Cambridge, MA
02139, USA
10Allen Institute for Brain Science, Seattle, WA 98109, USA
Abstract
A comprehensive characterization of neuronal cell types, their distributions and patterns of connectivity is critical for understanding the properties of neural circuits and how they generate behaviors. Here we review the experiences of the BRAIN Initiative Cell Census Consortium – ten pilot projects funded by the U.S. BRAIN Initiative – in developing, validating and scaling up emerging genomic and anatomical mapping technologies for creating a complete inventory of neuronal cell types and their connections in multiple species and during development. These
5Lead contact and corresponding author: [email protected].
Publisher's Disclaimer: This is a PDF file of an unedited manuscript that has been accepted for publication. As a service to our
HHS Public Access
Author manuscript
Neuron
. Author manuscript; available in PMC 2018 November 01.Published in final edited form as:
Neuron. 2017 November 01; 96(3): 542–557. doi:10.1016/j.neuron.2017.10.007.
A
uthor Man
uscr
ipt
A
uthor Man
uscr
ipt
A
uthor Man
uscr
ipt
A
uthor Man
uscr
ipt
projects lay the foundation for a larger and longer-term effort to generate whole-brain cell atlases in species including mice and humans.
In Brief
In this Perspective, Ecker et al. discuss the efforts of the BRAIN Initiative Cell Census Consortium, ten pilot projects whose collective goal was to develop and validate methods for generating comprehensive atlases of neuronal cell types in the mammalian brain.
Introduction
Elucidating the properties of neural circuits and how they lead to the generation of behaviors requires an understanding of the cell types that comprise these circuits and their roles in processing and integrating information. However, since the initial discovery of diverse neuronal cell types over a century ago by Ramon y Cajal (Ramon y Cajal, 1899), we have yet to obtain a full description of the different cell types present in the mammalian brain. Historically, neuronal cell types have been characterized and classified based upon a number of parameters either singly or in combination, such as anatomical location, cell morphology, patterns of connectivity, intrinsic physiological properties, synaptic properties, and
expression of certain marker genes - ion channels, receptors or other proteins. Some notable approaches have included classification of cortical interneurons based on morphological and electrophysiological features and expression of selected ion channel and receptor genes (DeFelipe et al., 2013; Druckmann et al., 2013; Gupta et al., 2000; Klausberger and Somogyi, 2008; Pfeffer et al., 2013) and generation of mouse strains in which subsets of neurons are genetically labeled (Gong et al., 2003; Madisen et al., 2010; Taniguchi et al., 2011). Genome-wide transcriptome profiling technologies – first with DNA microarrays and later by high-throughput DNA sequencing – allowed the characterization of broad cell classes by brain region, cortical cell layers or developmental stages (Abrahams et al., 2007; Arlotta et al., 2005; Belgard et al., 2011; Bernard et al., 2012; Chen et al., 2005; Doyle et al., 2008; Fertuzinhos et al., 2014; Hawrylycz et al., 2012; Oldham et al., 2008; Sugino et al., 2006). However, such profiles represent averages of gene expression manifested by
individual cells and therefore cannot capture the individual variation found within a complex population. Similarly, analysis and cataloging of gene expression patterns of all genes expressed in the central nervous system by RNA in situ hybridization (Lein et al., 2007) can define broad classes of cells, but can neither prospectively predict nor distinguish closely related cells that are defined by the co-expression of subsets of cell type-specific genes. While these approaches are all powerful in their own right, each alone cannot fully describe a neuron and its properties, and therefore the diversity of neuronal cell types in the
mammalian brain. Developing a rational and comprehensive taxonomy of neuronal cell types in the mammalian brain requires information about a cell’s location, morphology, connectivity, physiology and molecular identity. Information from these parameters must then be unified in order to generate a comprehensive description of a cell’s identity and function in the nervous system.
Recent advances in high-throughput DNA sequencing technologies have enabled the interrogation of gene expression at the single cell level (Jaitin et al., 2014; Marinov et al.,
A
uthor Man
uscr
ipt
A
uthor Man
uscr
ipt
A
uthor Man
uscr
ipt
A
uthor Man
uscr
ipt
2014; Ramskold et al., 2012; Shalek et al., 2013; Shapiro et al., 2013; Tang et al., 2009; Tang et al., 2011; Wagner et al., 2016; Wu et al., 2014; Yan et al., 2013). By applying a battery of statistical tools to cluster cells based on their similarities in gene expression, it is then possible to identify, group and classify discrete cell types and cell stages within a heterogeneous population. Accordingly, over the last several years the advent of such single cell transcriptome profiling – also referred to as single-cell RNA-sequencing or single-cell RNA-seq – has fueled an explosion of new information on the complexity of cell types in the nervous system based on genes expressed by individual cells (Poulin et al., 2016; Zeng and Sanes, 2017). However, since a cell’s transcriptome represents just one aspect of its identity, additional work is needed to integrate other structural and functional features – distribution, morphology, connectivity and physiology – in order to devise a principled framework with which to create a taxonomy of cell types in the brain. From a practical standpoint,
knowledge of the genes expressed by specific neurons also provides information to target genetically encoded reporters and actuators to these newly discovered cell types (Huang and Zeng, 2013). Thus, an initial classification based on transcriptomic data has the potential to be a foundational tool in characterizing and eventually unifying a cell’s anatomical, morphological and physiological properties to provide a comprehensive description of that cell and its function in the neural circuit in which it resides.
More recently, a variety of single cell epigenomic assays have been developed (Clark et al., 2016; Schwartzman and Tanay, 2015). These methods allow assessment of chromosome conformation, open chromatin and DNA methylation, among others, providing
complementary approaches to transcriptome profiling for classifying cell types based on differences in their epigenomic landscapes. Ideally, future cell census surveys might employ “multi-omic” approaches, combining transcriptomics, epigenomics and proteomics in single cells to further increase the power of molecular approaches to help discriminate cell subtypes and transition states (Macaulay et al., 2017).
The BRAIN Initiative Cell Census Consortium
On April 2, 2013, United States President Barack Obama announced the Brain Research through Advancing Innovative Neurotechnologies (BRAIN) Initiative, a grand challenge to develop new tools to accelerate and deepen our understanding of human brain function in health and disease. Soon thereafter, the U.S. National Institutes of Health (NIH) Director Francis Collins convened a working group charged with developing a strategic vision for the BRAIN Initiative. Following intensive consultations with members of the scientific
community in diverse areas of the field, on June 5, 2014, the BRAIN Initiative working group delivered BRAIN 2025: A Scientific Vision, a comprehensive document outlining a bold plan for the U.S. BRAIN Initiative (https://www.braininitiative.nih.gov/pdf/
BRAIN2025_508C.pdf). BRAIN 2025 proposed an initial period of intensive technology development and validation followed by a transition to applying the newly generated tools to basic neuroscientific discovery and amelioration of human neurological diseases. The plan laid out 7 major goals to be accomplished over a 10-year period, of which the first two were (1) to identify and provide experimental access to different brain cell types to determine their roles in health and disease, and (2) to map their connections at multiple scales ranging from synapses to the entire brain. To initiate efforts toward these goals, in late 2013 the NIH
A
uthor Man
uscr
ipt
A
uthor Man
uscr
ipt
A
uthor Man
uscr
ipt
A
uthor Man
uscr
ipt
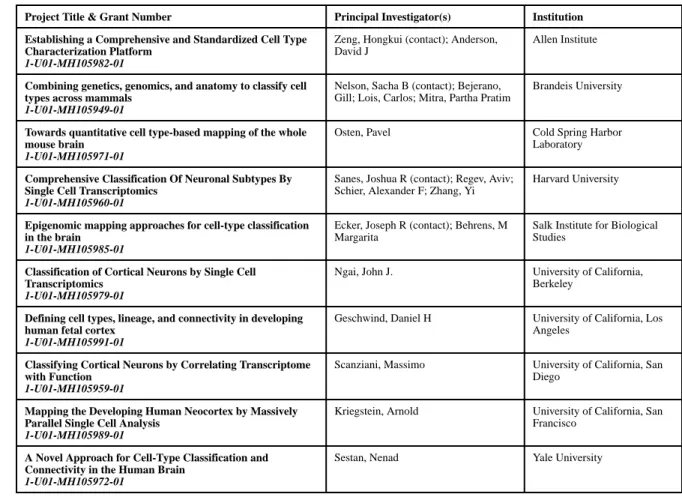
released a Funding Opportunity Announcement (FOA) entitled BRAIN Initiative: Transformative Approaches for Cell-Type Classification in the Brain (U01) (https:// grants.nih.gov/grants/guide/rfa-files/RFA-MH-14-215.html). This FOA was written in recognition of not only the importance and difficulties in generating a comprehensive taxonomy or “parts list” of cell types in the brain, but also the rapid advances being made in single cell genomics, genetics and anatomical tracing technologies. The stated purpose of this BRAIN Initiative FOA was to pursue pilot demonstration projects aimed at developing classification strategies for generating a systematic inventory or cell census of cell types and their connections in the brain. Ten projects were ultimately funded in response to this FOA in late September, 2014, spanning multiple approaches (single cell transcriptomics, epigenomics, transgenesis, cell type distribution and connectivity mapping) and species (mice, rats, zebrafish and humans) (Table 1). These pilot projects would collectively test and validate emerging methodologies in order to determine their utility and scalability as the field was anticipated to move toward tackling a comprehensive cell atlas of the human brain in the future.
To coordinate efforts among the projects and maximize sharing of know-how and data, the ten funded groups were organized into the BRAIN Initiative Cell Census Consortium (BICCC). The common goal of the BICCC was to develop and evaluate classification and mapping strategies for generating a systematic inventory or census of cell types in the brain and to use the group’s shared experience to help guide the direction of the BRAIN Initiative Cell Census program. In just under 3 years, the BICCC collectively produced 50
publications providing insights into the cellular diversity and connectivity of the nervous system of multiple species and over developmental time, and further developed an array of experimental and computational tools aimed at characterizing and classifying cell types in the brain and other organ systems (Table S1). Some of the key accomplishments by BICCC members and their ramifications for scaling up to a whole-brain cell atlas are highlighted below in the context of several rapidly evolving areas of research.
Single-Cell Transcriptomics
The BICCC projects were initiated in late 2014, just as methods for performing single-cell RNA-seq were becoming robust enough to be performed reliably and platforms and reagents were becoming commercially available. The field was and remains in a state of rapid flux, with both technical and analytic methods changing quickly. Since single-cell RNA-seq was expected to play a critical role in the generation of a whole-brain cell atlas, at the inception of the project period the consortium recognized that issues of cell isolation, cell throughput and data analysis needed to be addressed to enable future efforts aimed at identifying all major cell types in the mammalian brain.
Lessons learned from different single-cell capture and sequencing platforms
Tissue must be dissociated into a cell suspension and then individual cells captured. The dissociation steps and time cells spend in a suspension may alter gene expression profiles from the stress of the dissociation and resting in a suspension. In addition, biases in the population captured could be introduced if certain classes of cells are more fragile or
A
uthor Man
uscr
ipt
A
uthor Man
uscr
ipt
A
uthor Man
uscr
ipt
A
uthor Man
uscr
ipt
susceptible to breakage during these steps. Finally, the frequency of co-isolating multiple cells for library preparation (cell doublets), when a single cell is expected must be carefully monitored and is dependent on both cell type (size, buoyancy, etc.), and capture method. In general, there are three main strategies for cell sorting and capture: (1) Fluorescence-activated cell sorting (FACS) into individual wells (Tasic et al., 2016; Trombetta et al., 2014), (2) microfluidics devices of which Fluidigm’s C1 was the most popular at the inception of the BICCC project (Pollen et al., 2015; Wu et al., 2014), and (3) “ultra-high throughput” droplet-based technologies (Klein et al., 2015; Macosko et al., 2015; Zheng et al., 2017), which were first reported early in the BICCC project period.
Table 2 summarizes single-cell RNA-seq studies from labs around the world using these platforms to identify cell types from various brain regions, structures and neural stem cell models. The major biological advance achieved thus far by single-cell RNA-seq is the ability to identify major cell types in a tissue. Importantly, these investigations validate the efficacy of single-cell approaches for cataloging cell types, discovering novel subtypes, as well as identifying cell type-specific marker genes. Among these are several notable studies from BICCC member groups. The Sanes and Regev groups helped to develop the ultra-high-throughput Drop-seq method and used it to confirm the identities of many mouse retinal cell types, including the complete repertoire of bipolar cells (Macosko et al., 2015; Shekhar et al., 2016). The Regev group developed new single-nucleus RNA-seq technologies including Div-Seq (Habib et al., 2016), which combines sNuc-Seq with pulse labeling of proliferating cells to profile individual dividing cells along a developmental lineage, and DroNc-seq (Habib et al., 2017), a high-throughput droplet-based sNuc-seq method. The Zeng group used Smart-seq to perform full-length, deep sequencing of cells from mouse primary visual cortex, and identified 49 neuronal and non-neuronal cell types (Tasic et al., 2016). The Kriegstein and Sestan groups used the Fluidigm C1 coupled with Smart-seq to identify genes preferentially expressed in the early neuroepithelial cells and outer radial glia of the human prenatal neocortex, and relate these molecular signatures with the distinctive function of these progenitor cell types (Nowakowski et al., 2016b; Onorati et al., 2016; Pollen et al., 2015). The Ngai group used the Fluidigm C1 platform combined with a newly-devised lineage analysis algorithm to identify the first transitions made by an adult neural stem cell as it differentiates to produce either neuronal or non-neuronal cells (Fletcher et al., 2017). Together these studies demonstrate the diverse range of approaches that different BICCC groups have taken to tackle issues pertaining to cell type classification in a variety of neural tissues.
In anticipation of the scaling up of single-cell transcriptomics for deriving a mouse or human whole-brain cell atlas, we offer our perspectives on two (among many) key issues likely to be encountered moving forward. The first issue involves sampling strategies, the choice of sequencing platforms, and the balance between deep sequencing on fewer cells versus shallow sequencing on many more cells. Procedures using Smart-seq, Smart-seq2 and related sequencing techniques provide deep and comprehensive full-length coverage of a cell’s transcriptome, typically resulting in detection of 5,000–10,000 expressed genes per cell at read depths of 0.5–10 million reads per cell (Shalek et al., 2013; Tasic et al., 2016). Smart-seq2 was shown in a six-method comparative study to have the most robust performance in terms of sensitivity and accuracy (Ziegenhain et al., 2017). A drawback of
A
uthor Man
uscr
ipt
A
uthor Man
uscr
ipt
A
uthor Man
uscr
ipt
A
uthor Man
uscr
ipt
this approach is the relatively high cost of scaling up, although the cost is gradually coming down and recent studies showed it is not necessary to sequence more than 1 million reads per cell (Ziegenhain et al., 2017). In contrast, droplet-based methods (Klein et al., 2015; Macosko et al., 2015; Zheng et al., 2017) allow the capture of thousands of cells per experiment, with highly economical library construction costs on a per-cell basis owing to the multiplexing of individual cell samples and in principle introducing less amplification biases owing to the use of unique molecular identifier (UMI) sequences (Ziegenhain et al., 2017). The main drawbacks of droplet-based methods are that the molecular barcodes limit sequence analysis to short stretches at the mRNA’s 3’ end and therefore cannot give information about mRNA isoforms, and that the number of genes detected per cell is low (1,000–2,000 genes/cell) due to the shallow sequencing depths (10–30K reads/cell). Lowly-expressed genes are the most affected by drop-out noise, and these lowly Lowly-expressed genes may be of great interest, such as transcription factors. Furthermore, significant differences in both the level and pattern of expression between 3’ untranslated region and protein coding sequence of the same gene suggest that some caution is warranted in interpreting results based solely on 3’ end RNA-sequencing (Kocabas et al., 2015). Droplet-based methods nonetheless appear to be quite effective in discriminating closely related cell types in at least some cases (Campbell et al., 2017; Shekhar et al., 2016), presumably because of the
statistical power afforded by the analysis of massive numbers of cells (tens to hundreds of thousands or more) and the coordinated regulation of genes within a limited number of transcriptional networks.
Current studies have yet to provide a clear answer as to which approach is more effective at discerning cell types: deeper sequencing on fewer cells or shallower sequencing on more cells. Moreover, for cost calculations one needs to know how deep the sequencing has to be on the one hand and how many more cells are needed on the other, to generate comparable results. A head-to-head comparison of the two approaches for the same region is needed. Regardless, the two approaches are clearly complementary; each will certainly find its own unique utility or application, and cross-comparison will be mutually informative.
The second key issue involves the multiple computational challenges in the analysis of the massive amount of transcriptomics data to be generated for the whole-brain cell atlases (Stegle et al., 2015; Wagner et al., 2016). Major challenges include the ability to process and analyze the sheer volume of the sequencing data, the normalization of datasets across different batches, tissue areas and labs, the clustering analysis of the datasets and the differential complexity that may be present in different areas, the cross-correlation of results obtained from different approaches (e.g., single-cell versus single-nucleus sequencing, Smart-seq versus droplet-based sequencing), and finally, the criteria of how to define a cell type and how to distinguish cell types from the different states (developmental or
physiological) of the cells. For each of these challenges, many methods have been, and will continue to be developed. It will be critical to test and compare these methods and develop an optimal set of computational tools that will help us to mine and properly understand the extraordinary amount of information contained within these datasets.
A
uthor Man
uscr
ipt
A
uthor Man
uscr
ipt
A
uthor Man
uscr
ipt
A
uthor Man
uscr
ipt
Single-nucleus RNA-sequencing and the human brain atlas
A comprehensive adult cell atlas will involve multiple brain regions across multiple individuals and will need to consider age, potentially including adolescent, mid-life and elderly, as an important variable. Unlike the mouse atlas, however, an adult human brain cell atlas will by necessity rely on post mortem tissue donations, and will not be derived from fresh tissue samples. As an alternative to whole cell sequencing, analysis of nuclear RNA from single nuclei harvested from snap frozen samples appears to be the most promising approach for analysis of human brain tissue (Lake et al., 2016). Another advantage of analyzing RNA from nuclei vs. whole cells is that the former obviates under-representation of neuronal cell types that may be differentially lost during cell isolation procedures. Single-nucleus RNA-sequencing (variously referred to as snRNA-seq, sNuc-seq, Div-Seq, DroNc-seq) has its challenges in that nuclear RNA is less abundant than cellular RNA, and includes precursor RNAs containing introns in various stages of processing. However, results similar to whole-cell RNA-seq have recently been reported, indicating that single-nucleus RNA-seq is a viable alternative for many experimental designs (Habib et al., 2017; Habib et al., 2016; Krishnaswami et al., 2016; Lacar et al., 2016; Lake et al., 2016). Work will need to be done to harmonize human data with data from mouse and other species where fresh tissue and whole cell seq will be performed. Comparisons of single-nucleus vs. single-cell RNA-seq data in the mouse may prove useful in providing a ‘Rosetta Stone’ to facilitate
comparisons across platforms.
Metadata standards for single cell experiments
A key objective of the BICCC was collaborative sharing of data and expertise among consortium members. A clear requisite to productive exchange of data was a defined set of standards for the minimum metadata required to ensure that data could be easily interpreted between groups and that results derived from its analysis could be independently verified. To that end, the BICCC developed a template of the minimum metadata to be collected and shared for each single-cell RNA-seq experiment (Table S2). The goal was to establish a standard for recording and reporting single-cell transcriptomic data to expedite the establishment of a data repository, facilitate cross analysis of datasets and development of analysis methods, and provide a rubric for others entering the field.
Single cell data portal
A main goal of the BICCC since its inception was effective dissemination and sharing of data, results and resources. The BICCC effort provided a key impetus and driving project for the development of the Single Cell Portal at the Broad Institute (https://
portals.broadinstitute.org/single_cell), which serves as a repository to organize, distribute, and facilitate comparison of single-cell datasets. The current Portal already serves single-cell and single-nucleus transcriptional and other profiles in a scalable manner. It relies on scalable and elastic cloud computing infrastructure to accommodate massive datasets and will grow in the near future to address other datasets of interest, such as spatially resolved data. For single-cell and single-nucleus RNA-seq, the portal both stores the raw data and contains visualizations and querying for the diverse analyses, including: (1) Quantifying the expression of a given gene across cell types, shown in several popular modalities; (2)
A
uthor Man
uscr
ipt
A
uthor Man
uscr
ipt
A
uthor Man
uscr
ipt
A
uthor Man
uscr
ipt
Showing cluster membership of individual cells from an experiment based on expression profiles (in several modalities); (3) ‘Painting’ cell clusters (ordinations) by metadata; (4) Providing pre-defined gene signatures for visualization; (5) Visualizing gene signatures by several modalities, including heat maps and ‘dot plots.’ Many additional features are in development. The Portal accepts any and all single-cell and single-nucleus data and ensures its release. It allows users to work privately (e.g., with a set of colleagues) or to publish publicly. At this time, to protect the privacy of human subjects, the portal does not store raw human sequence data, although this could be modified for open access data. As of August 2017, the data in the portal (both publicly available and private) comes from 80 studies comprising >460,000 single cells and nuclei, including all the pilot data of the BICCC program. The Single Cell Portal is scaled to handle a much larger scope of data that are anticipated by this and similar efforts in the future.
Single-Cell Epigenomics
Single-cell epigenomic profiling methods provide powerful new tools that are orthogonal to and extend the utility of RNA profiling methods for cell type classification (Clark et al., 2016; Schwartzman and Tanay, 2015). While gene expression and epigenomic profiles reveal how cell types differ, epigenomic profiles also reveal the regulatory elements and associated transcription factors that potentially drive these differences. The expression of mammalian genes is controlled by proximal regulatory sequences (i.e., promoters) and distal regulatory elements known as enhancers. The epigenomic state at enhancers, including open chromatin as measured by DNase hypersensitivity (Thurman et al., 2012; Vierstra et al., 2014) and DNA methylation as measured by whole genome bisulfite sequencing (Schultz et al., 2015; Ziller et al., 2013), is highly dynamic and variable between different cell and tissue types.
The Assay for Transposase-Accessible Chromatin or ATAC-seq method utilizes Tn5 transposase to probe chromatin by simultaneously creating double strand breaks at accessible sites in regions of open chromatin and ligation of oligonucleotide sequences for DNA barcoding and amplification to tag those sites in single nuclei (Buenrostro et al., 2013; Buenrostro et al., 2015). A study of hematopoietic differentiation using single-cell ATAC-seq revealed that chromatin accessibility at enhancers was more effective at classifying cell types than gene expression profiles (Corces et al., 2016). Combinatorial indexing now enables use of single-cell ATAC-seq for profiling open chromatin in single cells on a large scale (Cusanovich et al., 2015). Recently, single-nucleus ATAC-seq has been applied to characterize mouse forebrain over eight developmental stages, generating over 18,000 chromatin accessibility profiles of individual nuclei using either fresh or frozen tissue (Preissl et al., 2017).
Similarly, highly distinct genome-wide patterns of cytosine DNA methylation (mC) have been observed in various mammalian organs including the brain (Kozlenkov et al., 2016; Mo et al., 2015). Interestingly, the Ecker group found that unlike most other cell types in the body, neurons contain unusually high levels of non-CG methylation (called mCH, where H is A,T or C) (He and Ecker, 2015) as well as measurement (albeit at much lower levels) of an oxidized form of methylation called 5hmC, which has been suggested to be involved in
A
uthor Man
uscr
ipt
A
uthor Man
uscr
ipt
A
uthor Man
uscr
ipt
A
uthor Man
uscr
ipt
mC turnover among other functions (Wu and Zhang, 2017). Immune-enrichment methods using antibodies against native proteins such as NeuN (Lister et al., 2013) or transgenic methods as shown by the Ecker and Allen Institute groups (Gray et al., 2017; Mo et al., 2015) followed by FACS or affinity purification have allowed construction of high resolution epigenomic maps of purified populations from human and mouse brains including
excitatory, inhibitory as well as non-neuronal cells. More recently, the Ecker group developed a new single-nucleus methylome sequencing method called snmC-seq, which allowed a direct comparison of cell-type composition in mouse and human cortices using ~6000 cells and identified 16 mouse and 21 human neuronal subpopulations in the frontal cortex along with regulatory elements with differential methylation across neuron types (Luo et al., 2017).
Importantly, since epigenomic profiles can be linked to predicted differences in gene expression, it is possible to link cell types predicted by gene expression datasets to those identified by epigenomic profiling. Unlike RNA signatures, epigenomic profiling uniquely identifies the marks of gene regulatory elements that drive cell type differences and these can be used to create new tools to achieve cell type specific expression (Visel et al., 2007). Computational approaches that combine various epigenomic signatures such as chromatin modifications/structure and DNA methylation variation allow pinpointing of relatively small (~500–1000 bp) cell-type specific enhancers (Dickel et al., 2016; He et al., 2017; Monti et al., 2017). Similar collections of brain cell type-specific enhancers would provide a means to generate new reagents to target transgene expression to brain regions either in transgenic mice as shown by the Nelson group (Shima et al., 2016) and others (Silberberg et al., 2016), or with viral vectors (Dimidschstein et al., 2016), linking back diverse cell types to their locations/anatomical features in the whole brain.
Anatomy and Connectivity
Historically, neuronal anatomy, including the location and size of the soma, the size and appearance of dendritic trees, the presence of dendritic spines, and the long-range and local axon projections and arborizations, has been used most widely as a qualitative descriptor for classification of neurons in different parts of the brain (Bota and Swanson, 2007). The single-cell RNA-seq and single-cell epigenomic profiling described above aim to use transcriptomic and epigenomic information for systematic cell type classification across the entire mouse brain, promising to greatly expand the current “parts list” of cell type-based composition of the mammalian brain. Yet, the true test of the transcriptome-based classification will be the demonstration of shared anatomical features and physiological characteristics matched to these putative cell types. Therefore, the second major focus of the BICCC efforts was on the development of new instruments and methods for translating the molecularly based classification into a complete description of neuronal cell types and cell type-specific circuits across the entire brain, with the overall aim of providing a means of mapping this information onto a reference brain atlas.
A
uthor Man
uscr
ipt
A
uthor Man
uscr
ipt
A
uthor Man
uscr
ipt
A
uthor Man
uscr
ipt
Automated light microscopy methods for whole-brain imaging
The focus on whole-brain and quantitative anatomical analyses that could generate comprehensive resource datasets for the broad neuroscience community required new microscopy instruments and anatomical procedures capable of transforming the traditional labor-intensive procedures of brain slicing, staining, mounting and manual imaging into standardized and largely automated whole-brain mapping methods. At the same time, it was and remains critical that these methods maintain the rigorous quality and level of detail seen in traditional neuroanatomical studies, including detailed visualization of dendritic
morphologies with dendritic spines and terminal axonal arborizations with presynaptic varicosities (boutons).
The first automated microscopy for imaging whole mouse brains was based on the principle of light-sheet fluorescence microscopy (LSFM, also known as selective plane illumination microscopy or SPIM), which combines illumination of a chemically cleared transparent sample by a thin light-sheet and orthogonal imaging by a fast sCMOS camera (Dodt et al., 2007; Huisken et al., 2004). Although improvements in LSFM spatial resolution have been achieved (Fahrbach et al., 2013; Keller et al., 2010; Vettenburg et al., 2014), LSFM-based imaging of large tissue volumes still lacks the spatial resolution needed to resolve fine structures, such as dendritic spines or axonal terminals, throughout the whole mouse brain. Thus, in our view, LSFM is not yet applicable for rigorous anatomical studies in the mouse. Several alternative microscopy methods that enable automated collection of large volume datasets at high-resolution have been developed by integrating whole-mount fluorescence imaging and mechanical sectioning of the imaged top portion of the tissue, starting with serial two-photon tomography (STPT) that integrates two-photon microscopy and vibratome-based sectioning (Economo et al., 2016; Ragan et al., 2012), two-photon fluorescence micro-optical sectioning tomography system (2p-fMOST) integrating two-photon microscopy and microtome-based sectioning (Zheng et al., 2013), brain-wide precision imaging system (BPS) integrating wide-field fast structured illumination microscopy and microtome-based sectioning (Gong et al., 2016), block-face serial microscopy tomography (FAST) integrating Nipkow spinning disk-based confocal
microscopy and vibratome sectioning (Seiriki et al., 2017), and most recently oblique light-sheet tomography (OLST) integrating light-light-sheet microscopy and vibratome-based
sectioning developed by the Osten group (unpublished). These methods can achieve micron or even submicron voxel resolution throughout the whole mouse brain, enabling automated and standardized collection of serial section datasets with the spatial resolution needed for detailed anatomical studies.
Methods for whole-brain anatomical atlasing
The next challenge in applying these methods for anatomical studies is to develop
computational methods for automated reconstruction, registration, anatomical segmentation, and data analysis of the whole brain datasets, which range in scale from hundreds of gigabytes for spatially down-sampled STPT brains (Kim et al., 2017; Oh et al., 2014; Ragan et al., 2012) to more than 10 terabytes for full resolution mouse brains imaged, for example, at 0.3 × 0.3 × 1 Pm either by STPT (Economo et al., 2016) or the BPS system (Gong et al.,
A
uthor Man
uscr
ipt
A
uthor Man
uscr
ipt
A
uthor Man
uscr
ipt
A
uthor Man
uscr
ipt
2016). Computational efforts have led to the development of new neuroinformatics tools necessary for standardized digital atlasing of mouse brain datasets, which became known as the Allen Brain Atlas (ABA) and Mouse Common Coordinate Framework (CCF)
(Hawrylycz et al., 2011; Kuan et al., 2015; Ng et al., 2009; Ng et al., 2007; Oh et al., 2014). The ABA and CCF pipelines have since been adapted by the Osten lab for three-dimensional registration of STPT whole-brain datasets (size ~200 GB) (Kim et al., 2015) and for large volume mouse brain datasets reaching or even exceeding 10 terabytes.
Methods for cell type-specific labeling and tracing of neuronal anatomy
Sparse labeling of brain cytoarchitecture by the Golgi method transformed neuroanatomy at the turn of the last century (Golgi, 1873; Ramón y Cajal, 1904), enabling detailed
visualization of single cell morphologies across the entire brain. Today, similar sparse visualization of specific cell types in the mouse brain is possible by viral vector-based labeling in driver mouse lines that use one or more of cell type-specific genes to express Cre or Flp recombinase (He et al., 2016; Madisen et al., 2010; Taniguchi et al., 2011). These viruses typically express green fluorescent protein (GFP) in a way that is dependent on Cre- or Cre/Flp-mediated recombination and can be used for monosynaptic or transsynaptic anterograde or retrograde labeling of the infected neurons (Harris et al., 2012; Kato et al., 2011; Mazarakis et al., 2001; Soudais et al., 2004; Tervo et al., 2016; Wickersham et al., 2007a).
For targeting and labeling of neurons that are synaptically connected with a defined starting neuronal population, the monosynaptic tracing paradigm in which a deletion-mutant virus is complemented in situ to allow it to complete one replication cycle and cross a single synaptic step (Wickersham et al., 2007b) constitutes the primary available solution. For retrograde monosynaptic tracing, i.e., labeling neurons directly presynaptic to a defined population, the original rabies virus -based system (Wickersham et al., 2007b) has been refined in ways that range from improvements in the complementing helper viruses (Kim et al., 2016; Kohara et al., 2014; Liu et al., 2017; Miyamichi et al., 2013; Wall et al., 2010) to the use of a rabies virus strain with reduced toxicity (Reardon et al., 2016) and the addition of a destabilization domain to the viral nucleoprotein (Ciabatti et al., 2017). Although there are fewer tools available, anterograde monosynaptic tracing – i.e., labeling neurons directly postsynaptic to a starting population – based on the vesicular stomatitis virus or herpes simplex virus has been described (Beier et al., 2011; Zeng et al., 2017). More recently, AAV serotype 1 and 9 were shown to cross synapses in the anterograde direction as well (Zingg et al., 2017). Finally, a novel method to trace anterograde projections at potentially large scale and single-cell resolution is based on viral expression and subsequent sequencing of short barcoded sequences (Kebschull et al., 2016); however this approach has yet to be made compatible with morphological anatomical reconstructions or mapping of synaptic connections.
Methods for computational neuroanatomy
Computational methods for automated signal detection and data analysis represent the remaining needed pieces in the method toolbox for high-throughput and standardized whole-brain anatomical studies are. The Seung lab at Princeton has pioneered the use of supervised
A
uthor Man
uscr
ipt
A
uthor Man
uscr
ipt
A
uthor Man
uscr
ipt
A
uthor Man
uscr
ipt
machine learning (convolutional neural networks; CNNs) for anatomical studies, both for dense neural circuit reconstructions from three-dimensional electron microscopy images (Kim et al., 2014; Turaga et al., 2010) and reconstructions of somatodendritic neuronal morphologies from light microscopy images (Sümbül et al., 2014). The Sümbül group together with the Osten lab is currently working on adapting the CNN approach for
automated reconstructions of neuronal morphologies in OLST-imaged mouse brains and this method will be usable for morphological reconstructions in datasets imaged by other high-resolution light microscopy methods. The Ultratracer is an alternative approach for automated neuronal reconstructions in whole-brain datasets based on maximum likelihood estimation (MLE) (Peng et al., 2017). Finally, in addition to the morphological
reconstructions, the Osten lab has also established STPT- and CNN-based imaging and computational pipeline for automated and quantitative mapping of cell type distribution, including precise cell counts and cell densities for all anatomical regions of the mouse brain (Kim et al., 2017). This early work thus demonstrates the power of such unbiased brain-wide anatomical studies in translating the cell type knowledge into a deeper understanding of the organization of brain structure.
In summary, the development of the automated microscopy methods and computational pipelines for whole-brain analyses promises to greatly advance our understanding of cell type-based mouse brain anatomy. Furthermore, as these methods, with some modifications, are also applicable to other species, we anticipate that these technological advances will bring in a new era of comparative neuroanatomy, one that will enable a much deeper understanding of the evolution of the vertebrate brain.
The Developing Human Brain in Health and Disease
A cell atlas of the developing human brain will be an important part of the comprehensive human brain project. A map of cellular brain development will help define lineage and intrinsic fate determining steps leading to cellular diversity in the adult brain. It may help disentangle cell states from distinct cell types, and it will serve as an invaluable map against which cell specific features of diseases can be determined. We lack a clear understanding of the pathophysiology of most psychiatric disorders, many of which begin in utero as
neurodevelopmental disorders. A reference atlas of cell types in the adult brain alone will not likely capture the most interesting or important molecular signatures related to disease onset; these insights will require a cell atlas of the developing brain. Additionally, while there is growing enthusiasm for using patient-derived stem cell models to study human diseases, all the in vitro models produced so far generate cells or tissues corresponding to early fetal development (Camp et al., 2015). A reference cell atlas of normal human brain development is needed to calibrate human stem cell models of brain development and to help interpret disease phenotypes.
Work on an early draft atlas of the developing human cortex has begun as part of the pilot phase of the BICCC. Single-cell RNA-seq has added a new dimension of gene expression to more traditional features such as topographical location, morphology, cell behavior, and physiology to approach an integrative definition of progenitor cells and immature neurons in the developing human neocortex. For example, single-cell genomics analysis including from
A
uthor Man
uscr
ipt
A
uthor Man
uscr
ipt
A
uthor Man
uscr
ipt
A
uthor Man
uscr
ipt
the Kriegstein group has revealed the molecular identity of a key human progenitor cell type, the outer radial glia cells (oRG) that contribute to the developmental and evolutionary increase in cortical size and complexity of the human brain (Pollen et al., 2015; Thomsen et al., 2016). The developing human cortex has a massively expanded progenitor region not present in the mouse that contains this specific subtype of radial glial cells. By analyzing gene expression across single cells, oRG cells were found to express genes related to extracellular matrix formation, migration, and stemness. These molecular insights have already informed a novel model of primate corticogenesis (Nowakowski et al., 2016b), suggested a relationship between oRG cells and brain tumors (Pollen et al., 2015), and provided insights into the specific cell types affected by genetic forms of lissencephaly (Bershteyn et al., 2017). A map of molecular diversity across cell types in the developing human brain helped identify the mechanism of Zika virus microcephaly. Molecular profiling from the Kriegstein and Sestan groups led to the prediction and subsequent demonstration that Zika virus preferentially infects radial glia, astrocytes, and microglia using AXL as an entry factor and diverting phosphorylated TBK1 from centrosomes to mitochondria (Nowakowski et al., 2016a; Onorati et al., 2016; Retallack et al., 2016); these studies illustrate the utility of a cell genomic map to help understand diseases. We anticipate that an atlas of cell types in the developing human brain will provide a frame of reference to understand cell vulnerabilities at the earliest stages of disease and will serve as the foundation for a full adult brain cell atlas.
Defining Cell Types across Regions, Developmental Periods and Species
Investigators in the BICCC study cell types in a variety of brain regions (cerebral cortex, hypothalamus, retina, etc.), animal species (human, mouse, rat and zebrafish), and ages (adult and developmental). Comparisons both within and across these groups allow us to identify both universal principles common to multiple cell types (as well as functional units and/or neural circuits) and specific cell types implicated in the etiology of neurological or psychiatric diseases. Questions concerning how a cell type develops across the timespan of an organism, how that cell type has changed across its evolutionary history, and whether that cell type is present in different proportions in different brain regions, or whether it has diversified into distinct cell types across regions, may also be addressed. We may also assess the extent to which a given cell type is the product of its developmental context as opposed to a predefined fate specification process, and, to the extent it is genetically determined whether those genetic factors are active in multiple species, brain regions, developmental times, or disease states. Consequently, integration across regions, species and developmental periods could lead to cross-species cell type atlases and ontologies that will inform future normative and disease studies in animal models, human tissue and iPSC studies.
Evolutionary conservation and divergence of cell types in the mammalian CNS
The use of genetically tractable model organisms has enriched our understanding of neural diversity, connectivity and physiology. Crucially, while brain regions and cytoarchitecture are generally conserved across mammalian species, the human brain is thought to have evolved unique changes in cellular identity and neural connectivity (Geschwind and Rakic, 2013; Sousa et al., 2017). Moreover, null mutations in human and mouse orthologous genes
A
uthor Man
uscr
ipt
A
uthor Man
uscr
ipt
A
uthor Man
uscr
ipt
A
uthor Man
uscr
ipt
frequently result in different phenotypes (Barak et al., 2011; Liao and Zhang, 2008). Thus, deciphering both shared and human-specific features of cellular heterogeneity and neural connectivity is of crucial importance to understanding human brain function and the basis of neurologic and psychiatric diseases (Konopka and Geschwind, 2010; Varki et al., 2011). Furthermore, as we advance our knowledge of the similarity and difference amongst species, we will be better positioned to perform relevant and informative experiments in model organisms.
Toward the ultimate goal of understanding cell types in the human brain, we suggest that cross-species comparison of cell types be conducted across at least three mammalian species: mouse, a non-human primate (NHP) species, and human. The mouse is the
genetically most tractable mammalian experimental model and can serve as the evolutionally more distant outgroup. We recommend the NHP be macaque, the most commonly studied NHP in neuroscience, and/or marmoset, an emerging NHP genetic model system (Izpisua Belmonte et al., 2015; Miller et al., 2016). A complete inventory of cell types should include information about the defining features, proportions, and spatial distributions of all cell types, and this information must be provided in the context of a framework, including nomenclature, common across species.
In addition to a common nomenclature, any attempt to conduct a multi-species cell census requires both an informed and integrated study design as well as a commensurate sampling strategy to ameliorate differences in brain size, brain regions, and cell composition. This is especially true for regions believed to have undergone extensive remodeling between species, such as association areas of the primate prefrontal cortex (Konopka et al., 2012), or cell types and subtypes exhibiting varied distributions across brain regions. A cross-species cell type comparison must be conducted within anatomically matched regions and
ontologically matched ages (Silbereis et al., 2016). Cell type development
Study of the origination and developmental trajectory of cell types can contribute significant insights to cell classification and brain development, but is confounded by the fact that, in many cases, the same progenitor cell gives rise to a wide range of neuronal and non-neuronal cell types. Moreover, the potentially multiple transitional stages from a progenitor cell to a terminally differentiated cell suggests that data collection might be necessary at multiple time points and that we must develop the ability to differentiate between these transitional states. The migration many differentiating cells undertake, often over long distances, also introduces numerous migratory cues and extracellular stimuli, all of which can affect the molecular signature of these cells. Similarly, the particular circuits a mature cell resides in and precise connections that cell forms with other cells, may influence gene expression and cellular function. As a consequence, although we have gained a fairly good understanding of the cell fate specification of major cortical cell classes and a number of transcription factors that regulate these processes (Bandler et al., 2017; Leone et al., 2008; Lodato and Arlotta, 2015; Molyneaux et al., 2007; Nord et al., 2015; Shibata et al., 2015), how cells in these major classes complete their terminal mitoses, migrate, and differentiate into the final, adult-stage cell types, to what extent cellular diversity contributes to the
A
uthor Man
uscr
ipt
A
uthor Man
uscr
ipt
A
uthor Man
uscr
ipt
A
uthor Man
uscr
ipt
complex functions of the brain (Klausberger and Somogyi, 2008), and how those functions in turn rely on the evolutionary and developmental differences underlying cellular diversity is not well understood.
To understand this complex developmental process it will be critical to be able to track individual cells in both temporal and spatial dimensions throughout the process. Traditional and more recent CRISPR/Cas9-based genetic fate-mapping approaches as developed by the Schier group (McKenna et al., 2016) are powerful in this regard, and can be combined with single-cell characterization methods such as single-cell RNA-seq to determine the genetic profiles of cells at different transitional stages (Fletcher et al., 2017). Conducting single-cell transcriptomic analysis of cells at later developmental stages first and then profiling increasingly earlier-stage cells may also link the genetic profiles of transitional stages with those of the mature cell types through overlapping genetic signatures. Recently developed algorithms may help to reconstruct the ‘cell type specification tree’ based on such changes in single-cell RNA-seq datasets (Bendall et al., 2014; Fletcher et al., 2017; Qiu et al., 2017; Shin et al., 2015; Trapnell et al., 2010).
Over all, extending cell type studies to different developmental periods and different species will help to understand the genesis and cross-cutting principles governing cell type diversity, to identify central regulators of cell type specificity, and to better delineate anatomical regions and their cross-species homologies. It should be noted that developmental lineages and evolutionary lineages are different with regard to their relationships with cell types, perhaps as a result of the emergence of new regions during species evolution and the new region carrying the entire set of the evolutionary programming of cell types (from one set of progenitors to many diverse cell types) (Arendt et al., 2016). In this sense, the above mentioned cell type specification tree may turn out to be more in alignment with the evolutionary lineage. Cross-species comparison of neocortical development has shown that the developmental process is a temporal programming through which cell type diversity is created, and expanded in more complex brains. It will be important to match hallmark developmental events-based age/timing across different species, to enable meaningful cell type comparison (Silbereis et al., 2016; Workman et al., 2013).
Finally, the importance of establishing a common cell type nomenclature across species cannot be overstated. This should best be done through a community effort. Here we would like to suggest the following considerations. The nomenclature could follow a hierarchical order, starting at the highest level - the species, then the brain region annotated based on a unified anatomical reference atlas system with cross-correlations among species, and then the cell type as defined by a multimodal feature set (including locational, molecular, morphological, physiological and ontological features). All cell types within each region will likely be arranged in a hierarchical manner as well to reflect their relative closeness to each other. Across species, such hierarchical organization of cell types might be similar overall, but species-specific major or minor branches of cell types will also be recognized. The nomenclature should be a culmination of knowledge gained about the cellular organization of the nervous system.
A
uthor Man
uscr
ipt
A
uthor Man
uscr
ipt
A
uthor Man
uscr
ipt
A
uthor Man
uscr
ipt
Looking Toward the Future: the BRAIN Initiative Cell Census Network and
Beyond
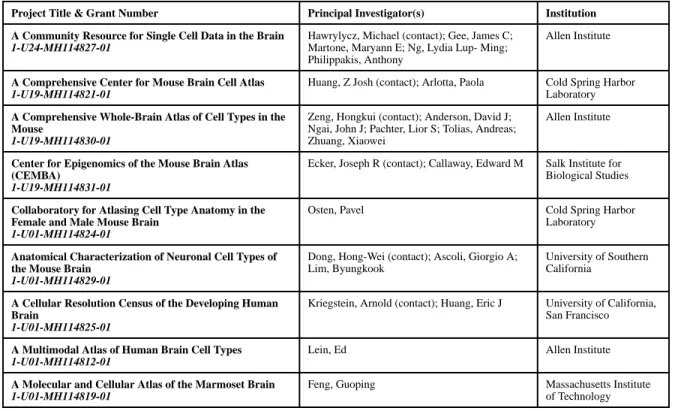
The studies described here represent the collective efforts by the BICCC and other research groups around the world aimed at developing and deploying new methods to characterize the multitude of cell types and their patterns of connectivity in the mammalian brain. The lessons learned thus far will inform how best to meet the specific challenges of handling massive sequencing and anatomical datasets; integrating information from transcriptomics, epigenomics, physiology, morphology and connectivity; harmonizing such information from multiple research groups, analysis platforms and species; and generating and disseminating research tools including genetic reagents and animal models for the research community at large. These pilot projects and other advances in the field set the stage for meeting the long-term goals of scaling up each of the above-described approaches and integrating the ensuing information across multiple modalities in order to generate comprehensive whole-brain cell atlases. Moreover, additional modalities such as massively parallel, multiplexed error-robust fluorescence in situ hybridization (MERFISH) (Chen et al., 2015), in situ transcriptome profiling of single cells (seq-FISH) (Shah et al., 2016), and patch-clamp recordings followed by single-cell RNA-seq of the recorded cells (Patch-seq) (Cadwell et al., 2016; Fuzik et al., 2016) can be incorporated to integrate spatial, anatomical and physiological properties with transcriptomic data from the same cells. Integrative network approaches may prove to be useful in connecting these different levels of analysis in a comprehensive manner (Parikshak et al., 2015). Finally, recent and rapid advances in CRISPR/Cas9-based gene editing (Sternberg and Doudna, 2015) and viral vector technologies (Chan et al., 2017; Dimidschstein et al., 2016) promise to accelerate the development of cell type-specific genetic, optogenetic and chemogenetic tools to allow more precise interrogation of neural circuits through experimental access to the newly discovered cell types. This larger effort – the next phase of the BRAIN Initiative’s cell census program – is embodied by the BRAIN Initiative Cell Census Network (BICCN), a consortium of 8 research projects and the Brain Cell Data Center (BCDC) recently funded by the U.S. National Institutes of Health (Table 3). The BICCN is tasked with generating a comprehensive three-dimensional common reference mouse whole-brain cell atlas that integrates molecular, anatomical, and
physiological annotations of brain cell types, and reference brain cell atlases for adult human and non-human primate species. Continuous and extensive cross-talk between researchers working on the mouse – a more tractable experimental system than humans and non-human primates – and humans and non-human primates will be essential to direct and accelerate the BICCN toward its ultimate goal of generating whole-brain cell atlases that can be used to help understand the basis of human neurologic and neuropsychiatric diseases. Based in large part on the information and expertise acquired by the BICCC pilot projects, the goals of the BICCN are to deliver a deep characterization of the diversity of cell types and the logic of their three-dimensional organization in the brain; an open-access three-dimensional digital reference atlas with molecular, anatomical and physiological annotations of brain cell types in the mouse; a comprehensive neural circuit diagram of the mouse brain; genetic and other reagents for cell-specific targeting; validated high throughput and low cost approaches for characterizing cellular diversity in human and non-human primate brains; and data archives for the capture, storage and curation of data generated through the BICCN that will be
A
uthor Man
uscr
ipt
A
uthor Man
uscr
ipt
A
uthor Man
uscr
ipt
A
uthor Man
uscr
ipt
broadly accessible to the research community. The BICCN aspires to revolutionize the ability to classify brain cell types based on an integrated analysis of their molecular, anatomical and physiological properties, and is further expected to provide a reference for broader efforts embodied by the Human Cell Atlas Project to develop a comprehensive atlas of all cell types in the human body (Regev et al., 2017).
Supplementary Material
Refer to Web version on PubMed Central for supplementary material.
Acknowledgments
We thank all of our BICCC colleagues for stimulating discussions over the course of the project; Andrea Beckel-Mitchener and Michelle Freund for their tireless efforts in organizing and encouraging the consortium’s activities; Cathy Ng and Bishen Singh for facilitating the BICCC’s numerous meetings and conference calls; and Bishen Singh for his assistance in compiling the data shown in Figure S1. We gratefully acknowledge the generous and enabling support of the NIH BRAIN Initiative. A.K. is a founder, shareholder and Board member of Neurona Therapeutics. A.R. is a Scientific Advisory Board member of Syros pharmaceuticals, ThermoFisher Scientific and the Driver Group, and has filed disclosures on intellectual property relating to some of the single cell technologies described in this article.
References
Abrahams BS, Tentler D, Perederiy JV, Oldham MC, Coppola G, Geschwind DH. Genome-wide analyses of human perisylvian cerebral cortical patterning. Proc Natl Acad Sci U S A. 2007; 104:17849–17854. [PubMed: 17978184]
Arendt D, Musser JM, Baker CVH, Bergman A, Cepko C, Erwin DH, Pavlicev M, Schlosser G, Widder S, Laubichler MD, et al. The origin and evolution of cell types. Nat Rev Genet. 2016; 17:744–757. [PubMed: 27818507]
Arlotta P, Molyneaux BJ, Chen J, Inoue J, Kominami R, Macklis JD. Neuronal subtype-specific genes that control corticospinal motor neuron development in vivo. Neuron. 2005; 45:207–221. [PubMed: 15664173]
Bandler RC, Mayer C, Fishell G. Cortical interneuron specification: the juncture of genes, time and geometry. Curr Opin Neurobiol. 2017; 42:17–24. [PubMed: 27889625]
Barak T, Kwan KY, Louvi A, Demirbilek V, Saygi S, Tuysuz B, Choi M, Boyaci H, Doerschner K, Zhu Y, et al. Recessive LAMC3 mutations cause malformations of occipital cortical development. Nat Genet. 2011; 43:590–594. [PubMed: 21572413]
Bardy C, van den Hurk M, Kakaradov B, Erwin JA, Jaeger BN, Hernandez RV, Eames T, Paucar AA, Gorris M, Marchand C, et al. Predicting the functional states of human iPSC-derived neurons with single-cell RNA-seq and electrophysiology. Mol Psychiatry. 2016; 21:1573–1588. [PubMed: 27698428]
Beier KT, Saunders A, Oldenburg IA, Miyamichi K, Akhtar N, Luo L, Whelan SP, Sabatini B, Cepko CL. Anterograde or retrograde transsynaptic labeling of CNS neurons with vesicular stomatitis virus vectors. Proc Natl Acad Sci U S A. 2011; 108:15414–15419. [PubMed: 21825165]
Belgard TG, Marques AC, Oliver PL, Abaan HO, Sirey TM, Hoerder-Suabedissen A, Garcia-Moreno F, Molnar Z, Margulies EH, Ponting CP. A transcriptomic atlas of mouse neocortical layers. Neuron. 2011; 71:605–616. [PubMed: 21867878]
Bendall SC, Davis KL, Amir el AD, Tadmor MD, Simonds EF, Chen TJ, Shenfeld DK, Nolan GP, Pe’er D. Single-cell trajectory detection uncovers progression and regulatory coordination in human B cell development. Cell. 2014; 157:714–725. [PubMed: 24766814]
Bernard A, Lubbers LS, Tanis KQ, Luo R, Podtelezhnikov AA, Finney EM, McWhorter MM, Serikawa K, Lemon T, Morgan R, et al. Transcriptional architecture of the primate neocortex. Neuron. 2012; 73:1083–1099. [PubMed: 22445337]
A
uthor Man
uscr
ipt
A
uthor Man
uscr
ipt
A
uthor Man
uscr
ipt
A
uthor Man
uscr
ipt
Bershteyn M, Nowakowski TJ, Pollen AA, Di Lullo E, Nene A, Wynshaw-Boris A, Kriegstein AR. Human iPSC-Derived Cerebral Organoids Model Cellular Features of Lissencephaly and Reveal Prolonged Mitosis of Outer Radial Glia. Cell Stem Cell. 2017; 20:435–449. e434. [PubMed: 28111201]
Birey F, Andersen J, Makinson CD, Islam S, Wei W, Huber N, Fan HC, Metzler KRC, Panagiotakos G, Thom N, et al. Assembly of functionally integrated human forebrain spheroids. Nature. 2017; 545:54–59. [PubMed: 28445465]
Bota M, Swanson LW. The neuron classification problem. Brain Res Rev. 2007; 56:79–88. [PubMed: 17582506]
Buenrostro JD, Giresi PG, Zaba LC, Chang HY, Greenleaf WJ. Transposition of native chromatin for fast and sensitive epigenomic profiling of open chromatin, DNA-binding proteins and nucleosome position. Nat Methods. 2013; 10:1213–1218. [PubMed: 24097267]
Buenrostro JD, Wu B, Litzenburger UM, Ruff D, Gonzales ML, Snyder MP, Chang HY, Greenleaf WJ. Single-cell chromatin accessibility reveals principles of regulatory variation. Nature. 2015; 523:486–490. [PubMed: 26083756]
Cadwell CR, Palasantza A, Jiang X, Berens P, Deng Q, Yilmaz M, Reimer J, Shen S, Bethge M, Tolias KF, et al. Electrophysiological, transcriptomic and morphologic profiling of single neurons using Patch-seq. Nat Biotechnol. 2016; 34:199–203. [PubMed: 26689543]
Camp JG, Badsha F, Florio M, Kanton S, Gerber T, Wilsch-Brauninger M, Lewitus E, Sykes A, Hevers W, Lancaster M, et al. Human cerebral organoids recapitulate gene expression programs of fetal neocortex development. Proc Natl Acad Sci U S A. 2015; 112:15672–15677. [PubMed: 26644564] Campbell JN, Macosko EZ, Fenselau H, Pers TH, Lyubetskaya A, Tenen D, Goldman M, Verstegen
AM, Resch JM, McCarroll SA, et al. A molecular census of arcuate hypothalamus and median eminence cell types. Nat Neurosci. 2017; 20:484–496. [PubMed: 28166221]
Chan KY, Jang MJ, Yoo BB, Greenbaum A, Ravi N, Wu WL, Sanchez-Guardado L, Lois C,
Mazmanian SK, Deverman BE, et al. Engineered AAVs for efficient noninvasive gene delivery to the central and peripheral nervous systems. Nat Neurosci. 2017; 20:1172–1179. [PubMed: 28671695]
Chen JG, Rasin MR, Kwan KY, Sestan N. Zfp312 is required for subcortical axonal projections and dendritic morphology of deep-layer pyramidal neurons of the cerebral cortex. Proc Natl Acad Sci U S A. 2005; 102:17792–17797. [PubMed: 16314561]
Chen KH, Boettiger AN, Moffitt JR, Wang S, Zhuang X. RNA imaging. Spatially resolved, highly multiplexed RNA profiling in single cells. Science. 2015; 348:aaa6090. [PubMed: 25858977] Chen R, Wu X, Jiang L, Zhang Y. Single-Cell RNA-Seq Reveals Hypothalamic Cell Diversity. Cell
Rep. 2017; 18:3227–3241. [PubMed: 28355573]
Chevée, M., Robertson, J., Cannon, G., Brown, S., Goff, L. Variation in neuronal activity state, axonal projection target, and position principally define the transcriptional identity of individual
neocortical projection neurons. 2017. bioRxiv https://doi.org/10.1101/157149
Ciabatti E, González-Rueda A, Mariotti L, Morgese F, Tripodi M. LifeLong Genetic and Functional Access to Neural Circuits Using Self-Inactivating Rabies Virus. Cell. 2017; 170:382–392. e314. [PubMed: 28689641]
Clark SJ, Lee HJ, Smallwood SA, Kelsey G, Reik W. Single-cell epigenomics: powerful new methods for understanding gene regulation and cell identity. Genome Biol. 2016; 17:72. [PubMed: 27091476]
Close JL, Yao Z, Levi BP, Miller JA, Bakken TE, Menon V, Ting JT, Wall A, Krostag AR, Thomsen ER, et al. Single-Cell Profiling of an In Vitro Model of Human Interneuron Development Reveals Temporal Dynamics of Cell Type Production and Maturation. Neuron. 2017; 93:1035–1048. e1035. [PubMed: 28279351]
Corces MR, Buenrostro JD, Wu B, Greenside PG, Chan SM, Koenig JL, Snyder MP, Pritchard JK, Kundaje A, Greenleaf WJ, et al. Lineage-specific and single-cell chromatin accessibility charts human hematopoiesis and leukemia evolution. Nat Genet. 2016; 48:1193–1203. [PubMed: 27526324]
Crow M, Paul A, Ballouz S, Huang ZJ, Gillis J. Exploiting single-cell expression to characterize co-expression replicability. Genome Biol. 2016; 17:101. [PubMed: 27165153]
A
uthor Man
uscr
ipt
A
uthor Man
uscr
ipt
A
uthor Man
uscr
ipt
A
uthor Man
uscr
ipt
Cusanovich DA, Daza R, Adey A, Pliner HA, Christiansen L, Gunderson KL, Steemers FJ, Trapnell C, Shendure J. Multiplex single cell profiling of chromatin accessibility by combinatorial cellular indexing. Science. 2015; 348:910–914. [PubMed: 25953818]
Darmanis S, Sloan SA, Zhang Y, Enge M, Caneda C, Shuer LM, Hayden Gephart MG, Barres BA, Quake SR. A survey of human brain transcriptome diversity at the single cell level. Proc Natl Acad Sci U S A. 2015; 112:7285–7290. [PubMed: 26060301]
DeFelipe J, Lopez-Cruz PL, Benavides-Piccione R, Bielza C, Larranaga P, Anderson S, Burkhalter A, Cauli B, Fairen A, Feldmeyer D, et al. New insights into the classification and nomenclature of cortical GABAergic interneurons. Nat Rev Neurosci. 2013; 14:202–216. [PubMed: 23385869] Dickel DE, Barozzi I, Zhu Y, Fukuda-Yuzawa Y, Osterwalder M, Mannion BJ, May D, Spurrell CH,
Plajzer-Frick I, Pickle CS, et al. Genome-wide compendium and functional assessment of in vivo heart enhancers. Nat Commun. 2016; 7:12923. [PubMed: 27703156]
Dimidschstein J, Chen Q, Tremblay R, Rogers SL, Saldi GA, Guo L, Xu Q, Liu R, Lu C, Chu J, et al. A viral strategy for targeting and manipulating interneurons across vertebrate species. Nat Neurosci. 2016; 19:1743–1749. [PubMed: 27798629]
Dodt HU, Leischner U, Schierloh A, Jahrling N, Mauch CP, Deininger K, Deussing JM, Eder M, Zieglgansberger W, Becker K. Ultramicroscopy: three-dimensional visualization of neuronal networks in the whole mouse brain. Nat Methods. 2007; 4:331–336. [PubMed: 17384643] Doyle JP, Dougherty JD, Heiman M, Schmidt EF, Stevens TR, Ma G, Bupp S, Shrestha P, Shah RD,
Doughty ML, et al. Application of a translational profiling approach for the comparative analysis of CNS cell types. Cell. 2008; 135:749–762. [PubMed: 19013282]
Druckmann S, Hill S, Schurmann F, Markram H, Segev I. A hierarchical structure of cortical interneuron electrical diversity revealed by automated statistical analysis. Cereb Cortex. 2013; 23:2994–3006. [PubMed: 22989582]
Dulken BW, Leeman DS, Boutet SC, Hebestreit K, Brunet A. Single-Cell Transcriptomic Analysis Defines Heterogeneity and Transcriptional Dynamics in the Adult Neural Stem Cell Lineage. Cell Rep. 2017; 18:777–790. [PubMed: 28099854]
Economo MN, Clack NG, Lavis LD, Gerfen CR, Svoboda K, Myers EW, Chandrashekar J. A platform for brain-wide imaging and reconstruction of individual neurons. Elife. 2016; 5:e10566. [PubMed: 26796534]
Fahrbach FO, Gurchenkov V, Alessandri K, Nassoy P, Rohrbach A. Self-reconstructing sectioned Bessel beams offer submicron optical sectioning for large fields of view in light-sheet microscopy. Opt Express. 2013; 21:11425–11440. [PubMed: 23669999]
Fertuzinhos S, Li M, Kawasawa YI, Ivic V, Franjic D, Singh D, Crair M, Sestan N. Laminar and Temporal Expression Dynamics of Coding and Noncoding RNAs in the Mouse Neocortex. Cell Rep. 2014; 6:938–950. [PubMed: 24561256]
Fletcher RB, Das D, Gadye L, Street KN, Baudhuin A, Wagner A, Cole MB, Flores Q, Choi YG, Yosef N, et al. Deconstructing Olfactory Stem Cell Trajectories at Single-Cell Resolution. Cell Stem Cell. 2017; 20:817–830. e818. [PubMed: 28506465]
Frazer S, Prados J, Niquille M, Cadilhac C, Markopoulos F, Gomez L, Tomasello U, Telley L, Holtmaat A, Jabaudon D, et al. Transcriptomic and anatomic parcellation of 5-HT3AR expressing cortical interneuron subtypes revealed by single-cell RNA sequencing. Nat Commun. 2017; 8:14219. [PubMed: 28134272]
Fuzik J, Zeisel A, Mate Z, Calvigioni D, Yanagawa Y, Szabo G, Linnarsson S, Harkany T. Integration of electrophysiological recordings with single-cell RNA-seq data identifies neuronal subtypes. Nat Biotechnol. 2016; 34:175–183. [PubMed: 26689544]
Geschwind DH, Rakic P. Cortical evolution: judge the brain by its cover. Neuron. 2013; 80:633–647. [PubMed: 24183016]
Gokce O, Stanley GM, Treutlein B, Neff NF, Camp JG, Malenka RC, Rothwell PE, Fuccillo MV, Sudhof TC, Quake SR. Cellular Taxonomy of the Mouse Striatum as Revealed by Single-Cell RNA-Seq. Cell Rep. 2016; 16:1126–1137. [PubMed: 27425622]
Golgi C. Sulla struttura della sostanza grigia del cervello. Gazz Med Ital (Lombardia). 1873; 33:244– 246.