HAL Id: hal-03118601
https://hal.archives-ouvertes.fr/hal-03118601
Submitted on 22 Jan 2021
HAL is a multi-disciplinary open access
archive for the deposit and dissemination of
sci-entific research documents, whether they are
pub-lished or not. The documents may come from
teaching and research institutions in France or
abroad, or from public or private research centers.
L’archive ouverte pluridisciplinaire HAL, est
destinée au dépôt et à la diffusion de documents
scientifiques de niveau recherche, publiés ou non,
émanant des établissements d’enseignement et de
recherche français ou étrangers, des laboratoires
publics ou privés.
Geomagnetic field intensity at Hawaii for the last 420
kyr from the Hawaii Scientific Drilling Project core, Big
Island, Hawaii
Carlo Laj, Catherine Kissel
To cite this version:
Carlo Laj, Catherine Kissel. Geomagnetic field intensity at Hawaii for the last 420 kyr from the
Hawaii Scientific Drilling Project core, Big Island, Hawaii. Journal of Geophysical Research : Solid
Earth, American Geophysical Union, 1999, 104 (B7), pp.15317-15338. �10.1029/1999JB900113�.
�hal-03118601�
JOURNAL OF GEOPHYSICAL RESEARCH, VOL. 104, NO. B7, PAGES 15,317-15,338, JULY 10, 1999
Geomagnetic field intensity at Hawaii for the last 420 kyr
from the Hawaii Scientific Drilling Project core, Big
Island, Hawaii
Carlo Laj and Catherine Kissel
Laboratoire des Sciences du Climat et de l'Environnement, CEA-CNRS, Gif-sur-Yvette, France.
Abstract. Four hundred
twenty five new paleointensity
(Thellier-Thellier) determinations
(out of
545 analyzed
samples)
have been obtained
from core HSDP, which penetrates
about 1000 meters
(208 flows) of the Mauna Loa and Mauna Kea volcanic series encompassing
the last 420 kyr. Rock
magnetic
investigations
identify pseudo-single-domain
magnetite
as the main magnetic
mineral.
Inclinations
are shallower
than expected
from a geocentric
dipole field but are consistent
with data
from other geographical
regions
at the same latitude. The inclination
record reveals
three episodes
of negative
inclination
whose
interpolated
age correlates
well with that of known geomagnetic
events.
The paleointensity
record
from the Mauna Loa sequence
is not very detailed
and does
not
allow precise
comparison
with other data in the 0-50 kyr interval. The record from the Mauna Kea
sequence,
on the contrary,
is very detailed
and documents
relatively short-lived
episodes
of low and
high
field strength
from 15 to 60 gT. The average
virtual
dipole
moment
(8.7 + 3.0 10
22
A.m
2) is
not significantly
different from the value reported
by Kono and Tanaka [ 1995] for the last 2.5 Myr.
A comparison
with other data from Hawaii and other geographical
regions
is described
in detail.
There are no drastic
changes
in paleointensity
with the inclination anomaly,
in agreement
with
previous
results
from Hawaii but in contrast
with most published
results
which, however, consider
data from polarity transition.
Spectral
analysis
of a particularly
detailed
portion of the record,
between
420 and 326 kyr, documents
significant
periodicities
at 36, 8, 5, and 4 ka in the
inclination
record but not in the intensity
record, suggesting
that changes
in time of the inclination
are to a certain extent independent
from those of the intensity.
1. Introduction
The 1 km core obtained near Hilo (latitude 19ø45'N; longitude -155ø05 ') by the Hawaii Scientific Drilling Project 0tSDP) [Hawaii Scientific Drilling Project, 1994] penetrates 227 units of the Mauna Loa (43) and Mauna Kea (184) sequences. The main objective of HSDP is to drill continuously through a sequence of lava on the flank of the Mauna Kea volcano to obtain a stratigraphic sequence representing the complete traverse of the Hawaiian hotspot [Stolper et al., 1996]. In addition, this core provides a unique opportunity to obtain a detailed record of geomagnetic field changes during the last 400 kyr from a continuous sequence of lava flows from
the central Pacific.
Although the HSDP core is not azimuthally oriented, the
records of the inclination and of the paleointensity may adress several important issues relative to geomagnetic field
behavior. The inclination record, for instance, has revealed
two brief inclination reversals, which were tentatively
correlated to the Blake and Jamaica events, and an anomalous
inclination which was associated with the Laschamp event, all of which represent the first records of these events from the central Pacific, providing evidence for their worldwide character [Holt et al., 1996]. In addition, long term variations
Copyright 1999 by the American Geophysical Union. Paper number 1999JB900113.
0148-0227/99/1999JB900113509.00
of the geomagnetic field are recorded in the inclination record,
and the short-term characteristics appear to be superimposed upon these long-term trends.
Paleointensity determinations, which are among the most time consuming of all the paleomagnetic measurements, have not progressed as fast as the inclination measurements, and only a preliminary paper has been published so far [Garnier et al., 1996]. With respect to sedimentary records, volcanic records of paleointensity have the great advantage that the processes by which the magnetization of a lava was acquired are relatively well understood and can be reliably reproduced in the laboratory. It is therefore possible to obtain
determinations of the absolute field intensity by comparison with a known field in the laboratory, whereas the complicated
nature of sedimentary magnetization only allows relative changes of the field intensity to be retrieved from sediments.
Moreover, volcanic records do not suffer from possible environmental factors and from the time-averaging effect
inherent to sedimentary acquisition of remanence. Therefore, despite their discontinuous nature, volcanic records may allow a better quantitative appraisal of geomagnetic field changes in
the past than many sedimentary records do.
In this paper we report on 545 paleointensity measurements made on samples from core HSDP. The unusually high percentage (-75%) of sucessful determinations makes the HSDP record the longest continuous volcanic record of geomagnetic field intensity yet reported and allows some
general
conclusions
about
.geomagnetic
field behavior to be
made.15,318 LAJ AND KISSEL: GEOMAGNETIC PALEOINTENSITIES FROM CORE HSDP
The 4øAr/39Af
and
K/Ar datings
from
different
horizons
in
the core [Sharp et al., 1996] and one radiocarbon date of humic ashy soil [Beeson et al., 1996] provide the necessary time constraints for the interpretation of this record in terms of geomagnetic field behavior.
2. Core Description and Sampling
The core logging [Stolper et al., 1996] identified 227 units (numbered in stratigraphic succession from the top to the
bottom of the core), out of which 208 are lava flows. The other units consist of ash beds, marine and beach sediments, and
soils [Stolper et al., 1996]. The upper 43 units (27 of which
are lava flows) belong to the Mauna Loa volcano, and the
lower 183 lava flows (flow numbers 44 to 227) belong to the Mauna Kea volcano. Mauna Loa lavas erupted on gentle slopes, while Mauna Kea lavas erupted on steeper slopes (3 ø to 6 ø) [DePaolo and Stolper, 1996]. As a result, Mauna Loa flows
are thicker than those from deeper levels. The contact between these two series, at a depth of 279.5 m, is sharp and unambiguously identified by changes in trace elements ratios [Hofrnann and Jochurn, 1996; Rhodes, 1996] and He, O, Sr, Pb, and Nd isotopic ratios [Eiler et al., 1996, Hauri et al., 1996; Lassiter et al., 1996].
No intrusive unit has been identified, and nearly all the lavas are subaerial [Stolper et al., 1996]. The presence of subaerial lavas at 1 km depth is consistent with the subsidence rate of 2.0-2.5 mm/yr at Hawaii [ Moore, 1987; Moore et al., 1996] and the age of the bottom of the core (-420 kyr, see section 4). The choice of the drill site, where the effect of hydrothermal solutions was predicted to be minimal, has resulted in the recovery of remarkably fresh lavas. (Core description is available on the HSDP World Wide Web site http://expet.gps.caltech.edu/Hawaii_project.html)
For the paleointensity study, usually three (but in a few cases two or even one) samples were drilled in 190 flows (22 from Mauna Loa, 168 from Mauna Kea) within the working half of the HSDP core using a diamond-tipped, water-cooled coring bit in the core repository at the California Institute of Technology (Caltech). A vertical orientation line was drawn on the flat side of the core split parallel to the side of the core, and samples were then drilled centered on this line and perpendicular to the core axis. Care was taken to distribute the samples over the entire thickness of the flows. In general, the azimuths of the subsamples have no meaning due to the azimuthally unoriented nature of the core, but when continuous sections of the core were encountered, samples were drilled with the same azimuth. A total of 545 samples were obtained for paleointensity determinations. Samples were labeled by the number of the flow, followed by a letter identifying the different samples in the flow. Orientation marks were drawn on each sample, before being trimmed into one to three 12 mm subsamples, i.e., half the size of a standard paleomagnetic sample. End chips were used for rock magnetic analyses.
At the time of the sampling, we were not aware that a section of the core, spanning parts of flow units 199 and 200, had been inverted during core retrieval. This caused some changes in sample identification. As a consequence, we have no samples in flow unit 199, and we have six samples in flow
unit 200.
During drilling of the core, flow unit 64 was recovered in
three separate sections. The samples used in this study and those used in the study of Holt et al. [1996] come from two
different sections. For reasons discussed below, the
possibility that one section has been inverted has recently been rechecked by J. W. Holt et al. (personal communication, 1998). Unfortunately, there is nothing to indicate whether the 3-foot section from which our samples come has been inverted
or not. The section could be inverted and the lithological variation would match just as well as they do in its present
position. There is no evidence either that the section of the core used for the Thellier experiments is part of a separate flow. There are crumbly sections of altered rock both above
and below the fresh unaltered rock where the samples are from,
but there is nothing that looks like a flow boundary (J. W. Holt et al., personal communication, 1998).
3. Methods of Measurements
High field thermomagnetic analyses were made on small amounts of powder using a horizontal Curie balance in an argon atmosphere to minimize oxidation of the magnetic minerals during the experiments. Heating and cooling rates
were close to 7-8øC/min, and the maximum temperature reached
was 680øC in fields of the order of 0.4-0.9T. The S ratio,
defined as S=IRM(-0.3T)/IRM(1T) [King and Channell, 1991], was determined on small chips of rock using an alternating gradient force magnetometer (AGFM).
Remanence measurements were done with a 2G cryogenic
magnetometer in the shielded room of the Laboratoire des
Sciences du Climat et de l'Environnement (LSCE). The original
paleointensity method of Thellier and Thellier [1959] was employed throughout. The samples were heated twice (direct
and reverse fields) from room temperature to usually over
500øC with at least 11 steps of amplitude from 10øC to 50øC depending on the samples and the temperature range. The
paleointensity furnace at the LSCE has a large internal diameter allowing the simultaneous treatment of over 100 half samples. Heating of the samples lasted -4 hours, and the samples were allowed to cool naturally overnight. At the beginning of each heating, air was evacuated from the furnace with a primary pump. Then argon was alternatively flushed in and pumped out -7-8 times, up to -100-110øC. A gentle stream of Ar was then maintained during the entire experiment. In addition, following a suggestion by P. Johnson, a few grams
of activated charcoal were introduced in the furnace. The charcoal acts as a buffer to avoid oxidation/reduction of
magnetite. Under these conditions the groundmass of the samples shows insignificant changes in color up to the highest temperatures.
A field of 40 gT, close to the present field intensity in Hawaii, was applied along the z axis of the samples during both heating and cooling, as suggested by Levi [1975]. We checked for thermochemical alteration of the samples by redetermining the partial thermal remanent magnetization (PTRM) at a given low-temperature interval after previous heating at higher temperature. The automatic temperature control of the furnace allows any given temperature to be reproduced within 1-2øC. The PTRM checks could therefore be made very accurately, at least every two temperature steps and usually at every step for the highest temperatures.
LAJ AND KISSF•: GEOMAGNETIC PALF. DINTENSI'rlES FROM CORE HSDP 15,319
4. Temporal Framework
The different age determinations which have been used here to reconstruct the changes of the geomagnetic field intensity
are summarized in Table 1. A radiocarbon date of-40 ka has
been obtained on a humic ashy soil at a depth of 182 m [Beeson et al., 1996]. Ar/Ar and K/Ar radiometric dating have been difficult in most cases because of the low yields of
radiogenic
4øAr* (1 x 10 '•5 mol) at each temperature
step,
masked by 20 to 50 times more atmospheric argon, and because of the very low K contents due to the tholeitic composition of the basalts. Nevertheless, nine age determinations have been obtained. Seven Ar/Ar dates ranging from (132+32) to (391+40) kyr were obtained for lava flows distributed down the total length of the core. Two intermediate K/At ages of (352+105) and of (378+109) kyr were also obtained for flow 147 (720 m) and flow 164 (798 m), respectively. The description of these results is given elsewhere [Sharp et al., 1996].We have used this time frame for the interpretation of the results. Following Holt et al. [1996], age interpolation was
performed as three separate linear fits (0-182 m, 182-418 m,
and 418-940
m) using
the nøAr/39Ar
dates,
the radiocarbon
date
at 182 m and the constraint that the top of the core is approximately of zero age. The extrusion rate for the 940- 1053 m section was taken equal to that calculated for the 418- 940 m section. Within this approximation the extrusion rate was one flow per 610 years in the 420-326 kyr interval, one flow per 5.6 kyr between 326 and 39 kyr, and one flow per 1.6 kyr during the last 39 kyr. As stressed by Holt et al. [1996], age interpolation is intended to provide a first-order approximation of geomagnetic changes as a function of age downcore. However, rates of extrusion could be highly variable on short timescales.5. Results
5.1. Rock Magnetic Characteristics
The rock magnetic characteristics of the HSDP core flows have already been partially adressed by Garnier et al. [1996]. High field thermomagnetic analyses document a variety of sample behaviors. At one extreme are perfectly reversible, concave-down curves continuously decreasing to zero with
Table 1. Radiometric Datings of Samples From Different
Horizons of the HSDP core
Method Unit DelLt13_,_m A•g_e,_k_y_r ...
Mauna Loa •4C 24 182 38.6 + 0.9 Ar/Ar 43 266 132 + 32 Mauna Kea Ar/Ar 49 300 199 _+ 9 Ar/Ar 57 325 232 + 4 Ar/Ar 58 334 241 + 5 Ar/Ar 75 418 326 + 23 K/Ar 147 720 352 + 105 K/Ar 164 798 378 + 109 Ar/Ar 196 940 400 + 26 Ar/Ar 211 995 391 _+ 40
From Beeson et al. [1993] and Sharp et al. [1996]. Linear extrusion rates have been calculated between the top of the core and unit 24, between units 24 and 75, and between unit 75 and 196.
Curie temperature close to 580øC. At the other extreme are curves characterized by a regular decrease of the induced magnetization up to -350øC, then a second decrease with Tc = 550øC and nonreversible behavior. Figure 1 gives representative examples of the thermomagnetic analyses. There is a continuous range of spectra between the two extreme
cases described above. However, curves such as those
illustrated in Figures l a, lb, and l c represent the behavior observed in 85% of the cases, while the case in Figure ld is only observed in 15% of the cases.
Magnetic hysteresis analyses document low values of Hc and Hcr and an S ratio higher than 0.9 along the entire length of the core. Combined with the thermomagnetic analyses, this identifies magnetite with variable amounts of Ti as the main magnetic mineral in a large majority of the samples.
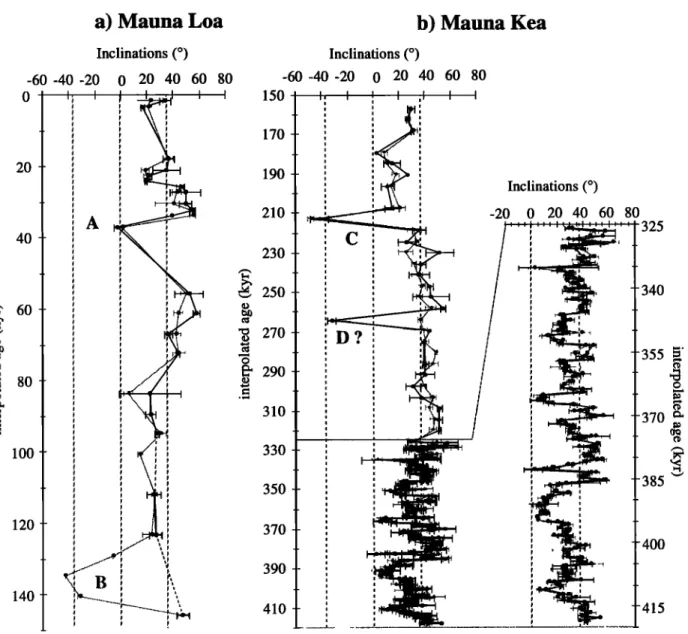
5.2. Inclination Record
As mentioned in section 1, a record of the inclination
obtained using alternating field demagnetization on several samples per flow has already been published [Holt et al., 1996]. The thermally cleaned determinations of the inclination reported here were obtained from Thellier experiments, using the half vectorial sum of the magnetization vectors measured after heating in normal and reverse fields at each step of the thermal treatment. Because inclination values depend only on the demagnetization of the natural remanent magnetization (NRM), the inclination record obtained here is more detailed than the paleointensity record.
Examples of demagnetization diagrams obtained from these experiments are shown in Figure 2. Apart from an occasional small viscous component of magnetization easily removed at low temperatures, the demagnetization diagrams are highly linear. Inclinations for individual samples were determined by principal component, least squares analysis [Kirschvink, 1980]. In general, we obtained three determinations per flow (for a total of 524 reliable inclination determinations), with good within-flow consistency (>70% of the flows have a +1o uncertainties of <5ø). The record of the
flow inclination means and their +1o uncertainties obtained
from the Thellier experiments is given in Figure 3 as a function of depth and interpolated age.
For the Mauna Loa sequence (Figure 4a) the inclination record obtained with thermal demagnetization is quite consistent with the inclination results of Holt et al. [1996] obtained with alternating field (af) cleaning. Both records document an episode of nearly zero inclination (feature A of Holt et al. [1996]) which has occurred at about 35-40 ka and has been tentatively associated with the Laschamp event [Holt et a/.,1996]. Another episode (feature B) is documented by Holt et al. [1996] by three flows showing negative inclinations around 130 kyr (-260 m). Unfortunately, no sample corresponding to these flows (number 39.5, 40, and 42; unit 41 is not a flow) was available for the paleointensity
study, so no comparison could be made in this case.
For the Mauna Kea sequence (Figure 4b), the af and thermally cleaned records of the inclination are also very
similar. The thermal record, however, in addition to the reverse
inclination episode at 320 m (feature C), documents one additional episode of reverse inclination for flow 64 (Feature D, see Figure 4b). As discussed in section 2, careful rechecking
has not revealed evidence for an inversion (or its contrary) of
15,320 LAJ AND KISSEL: GEOMAGNETIC PALEOINTENS1TIES FROM CORE HSDP 1.2 1 0.8 0.6 0.4 0.2 0 J/Jo a) HSDP unit 112 0 100 200 300 400 500 600 700
J/Jo
T (øC)
1 0.8 0.6 0.4 0.2 0 0 J/Jo1.2
b) HSDP
unit
163
100 200 300 400 500 600 700 T (øC)1.2
1.2
J/Jø
1
SDP
unit
167
I •%•.
d)
HSDP
unit
104
0.8
0.8 •••,•
0.6 0.4 0.40
0 0 160 2(•0 360 460 500 600 700
0 100 200 300 400 500 600 700
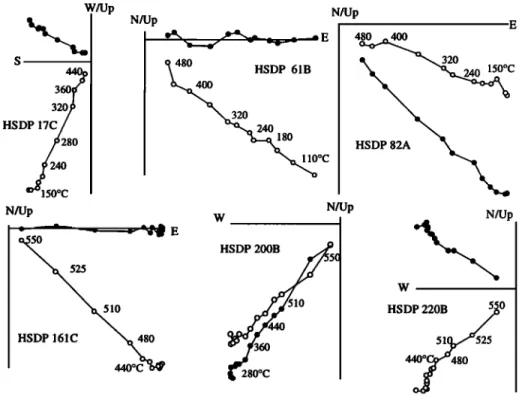
T (øC) T (øC)Figure 1. Representative
thermomagnetic
analyses
plots obtained
in an argon atmosphere.
(a), (b),
and (c) Typical behavior for low Ti-content magnetite obtained for --85% of the samples. (d) Nonreversible behavior observed for --15% of the samples, illustrating high-Ti content.
W/Up 360 3
HSDP
17C/_
_
N/Up
N/Up
E48•30
HSDP
6lB
20
..oc
N/Up •0HSDP
161C
440oc bqr w N/UpHSDP
20
C
440 360 480 ,. 400•••,•
320 o
HSDP
82A
•
N/Up wHSDP
220B
•/•0
51y525
440•480
Figure 2.
Typical demagnetization
diagrams obtained using the half vectorial sum of the
magnetization
vectors
measured
after each
double
heating.
Open and solid circles
are projection
onto the
vertical and the horizontal
planes,
respectively.
The core is not oriented
in the horizontal plane so that
the straight line passing
through
the solid dots has no directional
meaning.
Temperatures
in øC are
LAJ AND KISSEL: GEOMAGNETIC PALEOINTENS1TIES FROM CORE HSDP 15,321 100 200 3OO 400 500 600 700 800 900 1000 -60 -40
Inclinations (ø)
-20 0 20 40 60 ,,:
,._- •n•; ' : ,, ', ,. IInclinations (ø)
80 80 38.6+0.932+32
241+5I
400+26I
-60 -40 I, - t - t - t _ I - t - t - t - t - t - t ' I _ -- t - I _ I _ • -20 0 20 40 60 : . ! .a
! ! ! ! ! ! ! ! D? ! i i i iLascham.
E
50 - 100 - Blake 150 200 - .J•t.m. aica- - Pringle Falls - - 250300 Biwa
350 400 •Figure 3. Inclination record obtained from HSDP core as a function of (left) depth and (right)
interpolated ages. Radiometric datings are reported between the two diagrams and the ones in bold characters were used to calculate the interpolated timescale. An attempt has been made to correlate the inclination record to the geomagnetic timescale [Champion et al., 1988; Opdyke and Channell, 1996]. Events A, B, and C are the same as those reported by Holt et al. [ 1996]. Event D is discussed in the text.
50 100 150 200 250 300 35O 400
that used for the af inclination study. Therefore this inconsistency between the af and thermally cleaned records i s
not clearly understoood. The observation that feature D is
associated with a rather low paleointensity, also recorded by the overlying two flows, could corroborate the hypothesis of a real geomagnetic event. The interpolated age of feature D is
265 ka. The geomagnetic
event which appears
the closest in
time to feature D is the Biwa II event, the age of which is 295 ka [Champion et al., 1988]. Identification of feature D with
this event would imply that either the section of the core used by Holt et al. [1996] was inverted or that the two sections
belong to two separate flows.
As already described by Holt et al. [1996], the inclination record shows large, mostly continuous inclination swings ranging from ~0 to 65 ø. Short shifts of inclination away from these trends to shallow values are also present in the record.
Some of these shifts are followed by a continuation of the same trend of inclination as before the departure. This has led
Holt et al. [1996] to suggest that these short-term events may
not necessarily be related to the long-term variations. 5.3. Paleointensity Record
Representative examples of the paleointensity results are
reported in Figure 5 as NRM/thermoremanent magnetization
(TRM) (Arai) diagrams [Nagata et al., 1963]. In these diagrams
the residual natural remanent magnetization (NRM) is plotted
versus the associated acquired thermoremanent magnetization
(TRM). Both NRM and TRM values are normalized to the value
of the NRM at room temperature. In an ideal diagram all the NRM/TRM points fall on a straight line, the slope of which gives the ratio between the applied laboratory field and the Earth's paleofield.
15,322
LAJ AND KISSEL:
GEOMAGNETIC
PALEOINTENSmES
FROM CORE HSDP
a) Mauna Loa
b) Mauna Kea
20 -60 -40 -20 0 I• I A 40 60 80 100 120 140 Inclinations (o) 0 20 40
t •...!
:•1
! V 60 80 I -60 -40 -20 150 ',, 170 190 210 c 230 D? 270 29O 310 330 350 370 390 410 Inclinations (ø) 0 20 40 60 80 t ,,
/
i i -20 Inclinations (ø) 0 20 40 60 80Figure 4. Comparison between the inclination data obtained using thermal treatment (solid dots, this study) and AF demagnetization (shaded dots, Holt et al. [ 1996]) for (a) the Mauna Loa sequence and (b) the Mauna Kea sequence. The bottom part of the Mauna Kea sequence has been enlarged.
325 340 ¸ 370 a. 385 400 415
As shown in Figure 5a, some of the diagrams from HSDP core are virtually ideal: a single straight line can be fitted precisely through the experimental points until almost complete removal of the initial NRM. These exceptionally accurate diagrams represent -40% of the total. Although not
quite as exceptional, many other diagrams meet published
selection criteria and can reliably be interpreted in terms of geomagnetic field intensity, in spite of evidence of alteration during the laboratory heatings (Figure 5b).
The selection criteria used here are slightly more stringent
than those commonly used in the literature. First, slopes defined by less than four points and corresponding to the
removal of <20% of the total NRM (/'<0.2) were not used for
paleointensity estimates (only three samples were accepted
below this limit, while 92% of the accepted results have f>0.3,
75% of them f>0.4 and 52% f>0.5). The diagrams were
considered reliable up to the temperature at which magnetochemical transformations begin to occur, as
illustrated by nonlinearity in the NRM/TRM curve and negative FIRM checks. PTRM checks were considered negative when the new FIRM value at a given temperature differed from the previous one by >5% of the initial NRM. Only diagrams comprising at least three sucessful PTRM checks were considered reliable. No attempt was made to correct for negative FIRM checks using the correction recently proposed by Valet et al. [1996].
We checked
carefully
that
the samples
yielding
linear
Arai
diagrams were also characterized by high directional stability (i.e., linear demagnetization plots tending to the origin), with no tendency for the magnetization to align along the laboratory field. This was easily done because the laboratory field was applied along the z axis of the samples (1=0) which was different from the direction of the magnetization for the overwhelming majority of the samples. Only for 13 samples did the magnetization move toward the laboratory field. Slope determinations were made using a least squares fitting of aLAJ AND KISSEL: GEOMAGNETIC PALEOINTENSITIES FROM CORE HSDP 15,323
0.5
0A
HSDP- 30BHpale
o = 14.7
_+
0.4
•tT
110180
f= 0.75
440 • ' I TRM/NRMo 0 0.5 1360
HSDP
- 202B
I •k4_00
Hpale
o = 23.7
+__
0.2
•tT
i
f=
0.91
I •. 550 560 !'•300
HSDP-
158B
I IN'•350
Hpaleø
= 39.9
+__
0.5
•tT
1 _
I I • f- 0.69 400I
o
.5
• •-
••
480
• 0.5
•
Z 5 I 0 0.5 TR•RMo 1 i 0 0.5 1 TRM/NRMo HSDP- 206BHpale
o = 34.0
+ 0.4 •tT
f = 0.94 ,_ 390<
•
• 535
' I 0 0.5 1 TRM/NRMoB
k
HSDP
- 01C
I •85
Hpale
O =31.0
+1.5
•tT
-•'• •
00
f = 0.52
• x-,,•120
.5
-
•._.•180
i0
(•.5
1 TRM/NRMo
HSDP - 109C•._•
8o
Hpale
o = 34 _+
0.6
0
f =
0.54
x
470
•520 o
540
•.5
I
1 TR•RMo HSDP- 70CHpale
o = 29.3
+ 0.9
•tT
f = 0.771
•120
o I • 180 Z 0 ' I 0 0.5 1 TRM/NRMo 1 -i o o lOO••oo
HSDP
- 169B
•300
Hpale
o = 61.4
+ 1.8
•tT
I
o
510
o 535 !0.5
1
• TRM/NRMo
Figure 5. Representative NRM/TRM diagrams showing paleointensity estimates for HSDP core. Circles are NRM/TRM points calculated for each double heating at the temperature indicated close to the points. PTRM checks are reported with triangles. Solid (open) symbols correspond to the part of the diagram used (rejected) for the estimation of the paleointensity. (a) "Ideal" diagrams obtained for -40% of the HSDP samples. (b) Other reliable diagrams obtained for -38% of the samples.
15,324
LAJ AND KISSEL:
GEOMAGNETIC
PALEOINTENSITlF_3
FROM CORE
HSDP
straight line in the selected temperature interval. As a finalrejection criterion, fits for which the correlation coefficient was <0.970 were considered unprecise and rejected.
Because a careful check has shown that some of the
preliminary measurements reported by Garnier et al. [1996]
may not be entirely reliable, we have systematically measured the half twin samples that had all been left untouched from this
previous study. For 14 of the 105 samples we found
significantly different results. In general, these samples correspond to the high paleointensities present in the Garnier et al. [ 1996] record, some of which are therefore not confirmed here. In addition, 21 samples which had been accepted in the preliminary study do not meet the stricter selection criteria used here. Finally, for the other 70 samples the paleointensity estimates obtained in the preliminary study are not significantly different from those obtained here. However, the associated precision parameters are almost systematically improved. This may be an effect of introducing the activated charcoal in the furnace, a technique that had not been used by Garnier et al. [1996]. For these reasons we do not use here any of the preliminary results, which should be considered entirely superseded by the ones reported here.
Table 2 reports all the succesful paleointensity determinations with their associated precision parameters [Coe et al., 1978]. The NRM fraction (f) is the percentage of the NRM taken into account for the determination; the gap factor (g) is a measure of how the NRMITRM points are distributed along the straight-line segment, the more irregular the spacing between the selected points of the segment, the more (g) will decrease from unity. Finally, the factor q is a combination of
these parameters (q=bfg/s(b)), where b is the slope of the straight line and s(b) its standard error. Altogether, out of the 545 analyzed samples, we have obtained 425 reliable
determinations from 174 flows. One flow is characterized by six determinations, 96 flows are characterized by three determinations, 54 are characterized flows by two determinations, and 23 flows are characterized by one determination. Only 16 flows did not yield any reliable estimate of the paleointensity.
The paleointensity record is shown in Figure 6, separately for the Mauna Loa (Figure 6a) and the Mauna Kea (Figure 6b) sequences, together with the associated inclination records. In a general way, the Mauna Loa sequence yielded somewhat disappointing results, both because some flows could not be sampled for the paleointensity study and because not all the
samples yielded reliable results. Although not really detailed,
the record does, however, document that the field strength was
quite reduced in the period between 80 and 40 kyr and one determination indicates a very low paleointensity around 125
kyr. In the most recent period, between 30 and 20 kyr the field
appears to have been close to its present value of about 40 gT.
There is then a huge gap so that nothing can be inferred for the 20 ka to present time interval.
The Mauna Kea sequence (Figure 6b) yields a much more detailed paleointensity record. In the upper period (326-132 kyr) the resolution is limited by the extrusion rate, but the record is sufficiently detailed to document that the geomagnetic field strength has undergone large oscillations with values from 15 to 60 gT, over periods of 20-30 kyr. The lower part of the sequence, characterized by a much higher resolution, also documents a high variability of the field which has oscillated between 20 and 60 gT. There is a period of very low intensity at the very bottom of the core (395-420
kyr) and some highs at 380 and 357-370 kyr. The intensity was on the average close to its present value in the interval 357-345 kyr and slightly lower around 330-326 kyr.
6. Discussion
6.1. Time Constraints
When dealing with volcanic records of geomagnetic field
changes,
it is difficult to correctly evaluate the temporal
characteristics of the sequence of the lava flows. The sporadic nature of volcanic extrusion may result in bursts of flows that
repeatedly
sample
the same geomagnetic
field vector. If the
results were analyzed as independent readings of the field, an incorrect description of the field characteristics would then be
obtained. For this reason, methods have been developed for
estimating whether significant serial correlation exists
between successive flows [Mankinen et al., 1985; McElhinny et al, 1996; Vandamme and Bruneton, 1998].
For HSDP core, where only the intensity and inclination,
but not the declination, are recovered, these methods cannot be
used. Fortunately, however, some features of the record provide evidence that the flows were emplaced with some regularity. First, we notice that if linear approximation between dated flows is used, then the Laschamp and Jamaica events have an interpolated age quite consistent with the ages for these events
reported
in the literature.
The Blake event has an interpolated
age of 135 kyr, which is at the upper limit but within the
uncertainties
of the ages reported
for this event, between
105
and 138 ka [Worm, 1997]. The only large discrepancy would concern the identification of the reverse polarity feature D with the Biwa II event, which would imply a difference of some 3 0 kyr between interpolated and real age. However, given the doubts about the very existence of the reversed polarity discussed above, one cannot really judge of the significance of
this difference.
Second, we have calculated the time self-correlation
function of both the intensity and the inclination records. The time self-correlation function •('r) of any time dependent
physical
quantity
f(t) fluctuating
around
zero is defined
as the
normalized averaged value of f(t)*f(t+'c), where f(t+'c) is f(t) shifted by the time increment 'c [see, e.g., l_zmdau and Lifchitz, 1967]. By definition, •(0) = 1. The correlation function then decreases with increasing 'c, reaching noise level for 'c of the
order of the time constant characteristic of the fluctuations of
f(t). Therefore, for the fluctuations in geomagnetic inclination and intensity about the value expected for a geocentric dipole and the mean values, respectively, the time self-correlation
function should decrease to zero for values of 'c of the order of
the time constants associated to the nondipole and dipole
terms. These are of the order of 400 to 2000 years,
respectively, as obtained from the analysis of the historical
field by Hulot and Le Mou•l [ 1994].
For the calculation of the time correlation functions the
420-326 kyr and the 326-39 kyr intervals were considered separately, because of their different average extrusion rates.
In both cases the self-correlation functions were calculated
with 'c progressively incremented by steps of one flow (which
is the "natural" time increment of the record), corresponding
to 610 years or 5600 years, respectively, when linear interpolation is used. The 39 ka to present interval was not analyzed because the HSDP paleointensity record is not detailed enough in this period. The 95% noise levels were
LAJ AND KISSEL: GEOMAGNETIC P•INTENS1TIES FROM CORE HSDP 15,325
Table 2. Successful Paleointensity Determinations for HSDP core.
Flow Depth, Age, Sample f g q Fe-•.d., {I}ñI(L
m kyr pT deg ' 1 12.0 1.6 A 0.94 0.58 10.4 47.2 + 2.5 33.6 + 4.3 B 0.54 0.78 8.0 32.7 + 1.8 C 0.52 0.79 8.4 31.0 + 1.5 11 61.2 17.7 A 0.55 0.73 6.3 37.3 + 2.4 36.8 + 4.4 B 0.50 0.84 13.4 49.0 + 1.6 C 0.68 0.86 23.7 38.8 + 1.0 13 93.7 20.9 B 0.49 0.83 6.1 29.9 + 2.0 34.9 + 10.4 C 0.36 0.80 5.4 39.4 + 2.1 14 104.2 22.5 A 0.55 0.77 21.8 38.3 + 0.7 21.7 + 2.0 B 0.59 0.76 23.5 40.9 + 0.8 C 0.63 0.86 36.2 38.7 + 0.6 15 120.0 24.1 A 0.29 0.81 6.8 45.2 + 1.6 19.2 + 0.5 B 0.49 0.86 14.7 40.4 + 1.2 16 139.1 25.7 B 0.46 0.85 28.8 33.9 + 0.5 47.1 + 1.7 C 0.66 0.90 38.6 33.0 ñ 0.5 17 150.7 27.3 A 0.67 0.83 35.0 37.2 + 0.6 49.2 + 11.4 B 0.78 0.85 22.2 34.0 + 1.0 C 0.83 0.82 44.6 38.7 + 0.6 19 155.3 30.6 B 0.27 0.82 5.2 29.9 + 1.3 49.1 + 5.1 C 0.34 0.73 4.8 44.7 + 2.3 20 160.9 32.2 A 0.34 0.81 5.5 37.0 + 1.9 54.5 + 2.2 B 0.32 0.86 5.2 54.8 + 3.0 C 0.34 0.88 6.3 44.7 + 2.2 23 177.7 37.0 A 0.52 0.79 6.0 27.9 + 1.9 -2.3 + 3.3 B 0.27 0.85 4.1 30.9 + 1.7 27 184.5 55.5 B 0.68 0.74 6.1 17.0+ 1.4 51.9+ 10.8 C 0.83 0.77 17.3 13.6 + 0.5 28 191.4 61.1 A 0.57 0.76 16.4 16.4 + 0.4 57.2 + 2.5 B 0.29 0.84 5.1 22.0 + 1.1 C 0.62 0.87 23.7 21.3 + 0.5 29 199.7 66.8 A 0.53 0.80 14.6 12.9 + 0.4 35.9 + 3.1 B 0.22 0.87 5.6 16.7 + 0.6 C 0.66 0.74 13.4 15.3 + 0.6 30 205.1 72.4 A 0.52 0.83 17.0 14.2 +0.4 43.1 + 1.5 B 0.75 0.85 21.8 14.9 + 0.4 C 0.83 0.88 54.8 13.0 _+ 0.2 33 214.0 89.3 B 0.43 0.69 10.5 17.5 + 0.5 22.5 + 4.0 C 0.82 0.77 30.6 13.0 + 0.3 34 221.2 95.0 C 0.74 0.87 34.1 34.4 + 0.7 26.9 + 1.9 39 256.8 123.1 B 0.29 0.74 3.0 11.0 + 0.8 25.7 + 4.6 C 0.61 0.69 13.5 8.7 + 0.3 43 269.2 145.7 A 0.50 0.81 10.0 33.0 + 1.4 46.4 + 5.1 B 0.77 0.76 20.2 33.1 + 1.0 C 0.43 0.87 9.5 35.7 + 1.4 45 281.6 156.9 B 0.44 0.75 6.3 56.1 + 3.0 29.8 ñ 2.9 C 0.54 0.87 18.5 45.6 + 1.2 46 284.4 162.6 A 0.48 0.80 6.5 41.6 _+ 2.5 27 + 0.8 B 0.82 0.82 24.9 34.9 + 0.9 C 0.47 0.86 13.4 33.7 + 1.0 47 288.4 168.2 B 0.93 0.86 25.5 26.8 + 0.8 30.9 + 0.9 C 0.49 0.71 6.0 35.5 + 2.1 50 303.9 185.1 A 0.22 0.78 3.0 38.4 +2.3 14.5 +_6.4 B 0.46 0.75 8.4 17.0 +- 0.7 C 0.30 0.86 5.6 46.2 + 2.2 51 306.3 190.8 C 0.67 0.85 18.9 15.7 +0.5 27.0+- --- 54 315.3 207.7 C 0.56 0.76 8.7 20.5 + 1.0 14.4 + 5.8 57 327.2 224.6 B 0.79 0.77 21.6 67.4 +- 1.9 26.1 +- 7.0 C 0.54 0.83 5.7 73.0 + 5.9 58 334.0 230.2 A 0.49 0.86 7.3 43.6 _+ 2.5 51.4 + 10.8 C 0.55 0.84 6.8 30.5 + 2.1 59 343.2 235.8 A 0.55 0.83 7.6 44.8 + 2.7 37.1 +- 3.7 B 0.47 0.83 7.8 43.3 _+ 2.2 C 0.68 0.85 27.2 61.9 + 1.3 60 346.6 241.5 A 0.29 0.75 6.4 34.6 + 1.2 35.7 + 7.9 B 0.36 0.77 7.3 39.5 -+ 1.5 C 0.58 0.72 9.4 48.7 + 2.2 61 349.9 247.1 A 0.44 0.75 3.6 38.7 + 3.6 43.9 + 2.1 C 0.48 0.85 6.2 35.1 + 2.3 62 355.4 252.7 C 0.47 0.87 10.2 26.3 +- 1.1 44.7 + 14.1 64 368.7 264.0 B 1.04 0.81 18.6 -16.8 + 0. 8 -32.1 +- 3.2 C 0.72 0.82 7.4 -16.4 +- 1.3 65 372.1 269.6 A 0.64 0.86 17.8 36.2 +- 1.1 43.4 +- --- 66 375.0 275.3 B 0.45 0.79 6.0 31.7 + 1.9 39.3 +- 0.3 {Fe}+lo, pT 37.0 + 8.9 41.7 _+ 6.4 34,6+6.7 39.3 +- 1.4 42.8 +- 3.4 33.4+0.6 36.6 + 2.4 37.3 + 10.5 45.5 +- 8.9 29.4 +- 2.1 15.3 + 2.4 19.9+-3.1 15.0 + 1.9 14.0 + 1.0 15.3 + 3.2 34.5 +--- 9.8 + 1.6 33.9 + 1.5 50,8 + 7.4 36.7 +- 4.2 31.2 +- 6.2 33.9 +- 15.2 15.7 + .... 20.5 + .... 70.2 + 4.0 37.1 +- 9.2 50.0 +- 10.3 40.9 + 7.2 36.9 + 2.5 26.3+ --- 16.6 + 0.3 36.2 + --- 31.7 +- --- VADMñI•, 1022Am 2 8.3ñ2.0 9.4ñ1.4 7.8ñ1.5 8.9ñ0.3 9.6+-0.8 7.5ñ0.1 8.3+-0.5 8.4+-2.4 10.3+-2.0 6.6ñ0.5 3.5+-0.5 4.5ñ0.7 3.4+-0.4 3.2 ñ 0.2 3.4 ñ 0.7 7.8 ñ--- 2.2ñ0.4 7.6ñ0.3 11.5+-1.7 8.3+-0.9 7.0+-1.4 7.6ñ3.4 3.5ñ .... 4.6ñ .... 15.8ñ0.9 8.4ñ2.1 11.3+-2.3 9.2+-1.6 8.3ñ0.6 3.7 +-0.1 8.2 ñ --- 7.1+- ---
15,326 LAJ AND KISSEL: GEOMAGNETIC PALEOINTENSITIES FROM CORE HSDP Table 2. _(continued). Flow Depth, m 68 377.1 69 380.2 70 389.0 71 394.1 72 402.5 73 407.1 74 409.9 75 418.4 76 423.2 78 429.5 79 432.0 80 434.6 81 436.9 82 439.5 83 441.3 86 444.9 87 447.6 88 451.8 89 458.5 90 464.7 91 470.7 92 476.6 93 479.4 94 481.2 95 484.3 96 486.4 97 490.4 98 494.2 99 500.5 100 505.9 101 507.2 102 508.5 103 514.1 Age, Sample kyr 286.6 B C 292.2 A B C 297.8 B C 303.5 A B C 309.1 A B C 314.7 A B C 320.4 A C 326.0 A B C 326.6 A B C 327.8 A C 328.4 A B C 329.1 B C 329.7 B C 330.3 C 330.9 A B 332.7 B C 333.3 B C 334.0 A B C 334.6 B C 335.2 A C 335.8 A B C 336.4 B C 337.0 A C 337.6 A B C 338.2 A B C 338.8 A B C 339.5 C 340.1 B C 340.7 A B C 341.3 A 341.9 A 342.5 A 343.1 A B f g q Feñs.d., {I}+lo, p_T deg 0.34 0.88 6.9 42.0 + 1.8 40.1 + 2.2 0.30 0.79 5.3 40.5 + 1.9 0.40 0.77 7.0 29.4 + 1.3 39.8 + 7.7 0.36 0.77 5.0 35.8 + 2.0 0.80 0.75 71.0 37.8 + 0.3 0.28 0.58 1.3 28.0 + 3.5 30.5 + 5.3 0.77 0.82 19.8 29.3 + 0.9 0.38 0.80 6.6 42.0 + 2.0 36.9 + 8.8 0.3 0.69 1.9 45.9 + 5.1 0.55 0.84 11.6 39.4 + 1.6 0.83 0.81 20.5 54.1 + 1.8 51.2 + 2.0 0.42 0.73 2.7 42.2 + 4.8 0.83 0.85 15.4 44.5 + 2.1 0.44 0.86 9.4 30.5 + 1.2 49.7 + 3.0 0.27 0.78 7.4 32.0+0.9 0.61 0.79 11.0 26.6 + 1.2 0.44 0.86 13.2 35.5 + 1.0 51.4 + 0.9 0.43 0.87 12.3 30.5 + 0.9 0.64 0.85 12.7 19.5 + 0.8 29.1 + 3.7 0.48 0.75 10.1 18.6+0.7 0.32 0.82 7.0 26.4 + 1.0 0.49 0.77 7.0 44.3 + 2.4 56.8 + 8.0 0.29 0.77 8.0 22.5 + 0.6 0.51 0.80 9.6 19.7 + 0.8 0.43 0.82 8.7 44.1 + 1.8 54.9 + 10.0 0.63 0.83 7.6 35.7 + 2.5 0.54 0.73 6.8 23.5 + 1.4 37.2 + 4.5 0.59 0.73 8.8 28.6 + 1.4 0.78 0.82 65.2 25.2 + 0.2 0.40 0.81 3.9 33.3 + 2.8 46.5 + 7.6 0.54 0.84 17.0 32.5 + 0.8 0.62 0.85 20.0 31.6 + 0.8 41.5 + 12.4 0.67 0.84 8.8 43.2+2.8 0.70 0.78 17.6 22.7 + 0.7 23.7 + 1.1 0.25 0.74 3.8 32.7 + 1.6 34.2 + 7.1 0.49 0.84 10.3 42.1 + 1.7 0.57 0.73 11.3 29.3 + 1.1 40.3 + 5.4 0.87 0.84 15.2 23.2 + 1.1 0.51 0.79 11.1 42.4+1.6 38.3+0.6 0.66 0.78 16.3 34.6 + 1.1 0.60 0.78 7.2 29.5 + 1.9 43.5 + 5.6 0.67 0.75 10.4 29.8 + 1.5 0.79 0.75 15.5 33.0 + 1.3 0.34 0.83 4.5 26.9 + 1.7 42.0 + 9.5 0.61 0.82 9.9 28.1 + 1.4 0.28 0.74 8.1 22.5 + 0.6 21.2 + 30.8 0.34 0.79 4.7 24.3 + 1.4 0.23 0.79 3.0 65.0 + 4.0 22.7 + 2.7 0.83 0.84 23.1 48.4 + 1.5 0.59 0.73 10.4 60.0 + 2.5 0.57 0.84 17.7 52.1 + 1.4 29.5 + 2.5 0.46 0.80 11.1 63.0+2.1 0.53 0.79 16.6 51.0 + 1.3 30.3 + 3.2 0.57 0.81 18.9 45.0+ 1.1 0.69 0.81 24.8 39.1 + 0.9 33.1 + 4.7 0.76 0.81 23.8 41.8 + 1.1 0.51 0.65 13.5 35.3 + 0.9 0.9 0.82 62.0 35.6 + 0.4 38.1 + 2.5 0.9 0.81 83.4 34.8 + 0.3 0.93 0.77 72.4 32.5 + 0.3 0.48 0.81 12.6 42.3 + 1.3 33.6 + 2.4 0.56 0.83 17.9 40.6 + 1.1 0.62 0.84 18.2 39.3 + 1.1 0.54 0.87 15.2 42.5 + 1.3 41.0 + 0.9 0.51 0.84 20.8 54.2 + 1.1 36.1 + 9.7 0.44 0.86 7.3 61.7 + 3.2 0.51 0.74 14.2 34.7 + 0.9 28.3 + 4.0 0.39 0.79 6.9 32.8 + 1.5 0.37 0.76 9.1 28.3 + 0.9 0.25 0.73 3.9 43.0 + 2.0 45.3 + 3.0 0.69 0.66 14.0 25.9 + 0.9 39.4 + --- 0.60 0.67 6.9 62.9 + 3.7 33.9 + 5.8 0.74 0.71 11.8 50.0+2.2 42.8+3.1 0.74 0.49 22.5 49.5 + 0.8 {•}ñlo, pT 41.2ñ1.0 34.3ñ4.4 28.6ñ1.0 42.4ñ3.3 •.9ñ6.3 29.7ñ2.8 33.0ñ3.5 21.5ñ4.2 28.8ñ13.5 39.9ñ5.9 25.8ñ2.6 32.9ñ0.5 37.4ñ8.3 22.7ñ--- 37.4ñ6.6 26.3ñ4.3 38.5ñ5.5 30.8ñ1.9 27.5ñ0.8 23.4ñ1.2 57.8ñ8.5 57.5ñ7.7 48.0ñ4.2 38.9ñ3.0 34.3ñ1.6 40.8ñ1.5 42.5 58.0ñ5.3 31.8 •.2 43.0ñ --- 26.0 ñ --- 62.9ñ --- 49.4 ñ 0.7 VADMñlo, 1022Am 2 9.3ñ0.2 7.7ñ1.0 6.4ñ0.2 9.6ñO.7 10.6ñ1.4 6.7ñ0.6 7.4ñ0.7 4.8ñ0.9 6.5ñ3.0 9.0ñ1.3 5.8ñ0.6 7.4ñ0.1 8.4ñ1.9 5.1ñ--- 8.4ñ1.5 5.9ñ1.0 8.7ñ1.2 6.9ñ0.4 6.2ñ0.2 5.3ñ0.3 13.0ñ1.9 13.0ñ1.7 10.8ñ0.9 8.8ñ0.7 7.7ñ0.4 9.2ñ0.3 9.6ñ--- 13.1ñ1.2 7.2ñ0.7 9.70 ñ --- 5.85ñ --- 14.2 ñ --- 11.1ñ0.1
LAJ AND KISSEL: GEOMAGNETIC PALEOINTENSITIES FROM CORE HSDP 15,327 Table 2. •(continued•. Flow Depth, m 104 516.9 105 520.0 106 526.4 107 532.1 108 538.9 109 542.9 110 549.7 111 555.2 112 556.8 113 561.4 114 566.1 115 567.8 116 574.7 118 590.6 119 597.2 120 604.7 123 609.9 124 610.5 125 616.1 126 625.8 127 629.4 128 632.7 129 636.2 130 642.7 131 645.5 132 657.8 134 662.0 Age, Sample kyr C 343.7 A B C 344.3 A B C 345.0 A B 345.6 A B C 346.2 A B C 346.8 A B C 347.4 A B C 348.0 A B C 348.6 A B C 349.2 A B C 349.9 A B C 350.5 A B C 351.1 A B C 352.3 A B C 352.9 B C 353.5 A B C 355.4 B C 356.0 A B C 356.6 A B C 357.2 A B C 357.8 B C 358.4 A B C 359.0 A 359.6 B 360.2 A B 360.9 A B C 362.1 A B C f g q Fezks.d, {I}+lo, pT de.g 0.80 0.55 10.8 48.6+2.0 0.22 0.78 2.7 39.9 + 2.6 42.0 + 3.1 0.55 0.87 18.7 44.3 + 1.1 0.33 0.81 4.5 50.7 + 3.1 0.43 0.78 9.1 56.9 + 2.1 38.1 + 0.9 0.68 0.84 16.7 50.9 + 1.8 0.42 0.72 12.5 50.1 + 1.2 0.43 0.80 9.0 59.0 + 2.3 39.3 + 1.7 0.41 0.77 6.2 58.9 + 3.0 0.50 0.75 9.8 46.1 + 1.8 43.0 + 1.3 0.53 0.83 8.1 38.9 + 2.2 0.55 0.84 10.6 42.8 + 1.9 0.40 0.79 4.6 42.4 + 3.0 24.5 + 0.9 0.40 0.79 8.1 36.3 + 1.4 0.50 0.83 18.1 39.4 + 0.9 0.75 0.81 34.8 45.7 + 0.8 24.9 + 2.2 0.50 0.85 12.0 34.6 + 1.2 0.54 0.83 25.9 34.0 + 0.6 0.52 0.71 9.5 39.4 + 1.5 29.4 + 4.3 0.42 0.82 12.3 47.7 + 1.4 0.38 0.75 8.5 49.5 + 1.7 0.84 0.86 35.0 45.7 + 1.0 23.6 + 2.9 0.84 0.85 51.4 40.8 + 0.6 0.77 0.81 37.6 39.3 + 0.6 0.67 0.78 48.1 46.1 + 0.5 21.6 + 4.7 0.90 0.86 39.7 46.4 + 0.9 0.36 0.71 9.9 33.0 + 0.9 0.46 0.69 5.6 40.4 + 2.3 25.2 + 2.8 0.94 0.89 88.0 32.3 + 0.3 0.41 0.63 11.0 32.6 + 0.8 0.37 0.79 7.1 40.6 + 1.7 20.2 + 4.4 0.63 0.82 33.4 44.2 + 0.7 0.84 0.85 19.3 41.7 + 1.6 0.28 0.84 13.5 17.2 + 0.3 26.6 + 2.7 0.48 0.74 7.1 20.1 + 1.0 0.44 0.75 7.2 28.2 + 1.3 0.31 0.67 8.5 34.1 + 0.8 12.8 + 4.4 0.96 0.82 82.4 34.4 + 0.3 0.74 0.75 31.1 34.3 +0.6 0.26 0.79 2.6 48.8 + 3.9 17.3 + 2.8 0.34 0.82 5.5 44.5 + 2.3 0.47 0.71 14.6 41.1 +0.9 0.77 0.78 19.7 20.7 _ 0.6 22.6 + i .4 0.66 0.76 15.9 18.9 + 0.6 0.39 0.81 5.3 32.4 + 1.9 47.2 + 3.1 0.75 0.86 21.4 37.8 + 1.1 0.64 0.82 16.4 37.6 + 1.2 0.68 0.73 23.0 25.0 + 0.5 42.3 + 0.7 0.49 0.83 22.2 30.1 + 0.5 0.36 0.81 12.1 34.3 + 0.8 40.4 + 6.6 0.52 0.79 15.7 42.5 + 1.1 0.35 0.84 13.8 36.0+0.8 0.58 0.76 5.8 38.0 + 2.9 45.8 + 2.1 0.46 0.73 8.0 39.0 + 1.6 0.58 0.78 13.1 34.7 + 1.2 0.46 0.67 9.0 43.4 + 1.5 23.9 + 2.4 0.76 0.87 17.5 33.8 + 1.3 0.69 0.80 9.9 41.5 + 2.4 0.92 0.68 27.6 13.0 + 0.3 24.9 + 3.1 0.41 0.88 11.6 38.1 + 1.2 0.38 0.77 7.5 43.6 + 1.7 27.5 + 2.2 0.55 0.83 11.1 64.3 + 2.7 0.51 0.84 12.9 76.0+2.6 0.49 0.85 7.5 67.5 + 3.9 25.6 + 1.8 0.67 0.83 9.3 68.2 + 4.1 29.4 + 3.5 0.32 0.78 5.3 49.3 + 2.3 39.0 + 0.8 0.39 0.85 9.0 51.0 + 1.9 0.56 0.85 10.3 46.0 + 2.1 31.6 + 6.7 0.90 0.73 56.7 29.8 + 0.3 0.53 0.75 21.4 31.6 + 0.6 0.37 0.82 7.3 40.5 + 1.7 31.6 + 0.6 0.44 0.87 13.3 44.8 + 1.3 0.53 0.87 24.6 44.0 + 0.8 (Fe}+lo, pT 45.0+5.4 52.7 + 3.7 59.0 + 0.05 42.6 + 3.6 39.4 + 3.0 38.1 + 6.6 45.5 + 5.4 41.9+3.4 41.8 + 7.7 35.1 + 4.6 42.2 + 1.9 21.8 :': 5.7 34.3 + 0.1 44.8+3.9 i 9.8 + i.3 36.0 + 3.1 27.6+3.6 37.6 + 4.3 37.2 + 2.2 39.6+5.1 25.6 + 17.7 61.3 + 16.4 67.5 + --- 68.2 + --- 50.2 + 1.2 35.8 + 8.8 43.1 + 2.3 VADMñlo, 1022Am 2 10.1ñ1.2 11.9ñ0.8 13.3ñ0.0 9.6ñ0.8 8.9ñ0.7 8.6ñ1.5 10.3ñ1.2 9.5ñ0.8 9.4ñ1.7 7.9ñ1.0 9.5ñ0.4 4.9ñ1.3 7.7ñ0.0 10.1ñ0.9 4.5ñ0.3 8.1ñ0.7 6.2ñ0.8 8.5ñ1.0 8.4ñ0.5 8.9ñ1.1 5.8ñ4.0 13.8ñ3.7 15.2 ñ --- 15.4 ñ 11.3ñ0.3 8.1ñ2.0 9.7ñ0.5