Publisher’s version / Version de l'éditeur:
Vous avez des questions? Nous pouvons vous aider. Pour communiquer directement avec un auteur, consultez la première page de la revue dans laquelle son article a été publié afin de trouver ses coordonnées. Si vous n’arrivez pas à les repérer, communiquez avec nous à PublicationsArchive-ArchivesPublications@nrc-cnrc.gc.ca.
Questions? Contact the NRC Publications Archive team at
PublicationsArchive-ArchivesPublications@nrc-cnrc.gc.ca. If you wish to email the authors directly, please see the first page of the publication for their contact information.
https://publications-cnrc.canada.ca/fra/droits
L’accès à ce site Web et l’utilisation de son contenu sont assujettis aux conditions présentées dans le site LISEZ CES CONDITIONS ATTENTIVEMENT AVANT D’UTILISER CE SITE WEB.
3rd International Building Physics Conference [Proceedings], pp. 321-328, 2006-08-01
READ THESE TERMS AND CONDITIONS CAREFULLY BEFORE USING THIS WEBSITE. https://nrc-publications.canada.ca/eng/copyright
NRC Publications Archive Record / Notice des Archives des publications du CNRC :
https://nrc-publications.canada.ca/eng/view/object/?id=6cd26841-cb45-4dfc-8e33-fd89d703da81 https://publications-cnrc.canada.ca/fra/voir/objet/?id=6cd26841-cb45-4dfc-8e33-fd89d703da81
NRC Publications Archive
Archives des publications du CNRC
This publication could be one of several versions: author’s original, accepted manuscript or the publisher’s version. / La version de cette publication peut être l’une des suivantes : la version prépublication de l’auteur, la version acceptée du manuscrit ou la version de l’éditeur.
Access and use of this website and the material on it are subject to the Terms and Conditions set forth at
Hygrothermal modeling of aerated concrete wall and comparison with field experiment
http://irc.nrc-cnrc.gc.ca
H ygrot he r m a l m ode ling of a e rat e d
c onc re t e w a ll a nd c om pa rison w it h fie ld
ex pe rim e nt
N R C C - 4 5 5 6 0
T a r i k u , F . ; K u m a r a n , M . K .
A version of this document is published in / Une version de ce document se trouve dans: 3rd International Building Physics Conference, Montreal, QC., August 27, 2006, pp. 321-328
Hygrothermal Modeling of Aerated Concrete Wall and Comparison With
Field Experiment
F. Tariku & M. K. Kumaran
Institute for Research in Construction, NRC Canada, Ottawa, Ontario, Canada
ABSTRACT: A two-dimensional heat, air and moisture transport model called hygIRC is adapted to simulate a well-documented field exposure of an aerated concrete wall section. Difficulties are encountered due to a few missing information on boundary conditions of the exposure and hygrothermal properties of aerated con-crete. The paper presents how these inadequacies were overcome to simulate the hygrothermal behavior of the wall section. Appropriate assumptions were made due to justifiable reasons. Then the model provides temporal and spatial distributions of temperature and relative humidity for an extended period that are in ex-cellent agreement with the documented field data. The paper presents the justifications for the assumptions and the comparison of experimental and simulation results.
1 INTRODUCTION
Hygrothermal (Heat, Air and, Moisture Transport or HAM) models are gradually finding their ways into the hands of building practitioners. Researchers have made significant advances in the development of these models during the past two decades (Hens 1996; Trechsel 2001). Several computer models are now commercially or publicly available to the prac-titioners. Examples are MOIST, MATCH, WUFI, hygIRC, and DELPHIN. But the question always asked is: How reliable are these models?
In order to address the above question, a European Union project called HAMSTAD was launched. One of the outputs of that project was a set of bench-marking exercises (Hagentoft et al. 2004) that can judge the reliability of one-dimensional HAM mod-els. This, though a major step forward to addressing the question, is still not the final solution. Well-controlled laboratory as well as field experiments with measurable hygrothermal effects shall be per-formed and these experiments shall be simulated us-ing the models. Agreements between the measured and simulated results of these experiments at the very least shall be semi-quantitative. Quantitative agreements are desirable. Experience, however, shows that the latter is very challenging, due to a va-riety of reasons. The three-dimensional processes when captured by a HAM model that is at best a dimensional model is converted to a two-dimensional problem. This introduces several as-sumptions. Often factors that support full justifica-tions for these assumpjustifica-tions will be missing from the experiments. Good examples are the actual path of airflows that may exist in typical wood-frame con-structions or the model representation of the studs in the cavities of a wall. Lack of proper information on
the boundary conditions has always been a problem. Information on the hygrothermal properties of the components is often incomplete or non-existing. In-terfacial phenomena are not properly accounted for, in experiments and in simulations. Liquid water movement if it exists within the cavities or on the surfaces is not easy to model or quantify by experi-ments. So the best one can expect is a
semi-quantitative agreement between the experiment and HAM model simulation. At the field level even this is hard to accomplish.
Zarr et al. (1995) have reported a set of experiments on wall specimens and corresponding HAM simula-tions. But the hygrothermal changes that were un-dergone by the test specimens were small in those experiments and hence the simulations were not challenging for a HAM model. Künzel & Kießl (1996) have reported a field experiment on brick and used the results from it to fine-tune their inputs to several hygrothermal simulations using WUFI. In a recently concluded ASHRAE project, experiments from laboratory and field measurements were used to benchmark a hygrothermal model (Burnett, in prep.).
At the Institute for Research in Construction, several small scale and full-scale laboratory experiments have been performed to benchmark hygIRC. Kuma-ran & Wang (2002) obtained nearly quantitative agreement with a drying experiment on a set of fully saturated 30 cm × 30 cm specimens of an exterior sheathing board. Tariku & Kumaran (2002) have re-ported good agreement between transient moisture distributions from a gamma spectroscopic investiga-tion of a 10 cm × 10 cm × 10 cm aerated concrete specimen and corresponding hygIRC simulations, during the drying of the fully saturated specimen. Maref et al (2002a) have reported many experiments and hygIRC simulations on the drying process un-dergone by 1 m × 60 cm test specimens of OSB in
contact with various types of membranes as well as full-scale wall specimens (2m × 2m) with semi-quantitative agreements (Maref et al 2002b). In the present work hygIRC has been adapted to simulate a series of field experiments on many sec-tions of wall specimens that was performed at the Norwegian Building Research Institute (Geving & Uvslǿkk 2000). Geving et al. (1997) have reported some of the earlier attempts to compare the experi-mental results and HAM simulations. The agree-ments between the two were often poor and the au-thors have attempted to give some explanations, based on conjecture. The present work, which in-cludes several parametric analyses, points out sev-eral challenges in comparing the results from the field experiments and corresponding HAM simula-tions using hygIRC. The scope of this conference paper does not allow the authors to present all the results from their study. Hence mainly a series of simulation results on the hygrothermal behavior of an aerated concrete wall section is presented here.
2 FIELD EXPERIMENT
With the objective of generating experimental data for verification of HAM models Geving and Uvsløkk (2000) performed a field experiment on a test house. The test house was built on an open field located at Voll, Trondheim, Norway, with a weather station beside it (16 m away from the test house). The temperature, relative humidity and moisture content of various walls and roof sections were in-strumented and monitored. The test house was de-signed to have a total of sixteen instrumented walls and eight roof panels separated by polyethylene foil to avoid lateral airflow and moisture transfer. Eight of the walls were oriented in the east and the rest in the west. The detailed description of the configura-tions and materials used for the walls and roofs, as well as the experimental setup are discussed in Geving and Uvslǿkk (2000) report.
In this paper, aerated concrete wall section is con-sidered for verification and benchmarking of IRC’s advanced hygrothermal model, hygIRC. The wall orientation is east, and has a dimension of 1200, 300 and 3250 mm for the width, thickness and height, re-spectively. It is exposed to the Voll weather condi-tion at the exterior, and controlled temperature and relative humidity of 23oC and 45%, respectively, at the interior. Although the wall is subjected to these boundary conditions since October of 1994, the ac-tual measurement of temperature and relative h midity in the structure was started only in Feb of 1996. Three temperature and relative humidity
sensors were positioned at a depth of 50, 150 and 260 mm from the interior to the exterior at a cross-section plane of 1100 mm from the top,
u-ruary
Figure 1. A continuous measurement of temperature and relative humidity with one-hour time interval was recorded by the data acquisition system. The indoor climate (temperature and relative humidity) was logged in on an hourly basis as well. The weather station re-corded the ambient temperature, relative humidity, wind speed, wind direction, rainfall, air pressure, global radiation, long-wave radiation and snow depth. For most of the parameters the average, minimum and maximum values for the hour are de-rived from every five-second (one second for wind) measurement.
3 DESCRPTION OF THE HYGROTHERMAL MODEL (hygIRC)
The two-dimensional version of the advanced hy-grothermal model of IRC, hygIRC, is used in this work. The non-uniform loadings, which are applied along the height of the wall, caused by stack effect and wind-driven-rain may cause two-dimensional flows. The detailed description of the model1 is pub-lished previously by Karagiozis (1993, 1997), Sa-lonvaara & Karagiozis (1994) and Hens (1996). Here, a brief description of the mathematical model is presented. The model solves, simultaneously, the three interdependent transport phenomena of heat, air and moisture in a building component. The mathematical model is based on building physics and comprises a set of partial differential equations that govern the individual flows. The corresponding governing equations are as follow:
Moisture balance:
(
)
(
)
v w w p v w u K g t D w p m ρ ρ δ s ∂ + ∇ ⋅ + = ∂ ∇ ⋅ ∇ + ∇ + r r & (1) Heat balance:(
)
(
)
(
)
, o a p a v p v l ice s T c u c T t T L p f L w Q t ρ ρ λ δ ∂ + ∇ ⋅ = ∂ ⎡ ⎤ ∇ ⋅ ∇ + ⎣∇ ⋅ ∇ − ∂ ⎛ ⎞ + ⎜ ∂ ⎟ ⎝ ⎠ r & ⎦ (2) 1In earlier development of hygIRC it is used to be called LATENITE
Air mass balance:
(
ρau)
0∇ ⋅ r = (3)
Momentum balance (Darcy equation)
a k u η = − ∇ r P (4) 0 a a k P ρ η ⎛ ⎞ −∇ ⋅⎜ ∇ ⎟= ⎝ ⎠ (5)
where w=moisture content (kg/m3); u=air velocity (m/s);
r
v
ρ =water vapor density (kg/m3); =liquid water permeability (s);
K w
ρ =density of water (kg/m3); =acceleration due to gravity (m/s
gr 2); =moisture diffusivity (m w D 2 /s); δp=vapor permeability (s); v
p =vapor pressure (Pa); m& =moisture source s
(kg/m3); =effective heat capacity (J/kg.K);c ρo=dry density of the material (kg/m3); T =temperature (oC); ρa=density of air (kg/m3); =specific ca-pacity of air (J/kg.K);
,
p a c
λ =effective thermal conduc-tivity (W/m.K); =latent heat of
evapora-tion/condensation (J/kg); =latent heat of freezing/melting (J/kg); v L ice L l
f =fraction of water frozen
(-); Q& =heat source (W/s.ms 3); =air permeability (m
a k
2
); and η=dynamic viscosity (kg/ms).
The driving potentials of moisture transport, Equa-tion (1), are vapor pressure and moisture content. The advanced model includes two important mois-ture transport mechanisms, in addition to diffusion process: water vapor transport by convection and liquid water transport by gravity as expressed by the second and third terms of the left hand side of the equation, respectively. The model has also the capa-bility of handling volumetric moisture source or sink as represented by the last term in the right hand side of the equation. Temperature is the driving potential for the heat balance equation, Equation (2). The transfer of heat by convection and diffusion are rep-resented by second (l.h.s) and first (r.h.s) terms of the equations, respectively. The heat source/sink as-sociated with phase changes are represented by the second (evaporation/condensation) and third (freeze-thaw) terms of the right hand side of the equation. Any other internal heat source/sink is given by the last term of the of the right hand side of the
equa-tion. The mass balance equation for incompressible fluid is given by Equation (3). In building physics application, the air is considered as incompressible due to very low airflow speed, and low pressure and temperature changes. Darcy equation, Equation (4), is a reduced form of Navier-Stokes momentum equation for flow in a porous media. Combing the mass balance, Equation(3), and momentum balance, Equation (4), equations gives Equation (5).
O
4 APPLICATION OF THE HYGROTHERMAL MODEL (hygIRC)
The two-dimensional version of hygIRC does a tran-sient calculation on a geometrical model, which represents a building component with a number of layers of materials in a two dimensional domain. The model outputs a transient state of moisture con-tent, temperature and airflow distribution in the cal-culation domain for the applied time varying bound-ary and given initial conditions. The application of hygIRC is demonstrated in a number of publications; Karagiozis et al. (1996), Djebbar et al. (2002), Muk-hopadhyaya et al. (2003).
Geving (1997) and Geving et al. (1997) applied the model to reproduce the experimentally measured lo-cal moisture and temperature conditions on wood frame constructions. They found similar trends with some discrepancy and gave the following reasons for the discrepancy: uncertainty of measurements, exis-tence of unforeseen phenomena—high air convec-tion in the cavity, and influence of moisture sensors on the measurement. Maref et al. (2000a) bench-marked hygIRC with a well-controlled laboratory experiment. They carried out drying experiments of simplified wall assemblies in a constant boundary condition, and measured the total weight loss of the assembly during the drying process. The benchmark exercise, which was a comparison of the measured and computed gross weight (total weight of the wall sample), yielded good agreement. In this paper the model is benchmarked against a field-experiment. In this case, the aerated concrete wall shown in, Figure 1, is exposed to real weather conditions on the out-side and controlled indoor conditions in the inout-side. Relative humidity and temperature, measured at spe-cific locations are used to benchmark the model pre-dictions.
Figure 1 Aerated concrete wall
Modeling with hygIRC involves a number of input data processing, such as creating a two-dimensional representation of the wall, generating the indoor and outdoor boundary conditions, establishing initial conditions, and preparation of the hygrothermal properties of materials involved in specific formats.
4.1 Wall geometry
Assuming the temperature and moisture gradients in the third directions are negligible, the wall is repre-sented in two-dimension by a vertical cross-section at the centerline of the wall. As shown in Figure 1, the cross-section has a dimension of 3250 mm height and 300 mm thickness. The three temperature and relative humidity sensors were positioned at a depth of 50, 150 and 260 mm from the interior to the exterior at a horizontal cross-section plane of 1100 mm from the top. In the computational domain, the wall cross-section is discretized into a number of control volumes and the mathematical models are applied at each control volume to arrive at a solution that satisfies all the balance equations described above. 4.2 Boundary conditions 40mm 50mm INSIDE 1100m 150mm 300mm 3250mm OUTSIDE
RH and Temperature sensors
In the experiment the indoor conditions were con-trolled, and the set temperature and relative humidity were 23oC and 45%, respectively. As shown in Figure 2-3 the actual measurements (in daily aver-age) deviated from the set values. In summer of 1997 the indoor temperature rose above 30oC, and in the wintertime of the same year went below 20oC (Figure 2). A significant drop of relative humidity in the house occurred in April 1997, when the ventila-tion system was adjusted to create over pressure condition in the house (Figure 3). The indoor pres-sure before and after April 1997 were 2 Pa negative pressure and 0.5 Pa overpressure, respectively. In the modeling, the measured indoor temperature, relative humidity and pressure conditions are applied as indoor environmental conditions. The indoor boundary conditions for heat and moisture balance equations are applied as Neumann boundary condi-tions, where the fluxes are calculated using the cor-responding surface transfer coefficients and change in the driving potentials. In this work constant val-ues of 8 W/m2.K and 5.08E-8 s/m are used for the indoor surface heat and mass transfer coefficients, respectively.
The outside surface of the wall is exposed to Voll weather. Voll is located at 63.25o latitude and 10.28o longitude. The outdoor environmental conditions which are required for hygIRC simulation are: hourly temperature, relative humidity, wind speed, wind-direction, global, diffuse and reflected radia-tions, rain and cloud index. The model incorporates solar radiation, radiation heat exchange with the sur-rounding and sky, and moisture load due to wind-driven rain. In the field experiment since March 1995 the outdoor weather conditions were measured and recorded by an automated weather station. In some occasions the measurements were not com-plete; there were missing data of rain, global radia-tion and in some cases the whole weather parame-ters.
Daily Average Temperature vs. Time
Temperature (° C) Time (Date) 10 20 30 40
1 Mar 96 1 Dec 96 1 Sep 97 1 Jun 98
Daily Average Relative Humidity vs. Time RH (%) Time (Date) 0 10 20 30 40 50 60
1 Mar 96 1 Dec 96 1 Sep 97 1 Jun 98
Figure 3 Daily average indoor relative humidity
In these cases extrapolation from adjacent data were performed. The boundary conditions on the outdoor surface are applied as Neumann conditions with variable surface transfer coefficients. The heat trans-fer coefficient is a function of wind speed, and the mass transfer coefficient is deduced from the heat transfer coefficient using Lewis relation.
The boundary conditions for heat and moisture transfer at the top and bottom surfaces are assumed to be adiabatic since the area of interest (measuring points) are relatively far from the end surfaces. Even though the test house was monitored since Oc-tober 1994, the actual measurement on the aerated concrete wall was started in March 1996. The later date marks the beginning of the hygrothermal simu-lation, and therefore, the relative humidity and tem-perature measured at that time by the sensors in the wall are used as initial conditions. To apply the ini-tial conditions the wall cross-section is divided ver-tically into three sections with each section of 100 mm thickness. The measured temperature and rela-tive humidity are assigned to the corresponding sec-tions throughout the wall height. These assumed ini-tial temperature and relative humidity were: on the outer section of the wall 3oC and 88% RH, on the middle section 11oC and 75% RH and on the inner section 18oC and 61% RH, respectively.
4.3 Material properties
To solve the mathematical models of heat, air and moisture balance equations described above, the properties of the material layer that define the stor-age and the flow of the appropriate entity have to be known. The heat and moisture storage capacity of a material are given as heat capacity and specific moisture capacity respectively (Kumaran 1996). The two flow coefficients for moisture transfer are vapor permeability and liquid diffusivity, which character-ize the vapor and liquid water flow in the material.
Thermal conductivity and air permeability are the heat and airflow coefficients, respectively. Both storage capacities and flow coefficients are function of temperature and moisture content. The material properties measured and reported for aerated con-crete by Bergheim et al. (1998) were: dry material density, water vapor permeability at a 72% relative humidity and adsorption and de-sorption data for the hygroscopic range. Since these reported material properties were not enough and complete for hy-gIRC simulation, a matching aerated concrete from hygIRC database is chosen based on the given mate-rial properties. As shown in Figure 4-5 the sorption isotherm and vapor permeability curves are close to the measured values. The heat capacity and air-permeability are assumed to be constant, and have values of 840 J/kg.K and 6.9E-14 m2, respectively. The density and thermal conductivity at dry state of the material are 460 kg/m3 and 0.122 W/m.K, re-spectively. The latter is adjusted based on the avail-able moisture content.
0 5 10 15 20 10 30 50 70 90 RH (%) Moisture content (kg/m 3 )
Figure 4 Sorption isotherm of Aerated concrete
Measured desorption absorption hygIRC Database 0.E+00 1.E-11 2.E-11 3.E-11 4.E-11 5.E-11 6.E-11 7.E-11 10 30 50 70 90 RH (%) W a te r v a por pe rme a b ility (s ) hygIRC data-Measured
5 RESULTS AND DISCUSSION
The dynamic response of the aerated concrete wall exposed to the outdoor weather on the exterior and controlled indoor conditions on the interior surfaces are presented below. The simulation started on March 1st 1996 and ran for a continuous period of two years and five months. The temperature and relative humidity at the sensor locations are ex-tracted for comparison with the field measurement. Figure 6 shows the measured and calculated daily average relative humidity at the inner section of the wall (50 mm). The simulation has the same trend as the measurement but is systematically
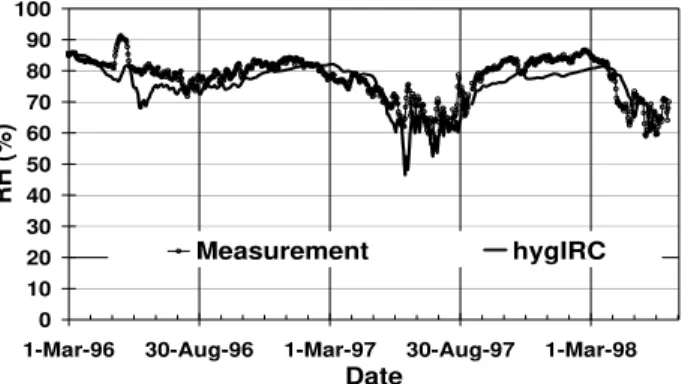
under-predicted. As it is close to the indoor environment, the values are highly influenced by the indoor rela-tive humidity condition. This is clearly shown in April 1997, where the calculated relative humidity shows steep decreases as the indoor relative humid-ity goes down (see Figure 3). In the middle section (150 mm), Figure 7, as well the simulation under-predicts the relative humidity. However, a good agreement between the measured and computed val-ues is obtained in the outer section of the wall (260 mm), Figure 8. The computed values closely follow the trend and magnitude of the measured relative humidity. Moisture condition at this point is strongly influenced by the outdoor environmental conditions, specially the wind-driven rain and solar radiation. Knowledge of liquid diffusivity of the material is very important in this section of the wall as it is ex-posed to rain load and moisture transport at high moisture content is dominant.
In the middle and inner sections of the wall the rela-tive humidity is relarela-tively constant, where as in the outer section, the wetting and drying pattern during the winter and summer season are noticeable. Tak-ing into consideration the constant deviation of the inner point measurement from the computed values, and a better agreement on the outer section of the wall, and also the fact that Geving (1997) reported in his thesis that one of the uncertainties of the experi-ment is boundary conditions measureexperi-ment, addi-tional set of simulation was performed. The new simulation employed the same material properties and outdoor weather condition, but with modified indoor environmental condition. At this time the in-door surface of the aerated concrete is exposed to a relative humidity of 10% higher than the previous case, but with the same temperature. The simulation results are shown in Figure 9-11 for the inner, mid-dle and outer section of the wall, respectively. As it can be seen from the figures, very good agreement of computed and measured relative humidity values for all three locations are obtained. As mentioned
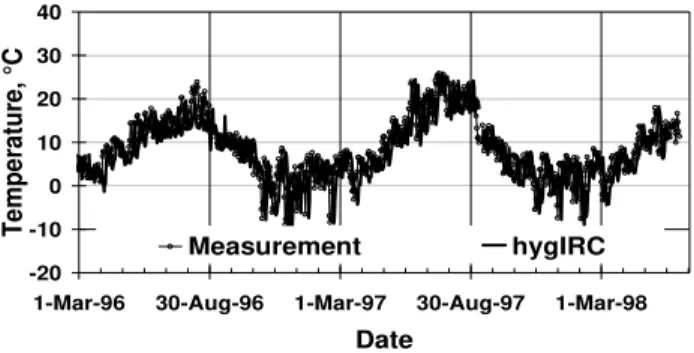
earlier, the inner and middle section of the wall are highly influenced by the indoor environmental con-dition. Figure 12-14 show the transient temperature responses of the three monitored locations. As the figures shows the computed and measured tempera-tures values agree very well in all three sections of the wall. Moreover, the temperature responses in the modified relative humidity case were not different from the corresponding values of the previous simu-lation.
Validation of hygrothermal models with experiment requires complete information on the four major in-put parameters, which are construction details, boundary conditions, initial condition and hy-grothermal properties of the materials used. In this validation exercise some difficulties were faced in the last three input parameters, and appropriate as-sumption were made, as discussed below.
0 10 20 30 40 50 60 70 80 90 100
1-Mar-96 30-Aug-96 1-Mar-97 30-Aug-97 1-Mar-98
Date
RH (%)
Measurement hygIRC
Figure 6 Comparison of measured and computed relative hu-midity at the inner section
0 10 20 30 40 50 60 70 80 90 100
1-Mar-96 30-Aug-96 1-Mar-97 30-Aug-97 1-Mar-98
Date
RH (%)
Measurement hygIRC
Figure 7 Comparison of measured and computed relative hu-midity at the middle section
0 10 20 30 40 50 60 70 80 90 100
1-Mar-96 30-Aug-96 1-Mar-97 30-Aug-97 1-Mar-98
Date
RH (%)
Measurement hygIRC
Figure 8 Comparison of measured and computed relative hu-midity at the outer section
Problem with boundary and initial condition: During the field experiments, mainly before March 1996, there were periods when the weather station was not working and missing data for the whole or some of the parameters. Because of this reason (unreliable boundary condition) the simulation had to start in March 1996 instead of the time when the test house was built (October 1994). This shift in the starting time of the simulation due to missing information on boundary conditions gave rise a problem in setting up the initial condition. The initial condition had to be different from the initial condition reported dur-ing the constriction (60% relative humidity and 23oC temperature). 0 10 20 30 40 50 60 70 80 90 100
1-Mar-96 30-Aug-96 1-Mar-97 30-Aug-97 1-Mar-98
Date
RH (%)
Measurement hygIRC
Figure 9 Relative humidity comparison with modified indoor relative humidity at the inner section
0 10 20 30 40 50 60 70 80 90 100
1-Mar-96 30-Aug-96 1-Mar-97 30-Aug-97 1-Mar-98
Date
RH (%)
Measurement hygIRC
Figure 10 Relative humidity comparison with modified indoor relative humidity at the middle section
0 10 20 30 40 50 60 70 80 90 100
1-Mar-96 30-Aug-96 1-Mar-97 30-Aug-97 1-Mar-98
Date
RH (%)
Measurement hygIRC
Figure 11 Relative humidity comparison with modified indoor relative humidity at the outer section
Consequently, the assumptions for boundary and ini-tial conditions described earlier are implemented. These are extrapolation of missing data from the ad-jacent recorded values, and adaptation of the meas-ured temperature and relative humidity at the start of simulation, respectively. -20 -10 0 10 20 30 40
1-Mar-96 30-Aug-96 1-Mar-97 30-Aug-97 1-Mar-98
Date T e m p er atu re, ° C Measurement hygIRC
Figure 12 Comparison of measured and computed temperature at the inner section
-20 -10 0 10 20 30 40
1-Mar-96 30-Aug-96 1-Mar-97 30-Aug-97 1-Mar-98
Date T e m p er atu re, ° C Measurement hygIRC
Figure 13 Comparison of measured and computed temperature at the middle section
-20 -10 0 10 20 30 40
1-Mar-96 30-Aug-96 1-Mar-97 30-Aug-97 1-Mar-98
Date T e m p er atu re, ° C Measurement hygIRC
Figure 14 Comparison of measured and computed temperature at the outer section
Problem with material properties: The heat capacity, thermal conductivity, air-permeability, and liquid diffusivity of aerated concrete were not provided. Particularly, the latter property is very important for rain absorption and distribution of moisture at high moisture content. Moreover information on the two important hygrothermal properties of aerated con-crete were incomplete: the capillary range of the moisture storage curve, and vapor permeability de-pendency on relative humidity. During the simula-tion it is assumed that the material properties used from hygIRC database (see Figure 4-5) represent the hygrothermal properties of the actual aerated con-crete used in the test house. By implementing the above assumptions validation of hygIRC with field experiment was possible.
6 CONCLUSION
Hygrothermal models are useful tools to assess the hygrothermal conditions of new and/or existing buildings. Advanced hygrothermal models give more detailed information and cover a wider moni-toring area compared to experiments. The additional advantages of computer modeling are: running mod-els is less expensive in terms of labor, time and cost, and enables to simulate both realistic and hypotheti-cal scenarios. However, the usefulness of the simula-tion result depends on the mathematical model, which describes the underling physics, and the nu-merical method used to solve the mathematical model. Moreover user’s understanding of the physi-cal problem, and adaptation of the problem in the numerical modeling are equally important. For the model to be relevant it has to be validated with ex-perimental results. At the same time, the benchmark experiment must contain complete information on construction details, boundary conditions, initial conditions and hygrothermal properties of the
mate-rials used, in addition to measured variables in the structure. In this paper, the difficulties encountered in benchmarking of hygrothermal model with a field experiment, and the appropriate assumptions made to overcome the missing information were dis-cussed. The excellent agreement of the simulation and the field experiment results validated the IRC’s advanced hygrothermal model, hygIRC, and demon-strated its capability.
7 ACKNOWLEDGEMENT
The authors acknowledge Dr. Geving and Mr. Uvslǿkk for providing the experimental data in full detail.
8 REFERENCES
Bergheim, E., S. Geving, B.Time. 1998. Hygroscopic material properties. Water vapour permeability and hygroscopic sorption curves for materials used in a test house.
Norwe-gian Building Research report. Report no 234. Trondheim,
Norway.
Burnett E. (in prep.) Development of design strategies for rain-screen sheathing membrane performance in wood frame walls. ASHRAE Research Project 1091-RP, TC 4.4 Djebbar, R.; Kumaran, M.K.; Van Reenen, D.; Tariku, F. 2002.
Use of hygrothermal numerical modeling to identify opti-mal retrofit options for high-rise buildings. 12th
Interna-tional Heat Transfer Conference. Grenoble, France, pp.
165-170, August 2002
Geving S. & Uvsløkk S. 2000. Test house measurements for verification of heat-, air and moisture transfer models. Norwegian Building Research report, Report no 273, Trondheim, Norway
Geving, S.; Karagiozis, A.N.; Salonvaara, M. 1997. Measure-ments and two-dimensional computer simulations of the hygrothermal performance of a wood frame wall. Journal
of Thermal Insulation and Building Envelopes, 20,
pp301-319
Geving, S. 1997. Moisture design of building constructions. Hygrothermal analysis using simulation models. Dr.ing. thesis, Dept. of Building and Construction Engineering, NTNU, Trondheim, Norway
Hagentoft C., Kalagasidis A. S., Adl-Zarrabi, B., Roels, S., Carmeliet, J., Hens, H., Grunewald, J., Funk, M., Becker, R., Shamir, D., Adan, O., Brocken, H., Kumaran, K., and Djebbar, R. 2004. Assessment Method of Numerical Pre-diction Models for Combined Heat, Air and Moisture Transfer in Building Components: Benchmarks for One-dimensional Cases. Journal of Thermal Envelope and
Building Science Vol. 27, pp. 327-352
Hens, H. 1996. Heat, Air and Moisture Transport, Final Re-port, Vol. 1,Task 1: Modeling. International Energy
Agency Annex 24, Laboratorium Bouwfysica, K.
U.-Leuven, Belgium
Karagiozis, A.N. 1993. Overview of the 2-D hygrothermal heat-moisture transport model LATENITE. Internal
IRC/BPL Report, IRC/NRC, National Research Council of
Karagiozis, A.N. 1997. Analysis of the hygrothermal behavior of residential high-rise building components. Client report
Karagiozis, A.N.; Salonvaara, M.; Kumaran, M.K. 1996. Nu-merical simulation of experimental freeze conditions in glass-fiber insulation. Building Physics in the Nordic
Coun-tries. Espoo, Finland, pp. 455-465, August , 1996
Kumaran, M.K. 1996. Heat, Air and Moisture Transport, Final Report, Vol. 3, Task 3: Material Properties. International
Energy Agency Annex 24, Laboratorium Bouwfysica, K.
U.-Leuven, Belgium
Kumaran, M.K.& Wang, J. 2002. How well should one know the hygrothermal properties of building materials ? , A
Thermal and Moisture Transport Property Database for Common Building and Insulating Materials, Appendix I
Fi-nal Report from ASHRAE Research Project 1018-RP
http://resourcecenter.ashrae.org/store/ashrae/newstore.cgi?i temid=8222&view=item&categoryid=177&categoryparent =177&page=1&loginid=4469
Künzel, H.M., Kießl, K. 1996. Drying of brick walls after im-pregnation. Internationale Zeitschrift für Bauinstandsetzen Edition 2 pp. 87-100.
Maref, W.; Lacasse, M.A.; Kumaran, M.K.; Swinton, M.C. 2002a Benchmarking of the advanced hygrothermal model-hygIRC with mid-scale experiments. eSim 2002
Proceed-ings, University of Concordia, Montreal, September 2002,
pp. 171-176
Maref, W.; Lacasse, M.A.; Booth, D.G. 2002b. Benchmarking of IRC's Advanced Hygrothermal Model - hygIRC Using Mid- and Large-Scale Experiments, Research Report,
Insti-tute for Research in Construction, National Research Council Canada, 126, pp. 38, December 01, 2002
Mukhopadhyaya, P.; Kumaran, M.K.; Rousseau, M.Z.; Tariku, F.; van Reenen, D.; Dalgliesh, W.A. 2003. Applica-tion of hygrothermal analyses to optimise exterior wall de-sign. 2nd International Conference on Research in Building
Physics Leuven, Belgium, pp. 417-426, September 01,
2003
Salonvaara, M.H. & Karagiozis, A.N. 1994. Moisture transport in building envelopes using an approximate factorization solution method. Second Annual Conference of the CFD
Society of Canada. Toronto, Canada, pp. 317-326, 1994
Tariku, F. & Kumaran, K. 2002 Experimental and Analytical Investigations on the Drying Process Undergone by Aer-ated Concrete, A Thermal and Moisture Transport Property
Database for Common Building and Insulating Materials, Appendix II Final Report from ASHRAE Research Project
1018-RP
http://resourcecenter.ashrae.org/store/ashrae/newstore.cgi?i temid=8222&view=item&categoryid=177&categoryparent =177&page=1&loginid=4469
Trechsel, H.R. (editor) 2001. Moisture Analysis and Condensa-tion Control in Building Envelopes. American Society for Testing and Materials (ASTM). MNL40. West Consho-hocken, PA, USA
Zarr. R.R., Burch, D.M., Fanney, A.H. 1995. Heat ans mois-ture transfer in wood-based wall constraction: Measured vs. Predicted. Building Science Series 173, National Institute of Standards and Technology.