HAL Id: hal-02863202
https://hal.archives-ouvertes.fr/hal-02863202
Preprint submitted on 10 Jun 2020HAL is a multi-disciplinary open access archive for the deposit and dissemination of sci-entific research documents, whether they are pub-lished or not. The documents may come from teaching and research institutions in France or abroad, or from public or private research centers.
L’archive ouverte pluridisciplinaire HAL, est destinée au dépôt et à la diffusion de documents scientifiques de niveau recherche, publiés ou non, émanant des établissements d’enseignement et de recherche français ou étrangers, des laboratoires publics ou privés.
Phenotypic plasticity versus local adaptation to explain
drought-resistance under elevated temperature at
seedling stage in native and invasive populations of a
shrub (Ulex europeaus, L.)
Mathias Christina, Celine Gire, Mark Bakker, Alan Leckie, Jianming Xue, W
Clinton, Zaira Negrin-Perez, José Ramon Arevalo Sierra, Arevalo Sierra,
Jean-Christophe Domec, et al.
To cite this version:
Mathias Christina, Celine Gire, Mark Bakker, Alan Leckie, Jianming Xue, et al.. Phenotypic plasticity versus local adaptation to explain drought-resistance under elevated temperature at seedling stage in native and invasive populations of a shrub (Ulex europeaus, L.). 2020. �hal-02863202�
Christina et al., preprint 2020
1
Phenotypic plasticity versus local adaptation to explain drought-resistance under
1
elevated temperature at seedling stage in native and invasive populations of a shrub
2
(Ulex europeaus, L.)
3
4
Mathias Christina a,b, Céline Gire a,c, Mark R. Bakker a,c, Alan Leckied, Jianming Xued, Peter
5
W. Clintond, Zaira Negrin-Pereze, José Ramon Arevalo Sierrae, Jean-Christophe Domec a,c,
6
Maya Gonzalez a,c
7
8
9
10
a INRA, UMR 1391 ISPA, CS20032, 33882 Villenave d’Ornon cedex, France.
11
b CIRAD, UPR 115 AIDA, 97490 Saint-Clotilde, La Reunion.
12
c Bordeaux Sciences Agro, UMR 1391 ISPA, Gradignan F-33883, France.
13
d SCION Institute, 8011 Christchurch, New Zealand.
14
e Department of Botany, Ecology and Plant Physiology, University of La Laguna, 38206 La
15
Laguna.
16
17
18
* Corresponding author: mathias.christina@cirad.fr
19
20
21
22
23
Christina et al., preprint 2020
2
Abstract
24
1. The assumption that climatic requirements of invasive species are conserved between
25
their native and non-native environment is a key ecological issue in the evaluation of
26
risk of invasion. We conducted a growth chamber experiment to compare climatic
27
requirements between native and introduced populations of common gorse (Ulex
28
europeaus, L.) seedlings, an invasive evergreen shrub.
29
2. Seeds were sampled from 20 populations from 5 areas from both native (France,
30
Spain) and non-native areas (New Zealand, Canary and Reunion islands). The
31
seedlings were grown over 36 days in two temperature treatments (ambient, at 24 °C
32
and elevated, at 30 °C in average) combined with two water treatments (irrigated or
33
watering withheld). Temperature treatments were defined after assessing the niche
34
temperature of the species in the different countries, and the elevated temperature was
35
defined as the highest temperature at the niche margin.
36
3. Invasive populations were more drought resistant and performant at high temperature
37
than native ones. Under elevated temperature and drought, native populations showed
38
a greater mortality rate (53%) than invasive populations (16%) after 36-days of growth.
39
Invasive seedlings also showed a higher aerial and roots development than native ones
40
under this constrain climate. The difference between populations in mortality could be
41
explained by difference in phenotypic plasticity at the population level (e.g. specific root
42
length - SRL) and local adaptation to the environment of origin (average temperature).
43
The difference in growth in height and root area was also correlated with phenotypic
44
plasticity (SRL and above to belowground ratio, respectively) and the climate of origin
45
(precipitation of the warmest quarter and temperature of the driest quarter,
46
respectively).
47
4. Assessing the importance of phenotypic divergences and plasticity of invasive species
48
at the margins of their climatic distribution range is a key step to highlight where
49
management efforts should be concentrated once the species is naturalized in order to
50
limit and prevent its spread.
51
52
Keywords: invasion ecology; alien plants; drought; climatic niche; establishment; growth
53
chamber; species invasion;
54
55
56
57
58
59
60
61
62
63
64
65
66
67
68
69
Christina et al., preprint 2020
3
1. Introduction
70
Biological invasion is a major economical and environmental ecosystem threat that is currently
71
enhanced by global change (Vitousek et al. 1996; Andersen et al. 2004), and the invasion of
72
islands by plant species is a serious threat to endemic species (Caujapé-Castells et al. 2010).
73
For the efficient allocation of management resources, we need to understand which factors
74
limit or prevent their establishment and spread, to therefore characterize the species’
75
ecological niche.
76
77
The assumption that climatic requirements of invasive species are conserved between their
78
native and invaded environment is a key issue in the assessment of invasive risk (Pearman et
79
al., 2008). However, this assumption is not well supported. For example, evidence of climatic
80
niche shifts has been shown for specific invasive plants (Gallagher et al., 2010; Broennimann
81
et al., 2007; Hernandez-Lambraño et al., 2016) but a review concluded that ~85% of terrestrial
82
invasive plants would not be able to shift their climatic niche (Petitpierre et al. 2012).
83
Nevertheless, Webber et al (2012) disagreed with this statement and suggested that niche
84
conservation for invasive species would be the exception rather than the rule. Assessing the
85
climatic niche in native and invasive environments of invasive plants is a key step to limit their
86
establishment as anticipation appears as the most efficient management strategy (Leung et al.
87
2002). Moreover, detecting climatic niche shifts due to evolutionary changes in invasive plants
88
(Lavergne and Molofsky 2007) is crucial under rapid climate change.
89
90
Invasive species often present rapid evolution (Buswell et al., 2011) and a high genetic
91
plasticity thus improving species adaptation to new ecosystems (Lavergne and Molofsky,
92
2007). For those introduced species that spread across a wide distributional range, phenotypic
93
plasticity has often been proposed as an important contributor to invasion success (Davidson
94
et al. 2011). In particular, the phenotypic plasticity could improve survival rates during the initial
95
establishment in a new environment (Ghalambor et al. 2007). It is crucial to assess the
96
importance of phenotypic plasticity in response to climate, in particular how this would enable
97
an invasive plant species to colonize a wide range of habitats and elevations (Alexander et al.
98
2011) and could allow such a species to occupy ecosystems outside its native climatic niche
99
(Sexton et al., 2002). Additionally, rapid evolution of invasive species could promote local
100
adaptation and facilitate range expansion of invasive plants (Colautti and Barret, 2013).
101
Nevertheless, there still debate on the relative importance of local adaptation of invasive
102
species in comparison to native ones (Oduor et al., 2016) as process of local adaptation was
103
not necessary the rule for all species (Li et al., 2015; Wallendael et al., 2018).
104
105
A new plant species introduced outside its native range has to cross several barriers before
106
becoming an invader (Richardson et al. 2000; Blackburn et al. 2011). An initial stage is the
107
establishment (survival) of young introduced individuals, which is strongly influenced by abiotic
108
conditions. Many studies pointed out that seedling establishment is restricted by climatic
109
conditions such as temperature, water availability or light (Danner and Knapp 2003, Kellman
110
2004, Hou et al. 2014, Leiblein-Wild et al. 2014, Nguyen et al. 2016), particularly for
high-111
elevation ecosystems (Arévalo et al., 2010, Tecco et al. 2016). Yet, few have dealt with the
112
influence of abiotic factors on seedling establishment at the margin of its climatic niche (e.g.
113
Kellman 2004, Laube et al. 2015). In addition to the increase in mean annual temperatures,
114
extreme temperature frequencies are predicted to become more frequent under future climate
115
Christina et al., preprint 2020
4
scenarios (Katz and Brown 1992; Wagner 1996; IPCC 2014). These extreme events are likely116
to cause dramatic change to ecological communities (Diez et al. 2012). Therefore, a better
117
understanding of the effect of extreme temperature changes on plant invasion is needed.
118
119
In this study, we tested the tolerance of an invasive shrub (common gorse, Ulex europaeus)
120
to two imposed abiotic factors (temperature and water availability) at the margin of its observed
121
climatic niche. Gorse is a particularly interesting model species as it is among the 30 most
122
invasive plant species worldwide (IUCN) at latitudes ranging from 54°S to 60°N and at altitudes
123
ranging from sea level to 3,550 m asl. (Hornoy et al., 2013). Its world-scale distribution
124
suggests a potentially broad niche with respect to climatic variables (particularly temperature)
125
with a compensatory phenomenon with soil water content and atmospheric humidity (e.g.
126
gorse is only present at high altitude for lower latitudes). Recent modeling studies suggested
127
that the climatic niche of introduced populations changed in comparison to native populations
128
in North America, South America and North Europe (Christina et al., 2019, Hernandez-
129
Lambraño et al., 2016).
130
131
The main objective of this study was to assess gorse seedling tolerance to abiotic factors
132
(temperature and water availability) at the margin of its observed climatic niche. The
133
hypotheses were that:
134
i) Invasive gorse seedlings were more performant to elevated temperature and low
135
soil humidity than native ones,
136
ii) The difference of performance among gorse populations could be explained by
137
phenotypic divergence in terms of individual traits,
138
iii) The difference of performance among gorse populations results from both
139
difference in phenotypic plasticity and local adaptation to the climate of origin.
140
141
142
143
144
145
146
147
148
149
150
151
152
153
154
155
156
157
158
159
160
161
Christina et al., preprint 2020
5
2. Materials and Methods
162
163
2.1. Assessing the temperature niche of Ulex europaeus in studied countries
164
Ulex europaeus, L. (gorse) native populations from France and Spain and invasive populations
165
from Canary, Reunion Islands and New Zealand were used in this study (Table 1). Prior to the
166
experiment, the climatic niche of gorse was assessed in each country. Localization of gorse
167
populations was performed in a previous study using various internet network, field
168
reconnaissance and literature search (Christina et al., 2019). In total, 2627, 1068, 5, 1005 and
169
457 gorse populations were located in France, Spain, Canary, Reunion islands and New
170
Zealand, respectively. These data were then transformed to a 5 arc min (~10 km) grid of gorse
171
presence and matched with WordClim bioclimatic variables (5 arc min, worldclim.org, version
172
1.4, Hijmans et al., 2005). We used the WorldClim bioclimatic variables to define two
173
temperature ranges, one ambient temperature corresponding to an average temperature
174
where gorse was present and one elevated temperature corresponding to a temperature at the
175
margin of the temperature tolerance of gorse. Climatic data were presented using a beanplot
176
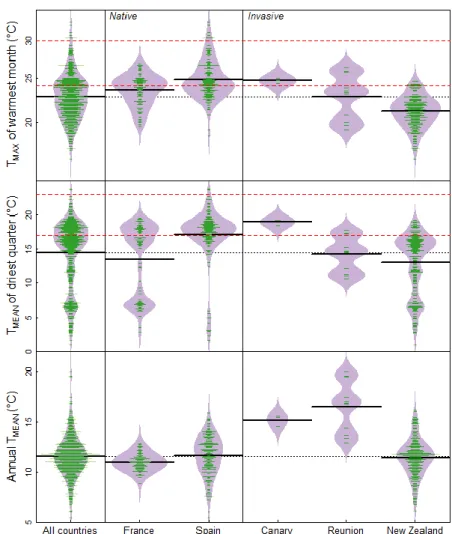
(Kampstra, 2008) based on a normal density function (Fig. 1).
177
178
179
Fig. 1. WorldClim climatic data where Ulex europaeus is present in the different studied countries
180
(maximum temperature of the warmest month, mean temperature or driest quarter and annual mean
181
temperature) from 1960 to 1990. Data are presented using a beanplot with median (black line), normal
182
density (purple background) and populations (green lines). The red dashed lines represent the values
183
used to define the elevated and ambient temperature in the growth chamber experiment. The black
184
dashed lines represent the median values of all five countries.
185
Christina et al., preprint 2020
6
2.2. Studied populations
186
Seeds were sampled from 20 populations from five countries and altitude ranging from sea
187
level to 2000 m asl. Names and location of populations are presented in supplementary
188
information (Table 1). Eleven populations were considered as natives (seven from France and
189
four from Spain) and nine populations sampled in non-native ecosystems (five from Reunion
190
Island, three from New Zealand and one from Canary Island). In each population, 50 pods on
191
20 different individuals were sampled during the reproductive period. Only mature brown pods
192
were collected. The seeds were stored in the pods at 4ºC until required. The seeds were
193
carefully examined to exclude any seeds that had been attacked by insects.
194
195
196
197
198
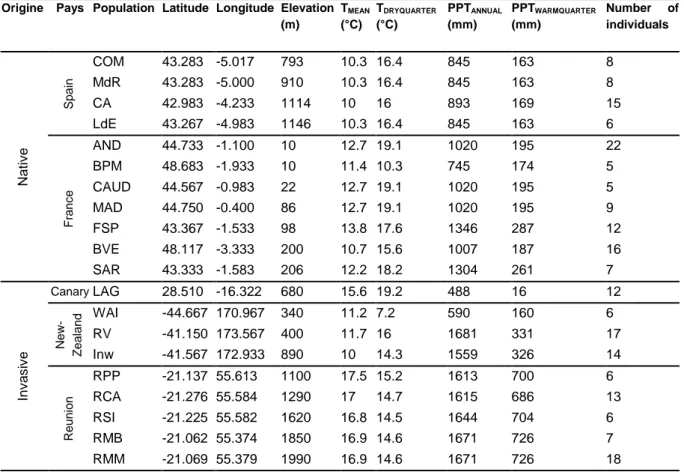
Table 1.Gorse (Ulex europaeus) source population information. Climatic data at each location
199
were obtained from WorldClim: mean annual temperature (TMEAN), temperature of the driest
200
quarter (TDRYQUARTER), annual precipitation (PPTANNUAL) and precipitation of the warmest quarter
201
(PPTWARMQUARTER).
202
203
Origine Pays Population Latitude Longitude Elevation (m) TMEAN (°C) TDRYQUARTER (°C) PPTANNUAL (mm) PPTWARMQUARTER (mm) Number of individuals Nat iv e S p a in COM 43.283 -5.017 793 10.3 16.4 845 163 8 MdR 43.283 -5.000 910 10.3 16.4 845 163 8 CA 42.983 -4.233 1114 10 16 893 169 15 LdE 43.267 -4.983 1146 10.3 16.4 845 163 6 Fr a n c e AND 44.733 -1.100 10 12.7 19.1 1020 195 22 BPM 48.683 -1.933 10 11.4 10.3 745 174 5 CAUD 44.567 -0.983 22 12.7 19.1 1020 195 5 MAD 44.750 -0.400 86 12.7 19.1 1020 195 9 FSP 43.367 -1.533 98 13.8 17.6 1346 287 12 BVE 48.117 -3.333 200 10.7 15.6 1007 187 16 SAR 43.333 -1.583 206 12.2 18.2 1304 261 7 In v a s iv e Canary LAG 28.510 -16.322 680 15.6 19.2 488 16 12 N e w -Zea lan d WAI -44.667 170.967 340 11.2 7.2 590 160 6 RV -41.150 173.567 400 11.7 16 1681 331 17 Inw -41.567 172.933 890 10 14.3 1559 326 14 R e u n ion RPP -21.137 55.613 1100 17.5 15.2 1613 700 6 RCA -21.276 55.584 1290 17 14.7 1615 686 13 RSI -21.225 55.582 1620 16.8 14.5 1644 704 6 RMB -21.062 55.374 1850 16.9 14.6 1671 726 7 RMM -21.069 55.379 1990 16.9 14.6 1671 726 18
204
205
206
207
208
209
210
Christina et al., preprint 2020
7
2.3. Seed germination
211
All equipment was sterilized in an autoclave and sterile water was used. To further minimize
212
the risk of infestation by fungi and bacteria, seed samples were washed in 2.5% sodium
213
hypochlorite (NaOCl) for 10 min and then rinsed during 5 min. Seeds were then scarified using
214
sulfuric acid (Sixtus et al. 2003). Two volumes of acid to one volume of seeds were used.
215
Seeds were placed in sulfuric acid for 3h and then washed in sterile water. After rinsing the
216
seeds were placed in petri dishes at 15°C until germination (~2 weeks). Petri dishes were
217
regularly humidified.
218
After germination, seeds were planted at 2 cm depth in individual pots (10 cm depth) and grown
219
in a greenhouse. The soil used in pots was a typical acid sandy soil representative of southern
220
France soil where native gorse grows (Dry morrland: 5.9 - 12.7 mg C g-1, 0.40 - 0.67 mg N g
-221
1, 0.026 - 0.030 mg PTOT g-1, 0.13 - 0.19 mg OxAl g-1, 0.08 - 0.15 mg OxFe g-1). At the end of
222
the growing period, 220 homogeneous seedlings were chosen for the experiment and
223
assigned to the four treatments (76 from seven populations in France; 40 from five populations
224
in Spain; 12 from one population in Canary Islands; 52 from six populations in Reunion Island
225
and 40 from five populations in New Zealand). In each country, seedlings were chosen in
226
different populations to take into account phenotypic variability within studied areas. These
227
seedlings were pooled by country and population belonging (native vs. invasive) in the
228
following analyses. In the rest of the paper we will use the term “native population” or “invasive
229
population” for these pools of individuals.
230
231
2.4. Temperature and watering treatment definitions
232
For each treatment, we defined a maximum daily temperature using the WorldClim maximum
233
daily temperature of the warmest month, and an average daily temperature using the
234
WorldClim daily mean temperature of the driest quarter (Fig. 1) as the interaction between two
235
environmental variables, temperature and watering was tested. We used two phytotrons
236
(growth chambers) in this study to separate elevated and ambient temperature treatments. In
237
each phytotron the daily period was separated in four periods : night period with PAR=0 (TNIGHT,
238
12h), morning and afternoon periods with mean temperature (TMEAN, PAR≈100 µmol m-2 s-1,
239
each one 3h) and a high temperature period at midday (TMAX, PAR≈100 µmol m-2 s-1, 6h). The
240
night temperature was set to have the same temperature diurnal range between the two
241
treatments. In conclusion, the two treatments were defined as follows :
242
- Phytotron ambient : TMAX = 24°C, TMEAN = 17°C, TNIGHT = 10°C
243
- Phytotron elevated : TMAX = 30°C, TMEAN = 23°C, TNIGHT = 16°C
244
245
In each phytotron, relative humidity was adjusted to have similar non-limiting (low enough)
246
vapour pressure deficit (VPD) during the daytime. Consequently, relative humidity in the
247
phytotron with elevated temperature was set to 74% during the night and 70% during the day,
248
corresponding to VPDNIGHT = 0.41, VPDMEAN = 0.7 and VPDMAX = 1.01 kPa periods. In the
249
phytotron with ambient temperature, relative humidity was set to 74% during the night and 60%
250
during the day, corresponding to VPDNIGHT = 0.29, VPDMEAN = 0.67 and VPDMAX = 0.98 kPa
251
periods.
252
Finally, in each phytotron two treatments of watering were defined: a watered treatment where
253
pots were watered with 20 mL of water three times a week to maintain soil saturated (wet
254
treatment); and a drought treatment where pots were not watered over the 36-days period of
255
the experiment (dry treatment).
256
Christina et al., preprint 2020
8
2.5. Seedling growth and acclimation
257
As described above, four treatments were applied using two phytotrons (ambient temperature,
258
wet and dry in phytotron #1, elevated temperature, wet and dry in phytotron #2). In this
259
experimental design, due to a limited number of available phytotron, the temperature treatment
260
was nested to a “phytotron treatment”. Nevertheless, as other climatic factors (PAR, VPD)
261
were controlled and similar between phytotrons, we assumed that this design was adequate
262
to test the temperature effect. At the beginning, both phytotrons started with the ambient
263
temperature setting and all seedlings were watered. During the first 10 days, temperature of
264
the phytotron #2 increased gradually to reach the elevated temperature treatment. At the end
265
of this temperature/watering acclimation period, and thus at the beginning of the experiment,
266
seedlings heights were similar (p value = 0.59) among all native and invasive populations (Fig.
267
S1), and were around 19 mm. Watering treatments started after this acclimation period and
268
were maintained over 36 days.
269
270
2.6. Measurements
271
At the end of the 36-days period, various plant traits were measured at the individual level
272
(Table 2). Based on Violle et al. (2007) we defined two types of traits: performance and
273
functional traits. Performance traits were measurements of individual fitness (vegetative
274
biomass; plant survival) extended to traits linked to the plant growth (height, leaf area, roots
275
length and areas). Functional traits were defined as traits which impacts fitness indirectly via
276
its effects on growth. Plant height was defined as the height up the apex. Considering plant
277
organs, stem, leaves/spines and roots were separated manually for each individual. Then,
278
fresh roots and leaves were scanned (400 dpi). Leaf area was calculated using the ImageJ
279
software (Schneider et al. 2012) while total root length, area and average roots diameter were
280
calculated using the Winrhizo software (Arsenault et al. 1995). Stem, roots and leaves were
281
then dried at 65°C for three days and weighed to obtain the dry weights. Contrary to plant
282
traits, mortality rate was calculated at the population level.
283
284
285
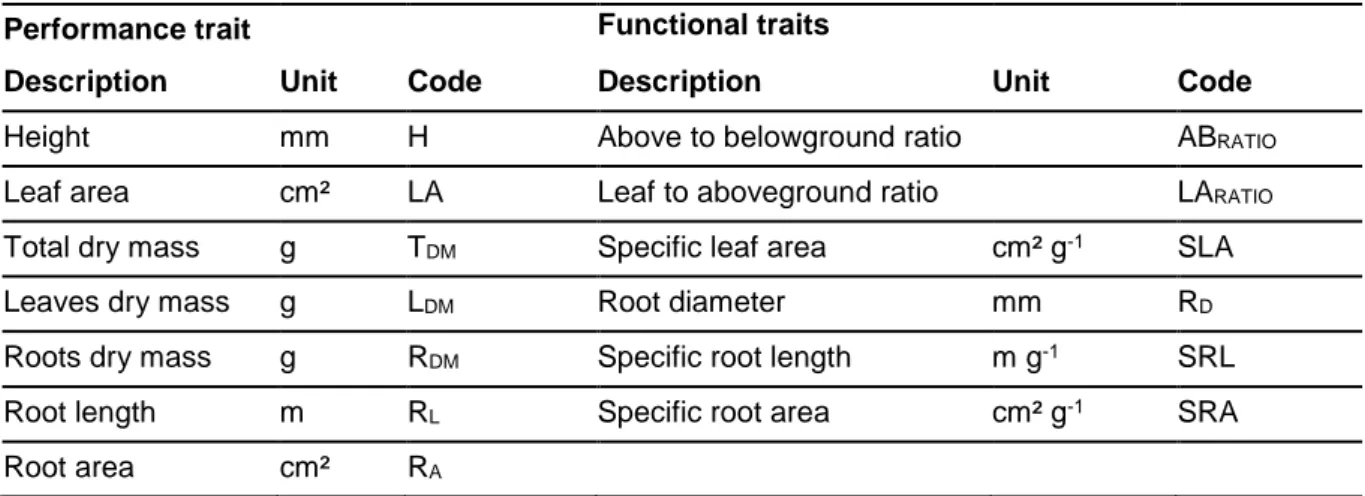
Table 2. Plant traits definition measured in this study. All traits were measured at the individual
286
levels.
287
Performance trait Functional traits
Description Unit Code Description Unit Code
Height mm H Above to belowground ratio ABRATIO
Leaf area cm² LA Leaf to aboveground ratio LARATIO
Total dry mass g TDM Specific leaf area cm² g-1 SLA
Leaves dry mass g LDM Root diameter mm RD
Roots dry mass g RDM Specific root length m g-1 SRL
Root length m RL Specific root area cm² g-1 SRA
Root area cm² RA
288
289
290
291
Christina et al., preprint 2020
9
2.7. Data analyses
292
The effects of temperature (T24, T30), watering treatment (wet, dry), population belonging
293
(native or invasive) and their interaction on H, LA, TDM, LDM, RDM, RL, RA, ABRATIO,LARATIO, RD,
294
SLA, SRL and SRA were tested using a linear mixed-effect model of variance (lmer function
295
from lme4 R package). All traits were log-transformed prior to analysis to satisfy assumption
296
of normality. The main general linear model included the following fixed effects: origin (Inv/Nat),
297
growth temperature (T), watering treatment (W) and their interaction. Random, nested effects
298
were used in calculating fixed effects F ratios: population (P) was used as the error terms to
299
test the effect of Inv/Nat, TxP was used as the error terms to test the effects of T and T x
300
Inv/Nat, WxP was used as the error terms to test the effect of W and W x Inv/Nat and finally P
301
x T:W was used to test the effect of the interaction TxW and the interaction between Inv/Nat x
302
T x W:303
𝑇𝑟𝑎𝑖𝑡 ~ 𝐼𝑛𝑣𝑁𝑎𝑡 ∗ 𝑇 ∗ 𝑊 + (1|𝑃) + (𝑇|𝑃) + (𝑊|𝑃) + (𝑇: 𝑊|𝑃)304
305
Post-hoc analyses were then performed to compare invasive and native gorse. The
306
comparison of mortality rate of invasive and native populations was performed using a non
307
parametric dunn test (dunn.test function from dunn.test package). Comparison of
log-308
transformed traits of native and invasive seedlings were performed using the t.test function.
309
Correlation between individual performance traits and functional traits was assessed using a
310
spearman correlation coefficient (cor.test function).
311
Based on one index from Vallardes et al., 2006, we assessed the phenotypic plasticity of
312
functional traits at the population level:
313
𝑃𝐼 − 𝑡𝑟𝑎𝑖𝑡 = 𝜎(𝑀𝑒(𝑡𝑟𝑎𝑖𝑡)) 𝑀𝑒(𝑡𝑟𝑎𝑖𝑡)
314
Where 𝑀𝑒(𝑡𝑟𝑎𝑖𝑡) is the median trait of gorse seedlings in each treatment, 𝜎(𝑀𝑒(𝑡𝑟𝑎𝑖𝑡)) the
315
standard deviation of the median trait across treatments and 𝑀𝑒(𝑡𝑟𝑎𝑖𝑡) the average of the
316
median trait across treatments. Comparison of phenotypic plasticity index between native and
317
invasive populations was then performed using t.test. Correlation between average
318
performance trait at the population level and plasticity index, on one hand, and average climatic
319
factor of origin (TMEAN, TDRYQUARTER, PPTANNUAL and PPTWARMQUARTER), on the other hand, was
320
tested using spearman correlation coefficient (cor.test function). Finally, for visual purpose,
321
polynomial smooth regressions were added in the figures using the loess R function. All
322
statistical analyses were performed using R.3.6.1 (R Development Core Team 2019).
323
324
325
326
327
328
329
330
331
332
333
334
335
Christina et al., preprint 2020
10
3. Results
336
337
3.1. Gorse niche temperature
338
Gorse niche temperature differed considering the countries of origin (Fig. 1). In terms of annual
339
mean temperature, the warmest areas occupied by gorse were found in invasive areas in
340
Canary and Reunion Island, but invasive populations from New Zealand occupied areas with
341
similar temperature to native populations (France and Spain). During dry seasons warmest
342
areas occupied by gorse could be found in both native (Spain and France) and invasive
343
(Canary Island) areas. Additionally, the maximum daily temperatures were observed in native
344
areas in Spain.345
346
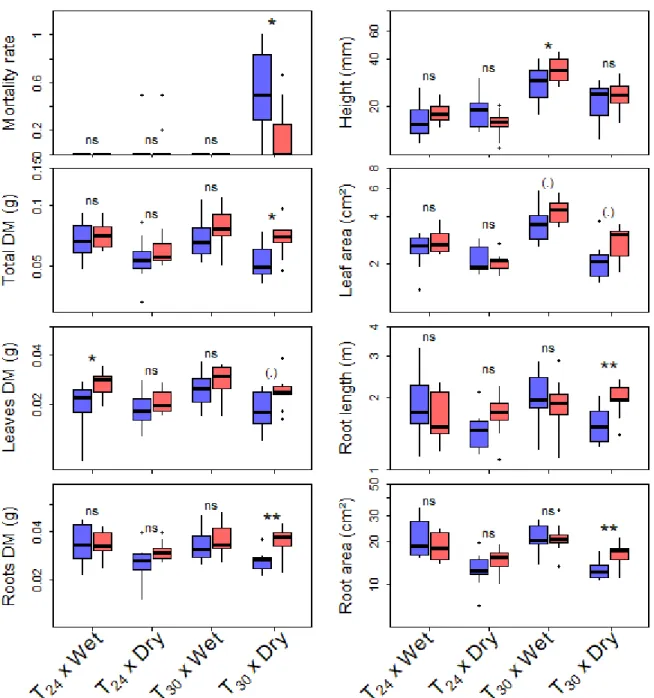
3.2. Gorse performance347
Mortality rate at the population levels and performance traits of gorse seedlings were
348
influenced by air temperature, watering levels and population belonging (native vs invasive,
349
Table 3). Under ambient (T24) temperature or watered treatments mortality rate was almost
350
null while it reached 36% in average under T30 x dry treatments (Fig. 2). Within this treatment,
351
mortality rate of native populations (53%) was higher than invasive populations (16%) in
352
average. The populations with the lowest mortality rates were found in Canary (0%) and
353
Reunion island (5%, Table S1) while mortality rate was similar among native populations
354
(53%).
355
Considering performance traits, all traits were significantly influenced by watering level
356
(Table 3) and H and LA were additionally influenced by temperature. Moreover, TDM and LDM
357
were influenced by the native vs invasive origin of the populations, as well as RL and RA by the
358
interaction between watering level and origin (Table 3). Among the T30 x wet treatment invasive
359
seedlings showed a higher H and LA by 17 and 24%, respectively, than native seedlings
360
(Fig. 2). Similarly, among the T30 x dry treatment, invasive seedlings had a higher TDM, RDM, RL
361
and RA than native seedlings by 41, 39, 30 and 42% in average. In this treatment, the seedlings
362
with the highest plant height and biomass were found in Canary (Table S1).
363
364
365
366
367
368
369
370
371
372
373
374
375
376
377
378
379
380
381
Christina et al., preprint 2020
11
Table 3. Effect of air temperature (T, ambient vs elevated), watering levels (W, wet vs dry),
382
population belonging (native or invasive, Inv/Nat) and their interaction on gorse traits measured
383
in the growth chamber experiment and described in Table 2. Variance (F) analyses were
384
performed using a linear mixed-effect model. P values were abbreviated as (.), *, **, *** when
385
lower than 0.1, 0.05, 0.01,0.001, respectively.
386
387
Inv/Nat T W T x W Inv/Nat x T Inv/Nat x W Inv/Nat x T x W Performance traits H F=3.9 (.) F=60.5 *** F=11.7 ** F=9.4 ** F=3.2 (.) F=1.6 F=0.2 LA F=3.6 (.) F=14.6 ** F=57.6 *** F=3.7 (.) F=2.4 F=0.7 F=1.0 TDM F=9.6 ** F=0.5 F=22.5 *** F<0.1 F<0.1 F=0.1 F=0.3 LDM F=8.0 * F=1. 0 F=16.5 *** F<0.1 F<0.1 F=0.4 F=0.7 RDM F=3.8 (.) F=0.2 F=8.6 ** F=0.3 F=0.6 F=3.0 (.) F=0.4 RL F=0.3 F=2.8 F=9.1 ** F=0.3 F<0.1 F=8.1 ** F=0.2 RA F=2.1 F=0.4 F=60.4 *** F<0.1 F=0.4 F=6.9 * F=0.2 Functional traits ABRATIO F=1.2 F<0.1 F=8.0 ** F=0.8 F=0.2 F=5.3 * F<0.1 LARATIO F=0.6 F=3.9 (.) F=2.4 F<0.1 F=0.6 F=3.1 F=1.5 SLA F=4.9 * F=72.6 *** F=30.4 *** F=9.8 ** F=9.5 ** F=0.4 F<0.1 RD F=1.0 F=24.5 *** F=187.3 *** F=6.6 * F=4.9 * F=1.0 F<0.1 SRL F=1.5 F=4.4 (.) F<0.1 F=0.1 F=0.5 F=5.3 * F=0.2 SRA F=2.4 F=0.1 F=98.3 *** F=1.5 F<0.1 F=2.8 F=0.2388
389
390
391
392
393
394
395
396
397
398
399
400
401
402
403
404
405
406
407
408
Christina et al., preprint 2020
12
409
Fig. 2. Change in seedlings mortality rate within populations and plant performance traits:
410
height, total dry, leaves and roots dry mass (DM), leaf area, root length and area, depending
411
on growth chamber treatment. T24 and T30 corresponded to the ambient and elevated
412
temperature treatments, respectively. Wet and Dry corresponded to the watering treatment.
413
Significant difference between native (blue) and invasive (red) populations are indicated by ns,
414
(.), * and ** for p value > 0.1, <0.1, <0.05 and <0.01, respectively.
415
416
417
418
419
420
421
422
423
Christina et al., preprint 2020
13
3.3. Growth functional traits
424
Across all treatments significant spearman correlation were found between mortality rate or
425
plant performance traits and functional traits (Table 4). Populations with the highest mortality
426
rate were population with the lowest RD and SRA. Nevertheless, the only difference between
427
native and invasive populations were found in the T30 x wet treatments (Fig. 3). In this
428
treatment root diameter was higher in invasive seedlings than native ones by 5% and SRA
429
was lower in invasive seedlings than native one by 5%.
430
Considering light competition traits such as height or leaf area, significant correlation were
431
found between H and ABRATIO and SLA, and between LA and ABRATIO, SLA, RD and SRA (Table
432
3). Except for SRA and RD, no difference at the individual’s levels between native and invasive
433
seedlings were found for these functional traits in the T30 treatments. Nevertheless, ABRATIO
434
was higher in invasive seedlings than native ones in the T24 x wet treatments. On the other
435
hand, SLA was lower in invasive seedlings than native ones in the T24 treatments.
436
Total dry mass was only correlated with root diameter (Table 3) which was higher in the
437
invasive seedlings than native ones in the T30 x wet treatments. While we found no correlation
438
between root dry mass and functional traits, the seedlings with the highest root area were
439
seedlings with the highest SLA, RD and SRA.
440
441
442
443
Table 4. Spearman correlation between seedlings performance traits and functional traits at
444
the individual level across all treatments. P values were abbreviated as (.), *, **, *** when lower
445
than 0.1, 0.05, 0.01,0.001, respectively. the number of individuals (n) used in the correlation
446
are indicated.
447
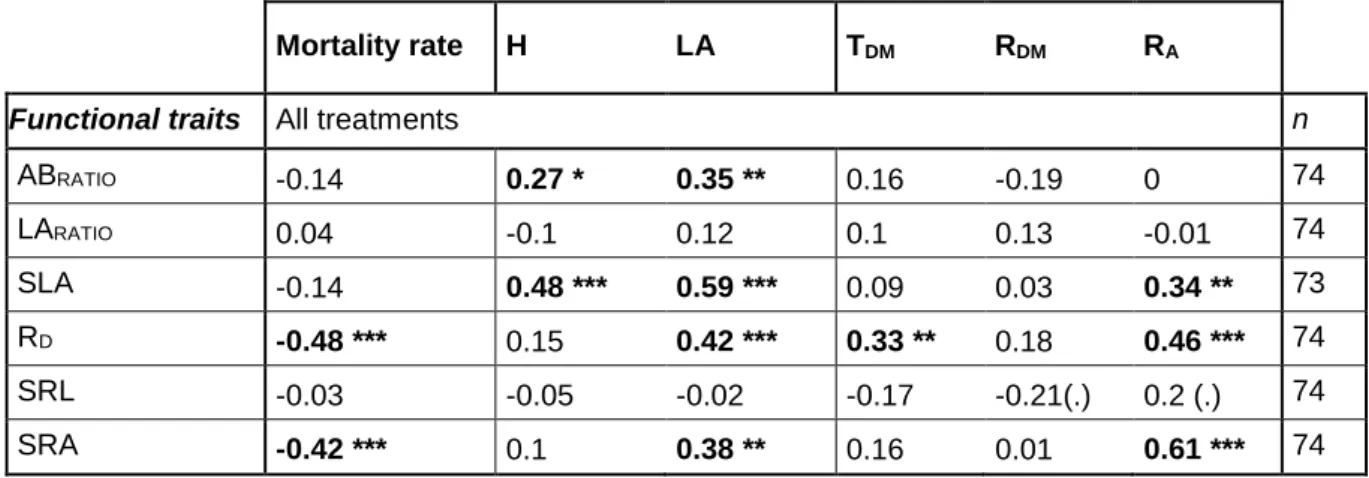
Mortality rate H LA TDM RDM RA
Functional traits All treatments n
ABRATIO -0.14 0.27 * 0.35 ** 0.16 -0.19 0 74 LARATIO 0.04 -0.1 0.12 0.1 0.13 -0.01 74 SLA -0.14 0.48 *** 0.59 *** 0.09 0.03 0.34 ** 73 RD -0.48 *** 0.15 0.42 *** 0.33 ** 0.18 0.46 *** 74 SRL -0.03 -0.05 -0.02 -0.17 -0.21(.) 0.2 (.) 74 SRA -0.42 *** 0.1 0.38 ** 0.16 0.01 0.61 *** 74
448
449
450
Christina et al., preprint 2020
14
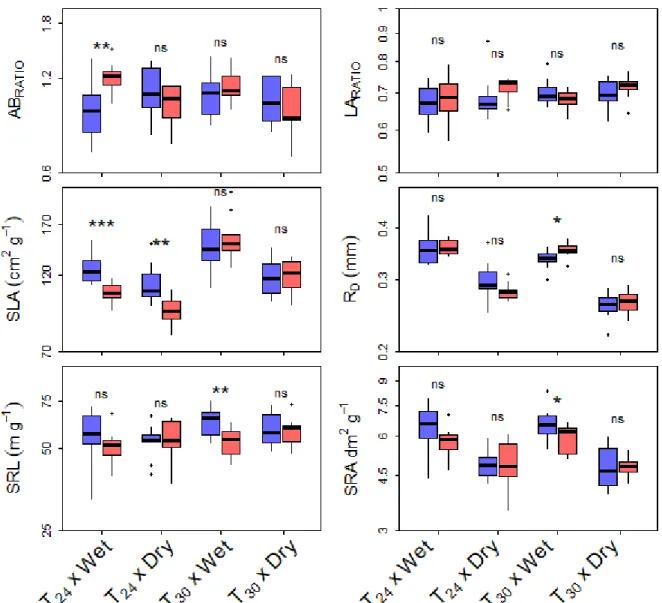
451
Fig. 3. Change in seedlings functional traits: above to belowground ratio (ABRATIO), leaf to
452
aboveground ratio (LARATIO), specific leaf area (SLA), root diameter (RD), specific root length
453
(SRL) and specific root area (SRA) depending on growth chamber treatment. T24 and T30
454
corresponded to the ambient and elevated temperature treatments, respectively. Wet and Dry
455
corresponded to the watering treatment. Significant difference between native (blue) and
456
invasive (red) populations are indicated by ns, (.), * and ** for p value > 0.1, <0.1, <0.05 and
457
<0.01, respectively.458
459
460
461
462
463
464
465
466
467
468
469
Christina et al., preprint 2020
15
3.4. Phenotypic plasticity and local adaptation
470
While no difference has been found in terms of functional traits plasticity between native and
471
invasive populations (Fig. 4), plasticity index (PI) was variable depending on population and
472
function traits. PI coefficient of variation range from 24 to 53% with the lowest variations
473
observed in RD and the highest variations in SRL. Some of these PI were correlated with
474
average performance traits at the population (Table 5). Within the T30 x wet treatment average
475
population height was correlated with PI - SRL (ρSPEAR = 0.6 *) and increased from around 25
476
mm to 45 mm (Fig. 5). Within the T30 x dry treatment, mortality rate was also significantly
477
correlated with PI – SRL (ρSPEAR = - 0.52 *) and mortality was only observed in population with
478
PI – SRL < 0.2. Finally, root area was correlated with PI – ABRATIO and increase from 10 cm²
479
to 20 cm² with increasing ABRATIO. Average seedlings performance at the population levels
480
were also correlated in some case with the climate of origin of the populations (Worldclim
481
index). In particular, mortality rate was correlated with the average daily temperature (ρSPEAR =
482
-0.45 *, Table 5). While populations located in environment with TMEAN < 14°C showed a highly
483
variable mortality, populations located in environments with TMEAN > 14°C showed almost no
484
mortality and were exclusively invasive populations (Fig. 5.). Under well-watered conditions
485
(T30 x wet), average seedlings height per populations was correlated with PPTWARMQUARTER
486
(ρSPEAR = 0.45 *, Table 5). Finally, roots area was also correlated with TDRYQUARTER (ρSPEAR =
-487
0.56 *). On the contrarty, seedlings biomass were not correlated with either plasticity index or
488
climate of origin (Table 5). For its part, leaf area showed a tendency to increase with
489
PI – ABRATIO and PI – LARATIO but the p value was only < than 0.1.
490
491
492
493
494
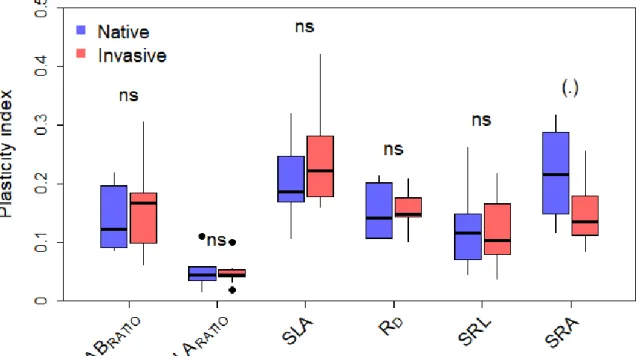
Fig 4. Functional traits plasticity index at the population levels depending of native or invasive
495
origin. Difference between origin of populations were tested using t.test and indicated as “ns”
496
and (.) when non-significant and p < 0.1, respectively. Functional traits description are given in
497
Table 2.
Christina et al., preprint 2020
16
499
500
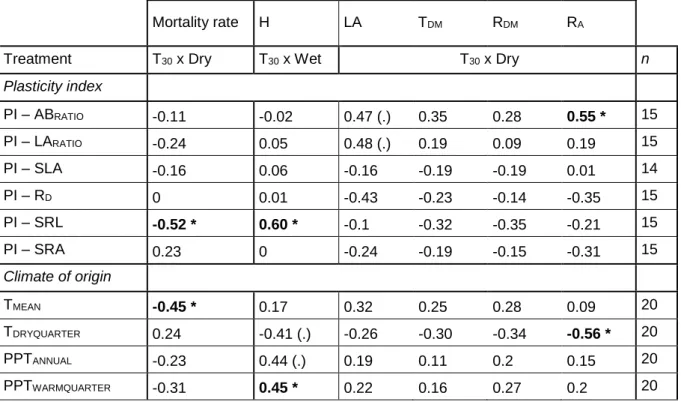
Table 5. Spearman correlation between average performance traits at the population level,
501
functional traits plasticity indices and environment of origin. P values were abbreviated as (.),
502
*, **, *** when lower than 0.1, 0.05, 0.01,0.001, respectively. The number of poluations (n)
503
used in the correlation are indicated.
504
505
Mortality rate H LA TDM RDM RA
Treatment T30 x Dry T30 x Wet T30 x Dry n Plasticity index PI – ABRATIO -0.11 -0.02 0.47 (.) 0.35 0.28 0.55 * 15 PI – LARATIO -0.24 0.05 0.48 (.) 0.19 0.09 0.19 15 PI – SLA -0.16 0.06 -0.16 -0.19 -0.19 0.01 14 PI – RD 0 0.01 -0.43 -0.23 -0.14 -0.35 15 PI – SRL -0.52 * 0.60 * -0.1 -0.32 -0.35 -0.21 15 PI – SRA 0.23 0 -0.24 -0.19 -0.15 -0.31 15 Climate of origin TMEAN -0.45 * 0.17 0.32 0.25 0.28 0.09 20 TDRYQUARTER 0.24 -0.41 (.) -0.26 -0.30 -0.34 -0.56 * 20 PPTANNUAL -0.23 0.44 (.) 0.19 0.11 0.2 0.15 20 PPTWARMQUARTER -0.31 0.45 * 0.22 0.16 0.27 0.2 20
506
507
508
509
510
511
512
513
Christina et al., preprint 2020
17
514
Fig. 5. Change in mortality rate, average seedling height and average root area at the population level
515
with phenotypic plasticity index at the population level (specific root length, PI – SRL, and above to
516
belowground ratio, PI – ABRATIO) and the average climatic data of the environment of origin (average
517
daily temperature – TMEAN, precipitation of the warmest quarter – PPTWARMQUARTER and average daily
518
temperature of the driest quarter – TDRYQUARTER). The treatment were the traits were average are
519
indicated (T24 x Wet or T30 x Dry). The spearman correlation coefficient are given (ρSPEAR) and
520
significant correlation (p < 0.05) are indicated by *. A polynomial smooth regression on all populations
521
was added for visual purpose. As an indication, native and invasive populations are indicated by blue
522
and red points, respectively.
523
524
525
526
527
528
529
Christina et al., preprint 2020
18
4. Discussion
530
531
4.1. Establishment and temperature barrier at the climatic niche margin
532
Assessing whether the environmental niche of a species may change between different
533
geographical areas or time periods is extremely important for predicting the spread of invasive
534
species in the context of ongoing climate change (Alexander and Edwards 2010; Guisan et al.
535
2014; Gonzalez-Moreno et al. 2015). During the invasion process, an introduced population
536
can fail to establish because individuals in the population do not survive or cannot reproduce.
537
Such failure could result from factors associated with the species (e.g. reproductive rate or
538
specialist species), the location (e.g. presence of enemies or absence of mutualists),
539
stochastic features of the individual introduction event (especially propagule pressure) or, often
540
their interaction. Despite having different responses to extreme temperatures, the tolerance to
541
temperature stress might be critical for germination and survival of seedlings of invasive plants.
542
While rising global temperatures might facilitate the survival and reproduction of invasive
543
species in regions where they could not have existed before (Walther et al. 2009), extreme
544
temperatures events can reduce invasive plant competitiveness if conditions become
545
unsuitable (Hellmann et al. 2008).
546
The results described in this study suggest that the temperature tolerance at the thermal niche
547
margin may change between native and invasive populations, depending on their adaptation
548
to different climatic habitats and interaction with other abiotic factors (such as water
549
availability). As an example, the mortality rate of gorse under combined elevated temperature
550
and drought was higher for native seedlings that invasive seedlings (except for seedlings from
551
New Zealand, Table S1, featuring a climate similar to that in the native areas). A similar pattern
552
was observed in a greenhouse experiment with Ulmus pumila seedlings (Hirsch et al., 2016),
553
where mortality rate of seedlings from native populations from China was greater than of those
554
from non-native populations from Argentina and the U.S.A under various watering and
555
temperature treatments. Change in gorse seedlings thermal and drought tolerance between
556
invasive and native populations may be factors explaining the climatic niche shift observed at
557
the global scale by Christina et al. (2019) and the niche expansion of this species in South
558
America (Hernandez-Lambraño et al., 2016).
559
560
4.2. Phenotypic divergence and seedling performance
561
Among the most influential hypotheses about plant invasion, the Evolution of Increased
562
Competitive Ability hypothesis (EICA) states that, in the absence of enemies, exotic plants
563
evolve in the allocation of resources, from defense to reproduction or to growth (Blossey and
564
Notzold 1995). This increase in vegetative growth and/or reproductive effort, for some species,
565
would result in a better competitive ability of the invasive species in the introduced ranges (Zou
566
et al., 2007; Ordonez et al., 2010; Heberling et al., 2016). In terms of vegetative growth, our
567
study showed a greater height growth rate for invasive gorse populations than native
568
populations in the early phases of the invasive process (seedlings establishment) under
569
optimal conditions (warm and wet). This observation is in accordance with previous studies
570
showing an increase in vegetative growth (Hornoy et al., 2011) and reproductive effort (Udo et
571
al., 2017) in introduced Ulex europaeus populations compared to native ones.
572
The better performance of gorse seedlings from invasive populations in extreme environments
573
may result from phenotypic divergence with native populations. For example, while in our study
574
root biomass of seedlings from native populations decreased due to drought, invasive
575
Christina et al., preprint 2020
19
seedlings succeeded into maintaining their root biomass under drought, which could explain576
the greater drought resistance of invasive compared to native populations. Accordingly,
577
seedlings populations with the lowest mortality were populations with the highest RD and SRA.
578
In another study, Song et al. (2010) focused on the impact of extreme high temperatures on
579
Wedelia seedlings. They found that invasive Wedelia (Sphagneticola sp. Asteraceae) suffered
580
less inhibition in terms of growth rates due to high temperature than the native Wedelia, which
581
was consistent with the change of photosystem II activity and efficiency, as well as net
582
photosynthetic rate between native and invasive seedlings. Similarly, focusing on cellular
583
photosynthetic metabolism, Duarte et al. (2016) showed that Sphagneticola maritima (native
584
in Western Europe marshes) and S. patens (American species invasive in Western Europe)
585
have a different thermal tolerance. Accordingly, many studies support that rising temperatures
586
may increase the risk of invasion (Bradley et al. 2010; Verlinden and Nijs 2010; Wang et al.
587
2011), which seems to be in contradiction with a meta-analysis showing that native and
non-588
native plants largely respond similarly to climate manipulations (Sorte et al. 2013).
589
Nevertheless, this meta-analysis reports very few plant studies in which extreme temperatures
590
were manipulated.
591
592
4.3. Phenotypic plasticity during seedling stage
593
Invasive species often present phenotypic plasticity that improves species adaptation to new
594
ecosystems (Lavergne and Molofsky, 2007) which could therefore be an important contributor
595
to invasion success (Davidson et al. 2011). The phenotypic plasticity could improve survival
596
rates during the initial establishment in a new environment (Ghalambor et al. 2007). In the
597
current study, we have found no difference in phenotypic plasticity at the population level
598
between native and invasive populations, contrary to previous studies on mature gorse where
599
invasive gorses were more plastic in response to shading (Atlan et al., 2015). Nevertheless,
600
this study highlighted how populations with highest phenotypic plasticity were more
drought-601
tolerant (i.e. lower mortality). Similarly, populations with highest phenotypic plasticity in SRL or
602
ABRATIO were also population with the highest growth rate in height under optimal conditions
603
(warm and wet) and root development under dry conditions, which is crucial in terms of light,
604
water and nutrients acquisition strategies for young seedlings. Such plasticity could lead to an
605
increase in competitive ability in invasive areas.
606
It is crucial to assess the importance of phenotypic plasticity in response to climate as this
607
allows evaluating whether invasive plants could reach and colonize ecosystems outside of
608
their native climatic niche or not (Sexton et al., 2002). Many recent studies have revealed
609
phenotypic plasticity between native and invasive plants on various mechanisms such as
610
sexual and vegetative reproductions (Xu et al., 2010), fitness-related traits (photosynthetic
611
capacity, survival and growth, Molina-Montenegro et al., 2016, Martinez and Fridley, 2018),
612
and in response to abiotic factors (e.g. water availability Nguyen et al. 2016). The role played
613
by the species’ ability to cope with changing conditions will be probably most important at the
614
margins of the distribution range of the species, where management efforts should be
615
concentrated once the species is naturalized in order to prevent its spread.
616
617
618
619
620
621
Christina et al., preprint 2020
20
4.4. Local adaptation to climate
622
It has been often suggested that rapid evolution of local adaptation to novel environments may
623
enable invasive plant species to thrive across a broad range of habitats in their introduced
624
ranges (Colautti and Barrett, 2013; Buswell et al., 2011; Li et al., 2014). Unlike native plants
625
with a much longer residence time, invasive plant species typically have a relatively short
626
residence time in their introduced ranges, typically decades or just a few centuries (Pysek &
627
Jarosık 2005; Hulme 2009; Colautti & Lau 2015). Nonetheless, a meta-analysis comparing
628
native and invasive species in the same environments concluded that invasive species were
629
as adapted as the native ones (Oduor et al., 2016).
630
Considering gorse, Christina et al. (2020) highlighted how a niche shift occurred in introduced
631
areas in comparison to climatic niche of native gorse. Our results here confirmed the local
632
adaptation of invasive populations to warmer environments, which could explain their higher
633
tolerance to warm and dry environments and therefore there niche expansion in Australia,
634
North America or South Africa (Christina et al., 2020). The evolution of phenotypic traits in
635
invasive gorse populations was demonstrated in common garden experiments (Hornoy et al.,
636
2011). This evolution was facilitated by the hexaploid karyotype of the species, and by its high
637
genetic polymorphism in both native and invasive populations (Hornoy et al., 2013).
638
Considering that in the majority of introduced regions, invasion occurred since XXXs, an
639
explanation to the rapid evolution of local adaptation could result from the release of natural
640
enemies (EICA Hypothesis; Blossey and Notzold 1995; Joshi and Vrieling 2005). Indeed, the
641
specific weevil Exapion ulicis, that can eat up to 80% of the seeds in the native region, was not
642
introduced in the invaded regions as the same time as the plant (even if it was further
643
introduced in most regions for biological control). The release from this predator may have
644
relaxed the genetic constraints resulting by the complex strategies of seed predation
645
avoidance (Atlan et al., 2010), facilitated the rapid adaptation to new climate and contributed
646
to the niche expansion in introduced regions.
647
648
5. Conclusion
649
The study assessed the influence of the interaction between extreme temperature (at the niche
650
margin) and drought on establishment success (seedling survival and growth) of the invasive
651
gorse. Our results highlighted some seedlings phenotypic divergences in terms of above and
652
belowground development between native and invasive gorse, which could explain the
653
observed greater drought resistance of invasive populations at extreme temperature.
654
Population performances and survival were correlated to both local adaptation to climate as
655
well as phenotypic plasticity, even if no evidence of a higher phenotypic plasticity in invasive
656
populations than native ones has been observed. A better understanding of the phenotypic
657
divergences and plasticity between native and invasive gorse populations at the margins of
658
their climatic distribution range is a key step to highlight where management efforts should be
659
concentrated once the species is naturalized in order to prevent its spread, especially in higher
660
elevations.661
662
663
664
665
666
667
Christina et al., preprint 2020
21
Acknowledgements
668
This study was financially supported by the MARIS ANR project (Agence Nationale de la
669
Recherche, grant ANR-14-CE03-0007-01) and INRA institute (Institut National de la
670
Recherche Agronomique). We are grateful to the UMR SAVE (in particular D. Thierry, P. Rey,
671
J. Jollivet and J. Roudet) for their support with the growth chambers. We thank N. Udo (UMR
672
ECOBIO), A. Atlan (UR ESO), M. Tareyre-Renouard (UMR ECOBIO), S. Niollet and N.
673
Gallegos (UMR ISPA) for the support in collecting seeds and F. Delerue for his advice. We are
674
grateful to the Parque Nacional de los Picos de Europa (Spain) and Cabildo de Tenerife
675
(Canary Island) for their authorization to collect gorse seeds. We thank the landowners with
676
whom we have had access to their land to study and collect gorse seeds
677
678
679
680
Authors’ contributions681
CM, GM, DJC and BM conceived the ideas and designed methodology. LA, XJ, CPW, NPZ ,
682
SJRA and GC collected the seeds in the different countries and advised on the methodology.
683
CM, GM, BM and GC collected the data and CM and GM analysed them. CM and GM led the
684
writing of the manuscript. All authors contributed critically to the drafts and gave final approval
685
for publication.686
687
Data accessibility688
The data used in this study will be made freely available in the CIRAD or INRA data verse
689
during the revision process.
690
691
References
692
Alexander, J. M., & Edwards, P. J. (2010). Limits to the niche and range margins of alien
693
species. Oikos, 119(9), 1377–1386. doi: 10.1111/j.1600-0706.2009.17977.x
694
Alexander, J. M., Kueffer, C., Daehler, C. C., Edwards, P. J., Pauchard, A., Seipel, T., …
695
Walsh, N. (2011). Assembly of nonnative floras along elevational gradients explained by
696
directional ecological filtering. Proceedings of the National Academy of Sciences of the United
697
States of America, 108(2), 656–661. doi: 10.1073/pnas.1013136108
698
Andersen, M. C., Adams, H., Hope, B., & Powell, M. (2004). Risk Assessment for Invasive
699
Species. Risk Analysis, 24(4), 787–793. doi: 10.1111/j.0272-4332.2004.00478.x
700
Arévalo, J. R., Otto, R., Escudero, C., Fernández-Lugo, S., Arteaga, M., Delgado, J. D., &
701
Fernández-Palacios, J. M. (2010). Do anthropogenic corridors homogenize plant communities
702
at a local scale? A case studied in Tenerife (Canary Islands). Plant Ecology, 209(1), 23–35.
703
doi: 10.1007/s11258-009-9716-y
704
Arsenault, J.-L., Poulcur, S., Messier, C., & Guay, R. (2019). WinRHlZO™, a Root-measuring
705
System with a Unique Overlap Correction Method. HortScience, 30(4), 906D–906. doi:
706
10.21273/hortsci.30.4.906d
707
Blackburn, T. M., Pyšek, P., Bacher, S., Carlton, J. T., Duncan, R. P., Jarošík, V., …
708
Richardson, D. M. (2011). A proposed unified framework for biological invasions. Trends in
709
Ecology and Evolution, 26(7), 333–339. doi: 10.1016/j.tree.2011.03.023
710
Blossey, B., & Nötzold, R. (1995). Evolution of increased competitive ability in invasive
711
nonindigenous plants: a hypothesis. Journal of Ecology, 83(5), 887–889. doi:
712
10.2307/2261425
Christina et al., preprint 2020
22
Bradley, B. A., Wilcove, D. S., & Oppenheimer, M. (2010). Climate change increases risk of714
plant invasion in the Eastern United States. Biological Invasions, 12(6), 1855–1872. doi:
715
10.1007/s10530-009-9597-y
716
Broennimann, O., Treier, U. A., Müller-Schärer, H., Thuiller, W., Peterson, A. T., & Guisan, A.
717
(2007). Evidence of climatic niche shift during biological invasion. Ecology Letters, 10(8), 701–
718
709. doi: 10.1111/j.1461-0248.2007.01060.x
719
Buswell, J. M., Moles, A. T., & Hartley, S. (2011). Is rapid evolution common in introduced plant
720
species? Journal of Ecology, 99(1), 214–224. doi: 10.1111/j.1365-2745.2010.01759.x
721
Christina, M., Limbada, F., & Atlan, A. (2019). Climatic niche shift of an invasive shrub (Ulex
722
europaeus): a world scale comparison in native and introduced regions. 2019. ⟨hal-02146154⟩
723
Danner, B. T., & Knapp, A. K. (2003). Abiotic constraints on the establishment of Quercus
724
seedlings in grassland. Global Change Biology, 9(2), 266–275. doi:
10.1046/j.1365-725
2486.2003.00574.x
726
Davidson, A. M., Jennions, M., & Nicotra, A. B. (2011). Do invasive species show higher
727
phenotypic plasticity than native species and, if so, is it adaptive? A meta-analysis. Ecology
728
Letters, 14(4), 419–431. doi: 10.1111/j.1461-0248.2011.01596.x
729
Davidson, E., Lefebvre, P. A., Brando, P. M., Ray, D. M., Trumbore, S. E., Solorzano, L. A., …
730
Nepstad, D. C. (2011). Carbon Inputs and Water Uptake in Deep Soils of an Eastern Amazon
731
Forest. Forest Science, 57(1), 51–58. doi: https://doi.org/10.1093/forestscience/57.1.51
732
Diez, J. M., D’Antonio, C. M., Dukes, J. S., Grosholz, E. D., Olden, J. D., Sorte, C. J. B., …
733
Miller, L. P. (2012). Will extreme climatic events facilitate biological invasions? Frontiers in
734
Ecology and the Environment, 10(5), 249–257. doi: 10.1890/110137
735
Duarte, B., Marques, J. C., & Caçador, I. (2016). Ecophysiological response of native and
736
invasive Spartina species to extreme temperature events in Mediterranean marshes. Biological
737
Invasions, 18(8), 2189–2205. doi: 10.1007/s10530-015-0958-4
738
Gallagher, R. V., Beaumont, L. J., Hughes, L., & Leishman, M. R. (2010). Evidence for climatic
739
niche and biome shifts between native and novel ranges in plant species introduced to
740
Australia. Journal of Ecology, 98(4), 790–799. doi: 10.1111/j.1365-2745.2010.01677.x
741
Ghalambor, C. K., McKay, J. K., Carroll, S. P., & Reznick, D. N. (2007). Adaptive versus
non-742
adaptive phenotypic plasticity and the potential for contemporary adaptation in new
743
environments. Functional Ecology, 21(3), 394–407. doi: 10.1111/j.1365-2435.2007.01283.x
744
González-Moreno, P., Diez, J. M., Richardson, D. M., & Vilà, M. (2015). Beyond climate:
745
Disturbance niche shifts in invasive species. Global Ecology and Biogeography, 24(3), 360–
746
370. doi: 10.1111/geb.12271
747
Guisan, A., Petitpierre, B., Broennimann, O., Daehler, C., & Kueffer, C. (2014). Unifying niche
748
shift studies: Insights from biological invasions. Trends in Ecology and Evolution, 29(5), 260–
749
269. doi: 10.1016/j.tree.2014.02.009
750
Heberling, J. M., Kichey, T., Decocq, G., & Fridley, J. D. (2016). Plant functional shifts in the
751
invaded range: a test with reciprocal forest invaders of Europe and North America. Functional
752
Ecology, 30(6), 875–884. doi: 10.1111/1365-2435.12590
753
Hellmann, J. J., Byers, J. E., Bierwagen, B. G., & Dukes, J. S. (2008). Five potential
754
consequences of climate change for invasive species. Conservation Biology, 22(3), 534–543.
755
doi: 10.1111/j.1523-1739.2008.00951.x
756
Hernández-Lambraño, R. E., González-Moreno, P., & Sánchez-Agudo, J. Á. (2016). Towards
757
the top: niche expansion of Taraxacum officinale and Ulex europaeus in mountain regions of
758
South America. Austral Ecology, 42(5), 577–589. doi: 10.1111/aec.12476