All rights reserved
Use of Transition Probabilities to Estimate the Effect of Smoking on the
Duration of Episodes of Respiratory Symptoms in Diary Data
The Swiss Study on Air Pollution and Lung Diseases in Adults (SAPALDIA)
Reinhard Kaiser,1 Christian Schindler,1 Nino Kunzli,1 Ursula Ackermann-Liebrich,1 Dominik Heeb,1
Tullio C. Medici,2 Jean Pierre Zellweger,3 and the SAPALDIA Team
Incompletely documented symptom episodes pose methodological problems in the analysis of diary data. The aim of this study was to develop a method of estimating the average durations of symptomatic and nonsymptomatic episodes, respectively, coping with the problem of bias due to undocumented days and censored episodes that is found in most diary studies. The authors derived their outcome variables from a Markov model using transition probabilities. To evaluate this method, the authors assessed the impact of active smoking on the duration of episodes of bronchitis symptoms and the corresponding nonsymptomatic periods, respectively, using diary data (1992-1993) obtained from 801 participants in the Swiss Study on Air Pollution and Lung Diseases in Adults. Covariate-adjusted distribution curves for the mean durations of individual episodes were estimated by Cox regression. Median values for light smokers (<10 cigarettes/day) were 60.0 symptom-free days (95% confidence interval (Cl) 42.0-78.5) and 4.0 symptomatic days (95% Cl 3.0-6.0), respectively, compared with medians of only 21.0 days (95% Cl 16.2-29.8) for periods without bronchitis symptoms and 6.0 days (95% Cl 4.9-9.0) for episodes of bronchitis symptoms in heavy smokers (s30 cigarettes/day). The authors suggest that the Markov method is a feasible approach to the assessment of long term effects of smoking and environmental risk factors on the average duration of symptomatic and nonsymptomatic respiratory episodes. Am J Epidemiol 1998;148:600-8.
data collection; epidemiologic methods; longitudinal studies; Markov chains; respiration; smoking
Diaries in which study participants record respira-tory symptoms are known to be valuable data collec-tion instruments in air pollucollec-tion epidemiology. Such data normally consist of sets of sequences of binary outcomes, one for each symptom and participant. Short to medium term effects of air pollution on health endpoints such as symptom incidence and prevalence (1-10) and, more recently, symptom duration (11, 12) have been a major focus of diary studies. However, the use of diary data for assessment of long term associations between exposure to environmental risk factors and in-dividual respiratory health has gained less attention.
One approach is to focus on individual patterns of symptoms instead of summarizing these data over Received for publication June 9, 1997, and accepted for publi-cation February 19, 1998.
Abbreviations: Cl, confidence interval; FEV,, forced expiratory volume In 1 second; SAPALDIA, Swiss Study on Air Pollution and Lung Diseases in Adults.
11nstitute for Social and Preventive Medicine, University of Basel, Basel, Switzerland.
2 Division of Pneumology, University of Zurich, Zurich, Switzer-land.
3 Division of Pneumology, University of Lausanne, Lausanne, Switzerland.
time, as is done in time series analyses (13). The underlying hypothesis is that living in areas with high concentrations of air pollutants results in increased symptom prevalence, incidence (i.e., shorter nonsymp-tomatic periods), or duration of symptoms. The assess-ment of symptom duration poses special methodolog-ical problems because of the presence of days with missing information and the limitation of observation periods by design. If the duration of a symptomatic episode is defined as the number of consecutive days of reported symptoms (12), this implies that the epi-sode is preceded and followed by at least one day without symptoms. Using this naive approach, a symp-tomatic interval cannot be counted as a single episode if there is even one day with missing information.
Generally, there are two conflicting goals in diary studies: On the one hand, study periods should be long enough to estimate the duration of symptomatic epi-sodes accurately, and the total number of days with reported data should be large enough to detect differ-ences in the duration of symptoms between different categories of subjects. On the other hand, the compli-ance of most subjects decreases with the length of the
diary periods and the total number of diary days. In addition to the general problem of incompletely served episodes at the beginning and end of the ob-servation period, a study may be designed in such a way that subjects fill in the diaries during several intermittent time periods, which results in discontinu-ous reporting.
In the Swiss Study on Air Pollution and Lung Dis-eases in Adults (SAPALDIA), participants in the follow-up study were asked to fill in diaries during six periods of 4 weeks spread out over 2 years. To cope with the problems of missing data for some days and discontinuous reporting, we used transition probabili-ties to estimate the effects of ambient pollution on the durations of symptomatic episodes and corresponding symptom-free periods (hereafter called nonsymptom-atic episodes). Here we demonstrate the advantages and disadvantages of such an approach using the ef-fects of cigarette smoking on the individual average durations of episodes with and without bronchitis symptoms.
MATERIALS AND METHODS Study design
SAPALDIA consisted of a multicenter, population-based cross-sectional investigation (1991) with a diary study as a longitudinal component (1992-1993). It was designed to evaluate associations between air pollution and respiratory symptoms and diseases. A detailed description of the cross-sectional study has been given elsewhere (14). The eight study areas (Aarau, Basel, Davos, Geneva, Lugano, Montana, Payerne, and Wald) represented a wide range of ur-banization, altitude, air pollution, and meteorologic conditions in Switzerland. A random sample of adults aged 18-60 years was drawn from registries of the inhabitants of these areas. Successfully recruited subjects (59 percent) were interviewed with an ex-tended version of the European Respiratory Survey Questionnaire and underwent allergy and lung func-tion tests (15).
In the longitudinal portion of the study, subjects with a higher probability of reporting respiratory symptoms were oversampled to enhance the study's statistical power to detect associations between air pollution and lung diseases. Accordingly, meeting one of the following criteria assessed in the cross-sectional study was sufficient for a subject to be eligible for participation in the diary study: 1) an affirmative an-swer to at least one of a set of 10 questions on respiratory symptoms; 2) a ratio between forced expi-ratory volume in 1 second (FEVj) and forced vital capacity mat was less than 80 percent of the value
predicted by European Community Coal and Steel norms; 3) a decline in FEV, of at least 20 percent from baseline during the bronchochallenge test; and 4) sat-isfying none of the above criteria and being a non-smoker. All subjects fulfilling at least one of the first three criteria were invited to participate. The control cohort, those fulfilling the fourth criterion, was re-stricted to a random sample of 150 nonsymptomatic nonsmokers per area. Thus, all smokers in the follow-up sample were either symptomatic or hyperreactive. In each study area, the subjects invited to participate were randomly assigned to 16 groups of equal size. The 16 groups were enrolled in the study at intervals of 1 week to contribute diaries kept for 4 consecutive weeks. Each diary period was followed by a break of 12 weeks; thus, participants could complete up to six diary periods of 4 weeks during the 2 years of the follow-up study. Therefore, in each week of the follow-up study (except the weeks at the beginning or the end), four groups were filling in diaries. Random-ization of groups was done in a stratified way in order to guarantee that proportions between cohorts varied as little as possible from week to week. The partici-pation rate for the diary study was 61 percent (3,281 of 5,383 persons).
During the diary completion periods, participants had to record daily data on morbidity parameters (re-spiratory symptoms, medication use, and peak expira-tory flow) and other relevant information (time spent outdoors, absence from the study area, physical activ-ity, and number of cigarettes smoked).
We restricted our analysis to cigarette smokers. A total of 801 follow-up participants who had been iden-tified as current smokers in the cross-sectional study were still reported to be smokers during the diary study. The sample was divided into four categories by number of cigarettes smoked per day, based on cross-sectional study data (1-9, 10-19, 20-29, and >30 cigarettes/day).
Respiratory symptoms
The 1-week diaries were designed to be filled in daily in the morning and evening from Monday through Sunday. Information on some respiratory symptoms—wheezing, dyspnea, chest tightness, and cough—was requested both in the morning (for the preceding night) and in the evening. Other symp-toms—phlegm, sore throat, hoarseness, running or blocked nose, itchy or irritated eyes, and fever—had to be reported in the evening only (for the entire 24-hour period). If no symptoms were reported either in the morning or at night, a response indicating "no symptoms experienced" had to be entered.
Because bronchitis is known to be strongly associ-ated with smoking, bronchitis symptoms were selected for the analysis. They were defined as the presence of cough and/or phlegm during the day and/or at night.
Days with missing information
An absence of more than 8 hours from the study location had to be noted in the diary for that particular day. For instance, if the absence lasted for a whole weekend, the participant was asked to fill in the diary only in the morning before leaving and at night when he or she came back the next day. For longer absences, the participant was asked to leave out the whole diary week and to restart recording after coming back. Since the present investigation was not directed at short term effects, days with absences were not generally ex-cluded from the analysis, but they were one source of missing information.
If diurnal symptom status was not reported, the day was declared symptom-free, provided that nocturnal symptoms were explicitly denied and that evening peak expiratory flow was measured. The slight under-estimation of symptom prevalence resulting from this definition outweighs the opposite bias introduced by excluding such days from analysis. All other days with incomplete symptom reports were defined as "missing."
Statistical analysis
In a first step, we estimated transition probabili-ties—i.e., the probabilities of becoming symptomatic or asymptomatic, respectively, from one day to anoth-er—and the durations of symptomatic and nonsymp-tomatic episodes for each subject. This estimation was based on a Markov model. Secondly, we assessed the impact of cigarette smoking on these previously esti-mated outcome measures, using covariate-adjusted Cox regression to calculate confidence intervals for the median durations. Additionally, we compared the estimates obtained from the Markov model with the average durations of completely observed symptom-atic episodes (naive method).
Outcome measures. Our outcome measures—i.e., estimates of the individual average durations of non-symptomatic and non-symptomatic episodes, respective-ly—were derived from a Markov model describing day-to-day changes in symptom status. Since only the presence or absence of symptoms was recorded, a binary model was appropriate. For simplicity, we as-sumed the individual series to be stationary and tran-sition probabilities to depend only on the symptom
status of the previous day. Our model was based on the following assumptions:
1. The probability q of getting a symptom on the next day is constant (i.e., it does not depend on the number of symptom-free days prior to the current day).
2. The probability p of becoming symptom-free on the next day is constant (i.e., it does not depend on the number of symptomatic days prior to the current day).
If this model holds true, then in the long run the percentage of symptomatic days is ql(q + p), and the percentage of symptom-free days is pl\q + p). More-over, the mean length of symptom-free periods is \lq, and the mean length of symptomatic episodes is lip. Now, q and p may be estimated as follows:
"01 "01 + "oo
and
P =
where 5 = 0 represents a symptom-free day and 5 = 1 represents a symptomatic day and
noi = number of transitions from 5 = 0 to 5 = 1; «oo = number of transitions from 5 = 0 to 5 = 0; /tio = number of transitions from 5 = 1 to 5 = 0; nu = number of transitions from 5 = 1 to 5 = 1. Under this model (i.e., of a first-order stationary bi-nary Markov chain), the remaining number of episode days after the initial day of symptoms follows a geo-metric distribution with parameter p. Thus, the average duration of a symptomatic episode equals 1 + (1 — p)lp = \lp = (n,, + nw)/nw (16). Likewise, the
average duration of a nonsymptomatic episode equals Vq = («oo + "oiV"oi- Ov e r a l°n8 an^ completely
documented period with a sufficiently large number of symptomatic and nonsymptomatic episodes, respec-tively, one would almost certainly have («,, + n10)/
n,0 «* (number of days within completely documented
symptomatic episodes)/(number of completely docu-mented symptomatic episodes). Therefore, asymptoti-cally, our method of estimating the average duration of symptomatic episodes is equivalent to the naive method for subjects with variable symptom status in the ideal situation of complete documentation. By symmetry, the same also holds true for our estimates of the average duration of nonsymptomatic episodes. Since the naive method does not require any assump-tions other than data completeness, this asymptotic
equivalence indicates that potential limitations of our method are not primarily related to the fact that it was derived from a simplistic model of symptom dynamics but rather are related to the assumption that missing days (days with missing data) are independent of symptom status.
For 56.7 percent of the subjects, transition probabil-ities could be estimated in this way. The remaining subjects were divided into the following categories: 1) subjects who reported only symptomatic days or only symptom-free days, 2) subjects for whom exactly one of the two transition probability estimates p' and q' was 0, although they reported both types of symp-tom status, and 3) subjects for whom both transition probability estimates p' and q' were 0.
If all documented days (days with documented symptom status) for a subject are symptom-free, then only a censored estimate for the average length of this subject's symptom-free periods is available—i.e., the number n^ of transitions between consecutive docu-mented days. Of course, in such a case, no estimate for the average duration of symptomatic periods is avail-able. The case in which no symptom-free days have been reported is completely symmetrical (i.e., with n,, replacing n^. Approximately 27.7 percent of the es-timates were censored in this way.
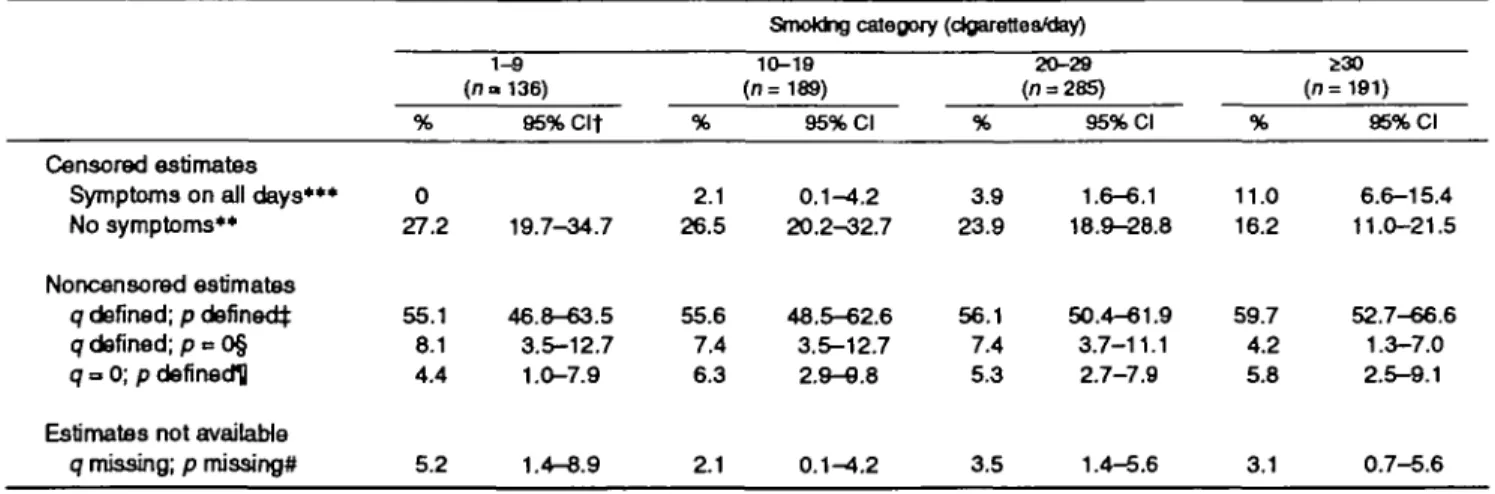
Table 1 shows the proportions of the different ways in which the estimates were obtained, stratified by smoking category. The proportions of censored esti-mates for symptomatic episodes were positively asso-ciated with increasing numbers of cigarettes smoked per day (test for trend: p < 0.001), and the proportions of censored estimates for nonsymptomatic episodes
were negatively associated with numbers of cigarettes smoked per day (test for trend: p < 0.01).
The following formula for the odds of reporting symptoms can be used to obtain estimates of p' and q', respectively, in cases where missing data do not allow us to apply the original formulas:
_ ql{q + p) _q ~ pKq + P) ~ P '
where/denotes the individual frequency of symptoms. If q' = 0 and p' > 0, then this formula gives
and if q' > 0 and p' = 0, then one obtains p = q
f
Approximately 12.2 percent of the estimates were calculated in this way.
If q and p are 0 or missing and censored estimates are not available, the average durations of nonsymp-tomatic and sympnonsymp-tomatic episodes cannot be calcu-lated. This may happen if there are few changes in symptom status and none of them can be clearly lo-cated in time because of missing data. In 3.4 percent of the cases, estimates could not be computed. This per-centage did not vary significantly between smoking categories (table 1).
Cox regression. In the present analysis, we as-sessed the effect of cigarette smoking on the average
TABLE 1. Availability of transition probabilities for bronchitis symptoms, SAPALDIAf study, Switzerland, 1992-1993
SmoMng category (clgarettea/day)
Censored estimates Symptoms on all days*** No symptoms**
Noncensored estimates q defined; p defined^ q defined; p = O§ q = 0; p defined!] Estimates not available
q missing; p missing* % 0 27.2 55.1 8.1 4.4 5.2 1-8 (n» 136) 95%Clt 19.7-34.7 46.8-63.5 3.5-12.7 1.0-7.9 1.4-8.9 % 2.1 26.5 55.6 7.4 6.3 ^ 1 10-19 (n=189) 95% Cl 0.1-4.2 20.2^32.7 48.5-62.6 3.5-12.7 2.9-9.8 0.1-4.2 % 3.9 23.9 56.1 7.4 5.3 3.5 20-29 (n = 285) 95% Cl 1.6-6.1 18.9-28.8 50.4-61.9 3.7-11.1 2.7-7.9 1.4-5.6 % 11.0 16.2 59.7 4.2 5.8 3.1 230 (n=191) 95% Cl 6.6-15.4 11.0-21.5 52.7-66.6 1.3-7.0 2.5-9.1 0.7-5.6 ** p < 0.01; •** p < 0.001 (test for trend).
t SAPALDIA, Swiss Study on Air Pollution and Lung Diseases in Adults; Cl, confidence interval.
j q = the probability of getting a symptom on the next day; p = the probability of losing a symptom on the next day. § p can be calculated by using o/and the frequency of symptomatic days.
U q can be calculated by using p and the frequency of symptomatic days. # Both q and p cannot be calculated.
durations of symptomatic and nonsymptomatic epi-sodes. Because of the presence of censored data (in subjects without changes in symptom status), Cox regression was used for this purpose. Multivariate analysis controlled for sex, age, age2, body mass
in-dex (weight (kg)/height (m)2), study area, season (the
proportion of winter days among all days with docu-mented symptom status), maternal asthma history, paternal asthma history, sibling asthma history, and atopy (defined as a positive skin test). To obtain covariate-adjusted distribution curves of individual av-erage durations for each of the four smoking catego-ries (1-9, 10-19, 20-29, and>30 cigarettes/day), we used this latter factor as a stratum variable in the Cox regression model (i.e., a different baseline distribution function was estimated for each of these categories).
RESULTS
Table 2 shows the distributions of age and body mass index among males and females in the four smoking categories. Table 2 also gives the length of participation for each group and the prevalence of the factors for which we controlled in the analysis. Heavy smokers (^30 cigarettes/day) tended to be older, to have a higher mean body mass index, and to have fewer documented days than light smokers (<10 cigarettes/day). However, all of these trends were rel-atively weak. A sibling history of asthma and a posi-tive skin test were most frequent in light smokers. The high prevalence of these known predictors of
respira-tory symptoms suggests that they should be controlled for in a multivariate analysis.
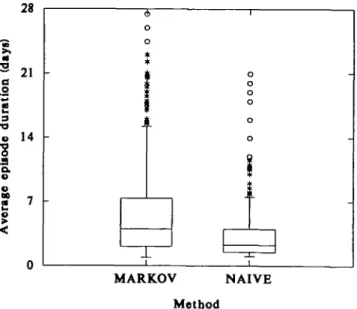
The estimates of episode duration were highly skewed in all exposure categories. When compared with the durations of completely observed episodes (naive method) (figure 1), the estimated durations were considerably longer (median of 4.0 days vs. 2.3 days) and had a wider distribution (interquartile range of 5.8 days vs. 2.5 days) and a long tail, with a maximum of 82 days, as compared with 21 days when symptomatic episodes could not exceed the 28-day observation periods by definition. Most of the long durations of symptomatic episodes were censored es-timates. Noncensored estimates correlated only weakly with length of participation (Pearson correla-tion coefficient = 0.09).
Figure 2 shows covariate-adjusted distribution curves for the individual average duration of episodes with bronchitis symptoms in the four smoking catego-ries; figure 3 shows the corresponding distribution curves for the individual average duration of intervals without bronchitis symptoms. As expected, these fig-ures display opposite trends with increasing numbers of cigarettes smoked. Periods of bronchitis symptoms tended to last longer and nonsymptomatic episodes tended to be shorter in heavy smokers. There was little difference between the categories of 10-19 cigarettes per day and 20-29 cigarettes per day regarding the average duration of symptomatic episodes, or between the categories of 1-9 cigarettes per day and 10-19 cigarettes per day regarding the average duration of
TABLE 2. ainical characteristic*, participation, and prevalence of control variables, SAPALOIA* study, SwHzeriand, 1992-1993
Mean age (years) Males Females
Mean body mass Indext Males Females PartJdpatlont Days Periods Season§ history of maternal asthma (%) history oi paternal asthma (%) SMng wtth asthma (%) PosBlve skin test (%)
No. 50 88 1-e (n=138) Mean or % 39.4 39.3 23.7 22.7 114.3 4.0 051 4.4 7.4 17.6 33.1 SD» or 95% Cl* 11/4 102 2.6 4 2 54.6 1 5 0 2 3 1.0-7.9 3.0-11.7 112-24.1 252-41.0 No. 80 109
SmoMng category (cigarettes/day) 10-19 (n-189) Mean or % 41.1 41.3 24.4 22.1 116.4 4.1 0.48 5.3 7.4 15.9 18.4 SD or 95% Cl 11.6 9.7 3.1 25 545 1.9 023 2.1-85 3.7-11.1 10.7-21.1 125-24.0 No. 159 126 20-29 (n = 285) Mean or % 42.0 4 0 2 24.8 23.6 107.1 3.8 050 3 5 6.7 9 2 18.8 SD or 95% Cl 10.0 9.7 3.6 4.4 56.1 2.0 0 2 5 1.6-6.1 3.8-9.6 5.8-125 14.3-23.4 No. 140 51 230 (n=19 Mean or % 42.3 412 25.4 232 107.6 3.8 050 3 2 5.8 11.8 25.0 1) SD or 95% Cl 9.4 6.8 3 5 3 5 57.0 ZO 02S 0.7-5.6 2J5-B.1 72-16.3 185-31.1 • SAPALDIA, Swiss Study on Air Pollution and Lung Diseases in Adults; SD, standard deviation; Cl, confidence Interval
t Weight (kgytielght {my.
t Participants were asked to 111 In dartes for six periods of 4 weeks each (168 days).
MARKOV NAIVE Method
FIGURE 1. Estimated individual average durations of bronchitis symptom episodes (Markov method vs. naive method) among 454 subjects: Swiss Study on Air Pollution and Lung Diseases in Adults, 1992-1993. The 25th, 50th, and 75th percentiles define the lower edge, Inner line, and upper edge of each box, respectively. Values exceeding the 75th percentiie by more than 1.5-fold the interquartile range are plotted individually. The minimum value defines the end of the lower whisker.
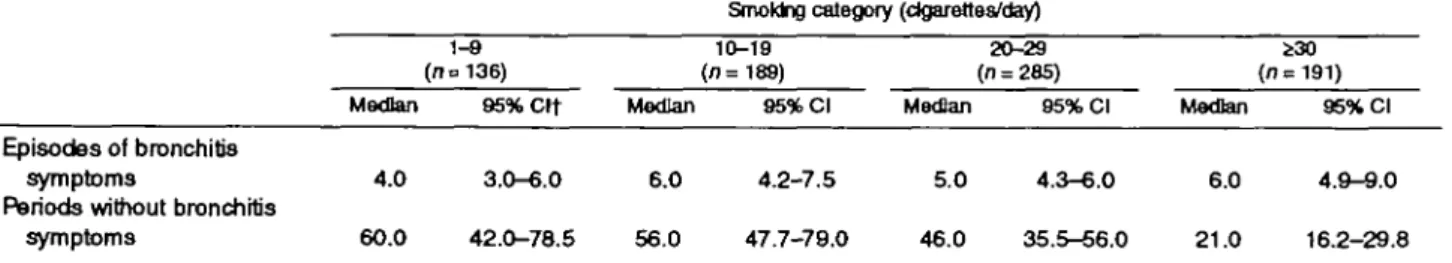
nonsymptomatic episodes. However, the overall dif-ferences between light ( < 10 cigarettes/day) and heavy ( s 3 0 cigarettes/day) smokers were considerable (table 3). We estimated medians of 60.0 symptom-free days (95 percent confidence interval (CI) 42.0-78.5) and
4.0 symptomatic days (95 percent CI 3.0-6.0), respec-tively, for light smokers compared with medians of only 21.0 symptom-free days (95 percent CI 16.2-29.8) and 6.0 symptomatic days (95 percent CI 4.9-9.0), respectively, for heavy smokers.
DISCUSSION
In this paper, we have provided a simple and effi-cient method of dealing with diary data from a 2-year study in which subjects recorded information during several separate 4-week periods. This type of partici-pation was less demanding for participants than a single 6-month diary period. A design with multiple intermittent diary periods results in an increased num-ber of symptomatic and nonsymptomatic episodes ex-ceeding the limits of the documented periods, adding to the problem of missing data encountered in diary studies. Since the symptom duration data tend to be highly skewed, with a minimum of 1 day and a long tail (12), a naive approach considering only complete episodes not only results in a substantial loss of data but introduces bias towards shorter episodes.
We have shown that the use of a simple Markov model allows investigators to avoid the problems de-scribed. A MEDLINE® search suggested that Markov models are increasingly being used in scientific papers (37 papers in 1966-1975, 57 in 1976-1983, 178 in 1984-1990, and 258 in 1991-1996). The application of this method in epidemiology, however, has been relatively scarce. With regard to environmental
epide-ID
I
1
.2I
1-9 cigarettes/day 10-19 cigarettes/day 20-29 cigarettes/day 30+ cigarettes/day 50 100 150Average duration of symptom episodes (days)
FIGURE 2. Distribution of the individual average durations of bronchitis symptom episodes (adjusted for covariates listed in text), by smoking category: Swiss Study on Air Pollution and Lung Diseases in Adults, 1992-1993.
5
1!
1-9 cigarettes/day 10-19 cigarettes/day 20-29 cigarettes/day 30+ cigarettes/dayS
s
100 150Average duration of symptom-free episodes (days)
FIGURE 3. Distribution of the individual average durations of episodes without bronchitis symptoms (adjusted for covariates listed in text), by smoking category: Swiss Study on Air Pollution and Lung Diseases In Adults, 1992-1993.
miology, the model was first applied by Korn and Whittemore for analyzing the relation between a bi-nary health response and short term air pollution ex-posure (17) as a way of avoiding the problems of previous approaches, such as autocorrelation and missing values. However, as far as we know, two-stage approaches, using parameters of a Markov model as outcomes to be further analyzed, have not been employed so far. The specific assumptions about this model do not seem to represent a serious meth-odological limitation, since our method of estimating the average duration of symptomatic episodes is as-ymptotically equivalent to the naive method in the case of complete data over a long observation period with a large number of documented symptomatic episodes. In the case of shorter observation periods, however, the estimates may exhibit some seasonal dependency. We therefore used the percentage of
documented days in the winter season as a model covariate.
In our example, estimates were available for more than 96 percent of the subjects. To increase this per-centage, we considered additional steps such as im-puting data for single missing days, but less than half of the remaining cases would have been gained for the analysis. A more sophisticated approach that would be generally applicable might consist of deriving maxi-mum likelihood estimates under the assumption that missing days occur without any relation to symptom status.
The present model assumes that missing days are uninformative—i.e., that the mechanisms leading to days with missing information are unrelated to the underlying dynamics of symptom status (18). As re-gards undocumented day-to-day transitions of symp-tom status at the beginning or end of a diary period,
TABLE 3. Covariate-adjusted estimates* of the individual average durations of bronchitis symptom episodes and corresponding nonsymptomatic periods (in days), SAPALDIA+ study, Switzerland, 1992-1993
Episodes of bronchitis symptoms
Periods without bronchitis symptoms Median 4.0 60.0 1-9 (no 136) 95%Clt 3.0-6.0 42.0-78.5 Median 6.0 56.0
Smoking category (dgarefles/day) 10-19 (n = 189) 95% Cl 4.2-7.5 47.7-79.0 Median 5.0 46.0 20-29 (n = 285) 95% Cl 4.3-6.0 35.5-56.0 (n = Median 6.0 21.0 30 191) 95% Cl 4.9-9.0 16.2-29.8
• Adjusted for sex, age, age* body mass index, study area, season, family history of asthma, and atopy (see "Materials and Methods"), t SAPALDIA, Swiss Study on Air Pollution and Lung Diseases in Adults; Cl, confidence interval.
this assumption is certainly valid; but it does not match reality where undocumented day-to-day transitions within a diary period are concerned. In our example, the vast majority of subjects (90 percent) had very few (<5 percent) unexplained missing transitions (i.e., transitions for which at least one of the days was without documented symptom status and without in-dicated absence from the community). As a conse-quence of these nonignorable missing days, duration estimates may be biased to a certain extent. However, as long as reporting behavior varies little across expo-sure categories, differences in duration estimates be-tween these categories may be less affected when being considered on a relative scale rather than an absolute scale. To assess the potential magnitude of this bias, we performed a sensitivity analysis using the individual percentage of missing transitions as an additional covariate. While this had almost no effect on the association between duration of symptom epi-sodes and smoking intensity, the association between symptom-free episodes and smoking intensity de-creased slightly. Moreover, upon analyzing associa-tions between baseline symptoms (cross-sectional ex-amination) and individual follow-up symptom prevalences, we found some suggestion that missing days were positively associated with symptom-free status. Further assessment of the potential impact of nonignorable missing data on duration estimates is beyond the scope of this analysis.
We tested our method using diary data from SAPALDIA and obtained plausible estimates for the effects of smoking on the individual average durations of bronchitis symptom episodes and corresponding nonsymptomatic episodes, respectively. Although the clinical feature of smoking as a risk factor for respi-ratory ill health is well known, it has not been previ-ously quantified with regard to symptomatic and non-symptomatic episodes, to our knowledge. This study sample consisted of smokers who were either symp-tomatic or hyperreactive. The true effects of smoking might even have been underestimated, because of the fact that heavy smokers may reduce their cigarette consumption or quit smoking if they become symp-tomatic.
We suggest that the method of transition probabili-ties is a feasible approach to the assessment of long term effects of smoking and environmental risk factors on the average durations of symptomatic respiratory episodes and intervals without such symptoms.
ACKNOWLEDGMENTS
The Swiss Study on Air Pollution and Lung Diseases in Adults (SAPALDIA) is part of Swiss National Research
Program 26A, which is supported by the Swiss National Science Foundation (grant 4026-28099) and the Federal Office of Education and Science. SAPALDIA Basel is part of the European Respiratory Survey.
The SAPALDIA Team—Study Director. Dr. P. Leuenberger (Division of Pneumology, University Hospital Lausanne, Lausanne); Program Director. Dr. U. Ackermann-Liebrich (Institute for Social and Preventive Medicine, University of Basel, Basel); Principal Investigators: Drs. J. P. Bongard (private practitioner, Geneva), O. Brandli (Ziircher Hohenklinik, Wald), G. Domenighetti (Ospedale Regionale, Locarno), R. Keller (Klinik Barmelweid, Aarau), A. P. Perruchoud (University Hospital Basel, Basel), M. H. SchSni (Alpine Kinderklinik, Davos), I. M. Tschopp (Centre Valaisan de Pneumologie, Montana), and J. P. Zellweger (Division of Pneumology, University Hos-pital Lausanne, and H6Hos-pital de Zone, Payeme); co-Principal Investigators: Drs. G. Bolognini (Ospedale della Beata Vergine, Mendrisio), P. Braun (Ziircher Hochgebirgsklinik, Davos), W. Karrer (Luzerner Hohenklinik, Montana), H. Keller-Wossidlo (Klinik Barmelweid), T. C. Medici (University Hospital Zurich, Zurich), G. Solari (private practitioner, Lugano), and B. Villiger (Thurgauisch-Schaffhausische Hohenklinik, Davos); Central Unit: Drs. N. Kiinzli, L. Grize, B. W. Martin, C. Schindler, and E. Zemp (Institute for Social and Preventive Medicine, University of Basel) and Dr. J. Schwartz (Harvard School of Public Health, Boston, Massachusetts); Environmental Unit. Drs. C. Monn and P. Alean (Federal Institute of Technology, Zurich) and Drs. C. Defila and A. G. Peeters (Swiss Meteorological Institute, Zurich); Allergology Unit: Drs. B. Wiithrich (University Hospital Zurich) and K. Blaser (Swiss Institute of Allergy and Asthma Research, Davos); local medical field-workers: Drs. C. Bron (Alpine Kinderklinik), M. Brutsche (Centre Valaisan de Pneumologie), S. Elsasser (University Hospital), P. Guldimann (Ziircher Hohenklinik), P. Hufschmid (Klinik Barmelweid), J. C. Luthi (H6pital de Zone, Payerne), and A. Radaelli (Ospedale Regionale).
REFERENCES
1. Hammer DI, Hasselblad V, Portnoy B, et al. Los Angeles student nurse study: daily symptom reporting and photochem-ical oxidants. Arch Environ Health 1974;28:255-60. 2. Hoek G, Brunekreef B. Acute effects of a winter air pollution
episode on pulmonary function and respiratory symptoms of children. Arch Environ Health 1993;48:328-35.
3. Hoek G, Brunekreef B. Effects of low level winter air pollu-tion concentrapollu-tions on respiratory health of Dutch children. Environ Res 1994;64:136-50.
4. Ostro BD, Lipsett MJ, Mann JK, et al. Air pollution and respiratory morbidity among adults in Southern California. Am J Epidemiol 1993;137:691-700.
5. Neas LM, Dockery DW, Koutrakis P, et al. The association of ambient air pollution with twice daily peak expiratory flow rate measurements in children. Am J Epidemiol 1995;141:
111-22.
be-tween symptoms and environmental factors over time. Envi-ron Res 1984;33:130-43.
7. Roemer W, Hoek G, Brunekreef B. Effect of ambient winter air pollution on respiratory health of children with chronic respiratory symptoms. Am Rev Respir Dis 1993; 147:118-24. 8. Schwartz J, Hasselblad V, Pitcher H. Air pollution and morbidity: a further analysis of the Los Angeles student nurses data. J Air Pollut Control Assoc 1988;38:158-62.
9. Schwartz J, Zeger S. Passive smoking, air pollution, and acute respiratory symptoms in a diary study of student nurses. Am Rev Respir Dis 1990;141:62-7.
10. Schwartz J, Dockery DW, Neas LM, et al. Acute effects of summer air pollution on respiratory symptom reporting in children. Am J Respir Crit Care Med 1994;150:1234-42. 11. Braun-Fahrlander C, Ackermann-Liebrich U, Schwartz J, et
al. Air pollution and respiratory symptoms in preschool chil-dren. Am Rev Respir Dis 1992; 145:42-7.
12. Schwartz J. Air pollution and the duration of acute respiratory symptoms. Arch Environ Health 1992;47:116-22.
13. Pope CA HL Schwartz J. Time series for the analysis of pulmonary health data. Am J Respir Crit Care Med 1996; 154(suppl):S229-33.
14. Martin BW, Ackermann-Liebrich U, Leuenberger P, et al. SAPALDIA: methods and participation in the cross-sectional part of the Swiss Study on Air Pollution and Lung Diseases in Adults. Soz Praventivmed 1997;42:67-84.
15. Burney PG, Luczynska C, Chinn S, et al. The European Community Respiratory Health Survey. Eur Respir J 1994;7: 954-60.
16. Feller W. An introduction to probability theory and its appli-cations. New York, NY: John Wiley and Sons, Inc, 1968. 17. Kom EL, Whittemore AS. Methods for analyzing panel
stud-ies of acute health effects of air pollution. Biometrics 1979; 35:795-802.
18. Little RJ, Rubin DB. Statistical analysis with missing data. (Wiley series in probability and mathematical statistics). New York, NY: John Wiley and Sons, Inc, 1987.

![Risiko- & [und] Schutzfaktoren der psychischen Gesundheit humanitärer Einsatzhelfer : eine systematische Literaturübersicht](data:image/gif;base64,R0lGODlhAQABAIAAAP///wAAACH5BAEAAAAALAAAAAABAAEAAAICRAEAOw==)