HAL Id: hal-00811540
https://hal.archives-ouvertes.fr/hal-00811540
Submitted on 10 Apr 2013
HAL is a multi-disciplinary open access
archive for the deposit and dissemination of
sci-entific research documents, whether they are
pub-lished or not. The documents may come from
teaching and research institutions in France or
abroad, or from public or private research centers.
L’archive ouverte pluridisciplinaire HAL, est
destinée au dépôt et à la diffusion de documents
scientifiques de niveau recherche, publiés ou non,
émanant des établissements d’enseignement et de
recherche français ou étrangers, des laboratoires
publics ou privés.
bidirectional reflectance measurements of POLDER
instruments during ACE-2
Frédéric Parol, Jacques Descloitres, Yves Fouquart
To cite this version:
Frédéric Parol, Jacques Descloitres, Yves Fouquart. Cloud optical thickness and albedo retrievals
from bidirectional reflectance measurements of POLDER instruments during ACE2. Tellus B
-Chemical and Physical Meteorology, Taylor & Francis, 2000, 52 (2), pp.888-908.
�10.1034/j.1600-0889.2000.00026.x�. �hal-00811540�
ISSN 0280–6509
Cloud optical thickness and albedo retrievals from
bidirectional reflectance measurements of POLDER
instruments during ACE-2
By FRE´ DE´RIC PAROL*, JACQUES DESCLOITRES‡ and YVES FOUQUART, L aboratoire d’Optique Atmosphe´rique, Universite´ des Sciences et T echnologies de L ille, V illeneuve d’Ascq, France
(Manuscript received 2 February 1999; in final form 8 October 1999)
ABSTRACT
The POLDER instrument is devoted to global observations of the solar radiation reflected by the Earth–atmosphere system. The airborne version of the instrument was operated during the ACE-2 experiment, more particularly as a component of the CLOUDYCOLUMN project of ACE-2 that was conducted in summer 1997 over the subtropical northeastern Atlantic ocean. CLOUDYCOLUMN is a coordinated project specifically dedicated to the study of the indirect effect of aerosols. In this context, the airborne POLDER was assigned to remote measurements of the cloud optical and radiative properties, namely the cloud optical thickness and the cloud albedo. This paper presents the retrievals of those 2 cloud parameters for 2 golden days of the campaign 26 June and 9 July 1997. Coincident spaceborne ADEOS-POLDER data from 2 orbits over the ACE-2 area on 26 June are also analyzed. 26 June corresponds to a pure air marine case and 9 July is a polluted air case. The multidirectional viewing capability of airborne POLDER is here demonstrated to be very useful to estimate the effective radius of cloud droplet that characterizes the observed stratocumulus clouds. A 12 mm cloud droplet size distribution appears to be a suitable cloud droplet model in the pure marine cloud case study. For the polluted case the mean retrieved effective droplet radius is of the order of 6–10 mm. This only preliminary result can be interpreted as a confirmation of the indirect effect of aerosols. It is consistent with the significant increase in droplet concentration measured in polluted marine clouds compared to clean marine ones. Further investigations and comparisons to in-situ micro-physical measurements are now needed.
1. Introduction culty for GCMs to correctly take into account
cloud–radiation–climate interactions (Cess et al., 1990, 1996; Senior and Mitchell, 1993). The magni-One of the major uncertainties in the
determina-tude of the radiative cloud forcing is significant tion of the climate sensitivity to human
perturba-(see for instance Harrison et al., 1990) and a slight tions is the lack of understanding of the feedbacks
variation of cloud characteristics could have a associated with cloudiness changes and the
diffi-strong influence on the evolution of the climate. Consequently, GCMs need a realistic
representa-* Corresponding author address: Laboratoire tion of cloud properties and their effects on radi-d’Optique Atmosphe´rique, Universite´ des Sciences et
ation budget at global and regional scale. Global
Technologies de Lille, UFR de Physique, Baˆt. P5, 59655
observations are essential to achieve this objective.
Villeneuve d’Ascq Cedex, France.
Of course, the most comprehensive way to
e-mail: [email protected]
obtain global cloud observations is by means of
‡ Present affiliation: University of Maryland,
experiments and ground-based measurements International Global Atmospheric Chemistry Project (IGAC) that addresses atmospheric aero-remain essential to support the interpretation of
satellite observations. Satellites can directly sol properties relevant to radiative forcing and climate. ACE-2 was conducted from 15 June to observe the spatial and temporal variabilities of
clouds (Rossow and Schiffer, 1991) and also their 31 July 1997 over the sub-tropical north-eastern Atlantic Ocean, with the base of operations in the effects on Earth’s radiation budget at the top of
the atmosphere (Ramanathan et al., 1989; Canary Islands (Raes et al., 2000; Verver et al., 2000). The present study has been conducted using Harrison et al., 1990). POLDER (POLarization
and Directionality of the Earth’s Reflectances) is data from both the spaceborne version of POLDER and the airborne simulator of the a component of a series of new sensors that may
provide key information to improve our knowl- instrument. The multidirectional viewing capabil-ity of the POLDER instrument allows to observe edge of clouds, radiation and climate interactions
(Buriez et al., 1997; Parol et al., 1999). The next a part of the Bidirectional Reflectance Distribution Function (BRDF) of any cloud scene. The BRDF generation of satellite instruments such as CERES
(Cloud and the Earth’s Radiant Energy System) is the angular distribution of radiances upcoming from the cloud layer. A direct integration of the (Wielicki and Barkstrom, 1991), MODIS
(Moderate Resolution Imaging Spectrometer) BRDF over the hemispherical solid angle 2p pro-vides the true cloud albedo. However POLDER (King et al., 1992), MISR (Multi-angle Imaging
SpectroRadiometer) (Diner et al., 1998), POLDER can instantaneously measure reflectances only in a limited number of view directions (up to ~14) will play a crucial roˆle in helping to better
under-stand clouds and their influence on the Earth’s while albedo calculation requires reflectances from all angles. An alternate method is applied that radiation balance.
One of the most significant cloud parameters derives cloud optical thickness from measured bidirectional reflectance using the plane-parallel used to determine the cloud–radiation interactions
is the cloud optical thickness, which is directly approximation. The plane-parallel model is then used again to derive the cloud albedo from that related to the cloud droplet size distribution and
the condensed water path (Fouquart et al., 1990). retrieved optical thickness. However the multidi-rectional measurement capability of POLDER Projects as ISCCP (International Cloud
Clymatology Project, Rossow and Schiffer, 1991) offers a new perspective to this procedure. POLDER also enables to test the validity of the try to retrieve the cloud optical thickness from
satellite measurements of visible radiance. They hypotheses (on cloud macrophysics and micro-physics) used to determine the cloud optical thick-make the crude assumption of plane-parallel cloud
layers with a prescribed cloud droplet size distri- ness. This paper illustrates this new perspective. A feasibility study is presented that shows that the bution. Thus the interpretation of satellite
obser-vations is based on both macrophysical and micro- multiangular capability of the airborne POLDER can be useful to infer an approximate value of the physical hypotheses. Numerous studies have
derived the cloud optical thickness from remote cloud water drop size.
Both POLDER instruments and respective data sensing measurements using the plane-parallel
approximation, but only few direct observations are described in Section 2. The method for analyz-ing the angular dispersion of POLDER data is of cloud bidirectional reflectance have been
com-pared to radiation fields calculated using the presented in Section 3. Sections 4 and 5 present the cloud properties, cloud amount, optical thick-plane-parallel model (Davis and Cox, 1982;
Stuhlmann et al., 1985; Baldwin and Coakley, ness, and albedo, derived from airborne POLDER data and coincident spaceborne ADEOS-1991; Descloitres et al., 1995; Spinhirne et al.,
1996; Descloitres et al., 1998). POLDER data respectively. The original contri-bution of POLDER with respect to these products This paper contains preliminary results related
to such comparisons within the framework of the is emphasized. Airborne POLDER data acquired over the ACE-2 region on 2 golden days of the CLOUDYCOLUMN component (Brenguier
et al., 2000) of the North Atlantic Regional Aerosol campaign 26 June and 9 July 1997, and coincident spaceborne POLDER data from 2 ADEOS orbits Characterisation Experiment (ACE-2). ACE-2 was
1997 are analyzed. Results are summarized and et al., 1998; Parol et al., 1999). The level-2 and 3 ‘‘ERB & clouds’’ products provide cloud proper-discussed in Section 6.
ties averaged over ~56×56 km2 ‘‘super-pixel’’ regions (~9×9 pixels). The spatial resolution of the super-pixel (0.5°×0.5° at the equator) is
con-2. The POLDER instrument and data
venient for comparisons to ISCCP products and to ERB instruments as ScaRaB (Scanner for the POLDER is a multispectral visible radiometer/
polarimeter devoted to observations of polariza- Earth Radiation Budget) (Kandel et al., 1994) and CERES (Wielicki and Barkstrom, 1991).
tion and directionality of solar radiation reflected
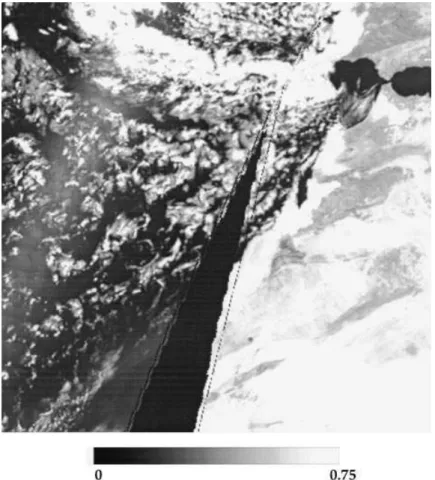
by the Earth’s surface–atmosphere system. The One example of 0.865 mm level-1 radiance acquired by ADEOS-POLDER during the ACE-2 instrument concept is simple and very similar
to a camera. POLDER is composed of a period is shown in Fig. 1. It is a composite image of 0.865 mm reflectance measured along 2 success-2-dimensional charge-coupled device (CCD)
detector array, a rotating wheel carrying spectral ive ADEOS orbits on 26 June 1997. The image is made using the 8th observation for each pixel, and polarizing filters, and a wide field of view
telecentric optics (see Deschamps et al., 1994, for which is practically close to the minimum view angle (POLDER observes a given target under up further details).
to 14 view angles). The 8th observation corre-sponds to view angles ranging from ~5° near the 2.1. T he satellite data
swath center to ~65° near the edges. The experi-mental ACE-2 domain approximately covers the The spaceborne version of POLDER is a CNES
(the French Space Agency) instrument which flew image. In this figure clouds appear as bright pixels against a darker ocean background. In spite of aboard the Japanese ADEOS (ADvanced Earth
Observing Satellite) polar orbiting platform the coarse spatial resolution of POLDER (6.2 km), the image clearly shows high variations of cloud between August 1996 and June 1997, including
the first couple of weeks of the ACE-2 experiment. structure ranging from scattered cumulus clouds to solid stratocumulus cloud layers.
ADEOS is on a sun-synchronous orbit at an altitude of 797 km. The along-track and cross-track fields of view of POLDER extend up to
2.2. T he airborne data ±42° and ±52° respectively. Thanks to
POLDER’s large swath width (~2200 km), each During the ACE-2 campaign in Tenerife in June–July 1997, the airborne simulator of point on the Earth is observed almost every day,
and 4 days out of 5 near the equator. The CCD POLDER was operated aboard the German Dornier aircraft of the DLR (Deutsche sensor array is composed of 242×274 pixels. The
ground size of a POLDER pixel aboard ADEOS Forschungsanstalt fu¨r Luft und Raumfahrt) and was flown over stratocumulus clouds. The field of is (6×7) km2 at nadir. As the ADEOS satellite
passes over a scene, up to 14 successive measure- view of the airborne instrument extends up to ±52° in the along-track direction and ±42° in ments are made in 8 narrow spectral bands ranging
from 0.44 mm to 0.91 mm. The POLDER level-1 the cross-track direction. Its CCD array is com-posed of 288×242 pixels. Considering the typical products routinely processed by CNES consist of
calibrated radiances and Stokes parameters pro- aircraft-cloud relative altitude, the field of view of the instrument corresponds to a scene of jected on a reference equal-area global grid at
6.2 km resolution. There are no onboard calib- ~4 km×3 km (approximately the size of one ADEOS-POLDER pixel ). The spatial resolution ration sources and the POLDER in-flight
radiometric calibration is based on terrestrial tar- of the airborne data is ~15 m, but it is degraded to 10×10 pixels, in order to reduce both the data gets (Hagolle et al., 1999).
One of the scientific objectives of the satellite flow and the measurement noise. The aircraft motion between 2 successive acquisitions of mission relates to the Earth radiation budget and
cloud characteristics (hereafter noted as ‘‘ERB & POLDER is approximately 500 m. Angular devi-ations due to the pitch and roll of the aircraft are clouds’’): BRDF, cloud fraction, optical thickness,
radi-Fig. 1. ADEOS-POLDER composite image constructed from top of atmosphere reflectance at 0.865 mm for a ~2500 km×2500 km area of the Atlantic Ocean centered on (28°N, 16°W) corresponding to the ACE-2 region on 26 June 1997 at 11:15 UTC (east orbit) and 12:50 UTC (west orbit). The top right of the image is Spain. Western Africa appears on the east orbit down to latitude ~20°N. The grey scale indicates the minimum and maximum values of observed bidirectional reflectance. The black dots near the inside boarders of these paths are missing data.
ances in 5 channels from 0.44 mm to 0.91 mm. The CCD matrix (i.e., as many view angles). Fig. 2 illustrates this property of the instrument. It is POLDER calibration is performed in laboratory.
The estimated accuracy in absolute reflectance is easy to follow a given target (for instance, a hole in the cloud deck) on a series of successive images. 5% and the pixel-to-pixel intercalibration
accu-racy is 0.5%. In a cloud scene observed in a single high reso-lution POLDER image (which is in fact a BRDF Similarly to the satellite version, the airborne
POLDER can provide multidirectional reflectance limited to the solid angle corresponding to the instrument field of view), variations in bidirec-measurements of any scene. A given target is seen
under several view directions. The number of tional reflectances are due to both the anisotropy of the radiation coming from the scene and the directions depends on the aircraft speed and the
relative altitude of the aircraft with respect to the horizontal variations in optical thickness from a cloud section to another within the instrument cloud top. Typically, it was 15 for stratocumulus
clouds observed during ACE-2. Consequently, the field of view (Descloitres et al., 1995). Nevertheless, as seen in Fig. 2, some parts of the observed cloud same geographical target appears several times on
Fig. 2. Series of single 0.865 mm reflectance images acquired by the airborne POLDER on 26 June 1997 approxi-mately 1.5 km above stratocumulus clouds. The image number followed by the bidirectional reflectance range (in percent) corresponding to the grey scale are indicated at the bottom of each image. The grey scale in each panel is stretched from black to white to maximize contrast.
anisotropy effects preponderant: the backscatter model the surface ocean is modeled following Cox and Munk (1956). A prescribed droplet size distri-peak and the cloudbow (~140° scattering angle)
clearly appear on a lot of single images. Note that bution is used to model clouds.
Descloitres et al. (1995) applied such an the cloudbow is a typical feature of clouds
com-posed of liquid water drops. approach to airborne POLDER data acquired during the ASTEX campaign above a stratocumu-lus cloud deck. They showed that, because of horizontal inhomogeneities, the clouds are not
3. Methodology
homogeneous plane-parallel layers over one single POLDER image, with a rms difference between Measurements from both the spaceborne
ver-sion of POLDER and the airborne simulator are the observed and the modeled reflectances of approximately 10%. Nevertheless, the clouds com-used to estimate the angular dependency of cloud
optical thickness and albedo retrieved under the pare favorably with a set of various independent plane-parallel layers. In that case the rms differ-plane-parallel approximation. A conventional
pro-cedure is applied to estimate the albedo for cloudy ence between observations and calculations is within 2–3%. Descloitres et al. (1998) conclude scenes. The upward radiance is used to determine
the optical thickness, assuming the cloud scene that the Independent Pixel Approximation is valid for such a spatial resolution since the mean homogeneous. The plane-parallel model is then
used to derive the cloud albedo corresponding to reflectance of a distribution of cloud targets is very close to the plane-parallel model.
the retrieved optical thickness.
In this procedure, the size distribution of cloud Assuming the Independent Pixel Approxi-mation, optical thickness and aldebo can be water droplets is prescribed and the cloud is
assumed to be vertically uniform with respect to derived for each cloud target and for each view direction. The angular dispersion of the ~15 that distribution. In these conditions the optical
thickness is the only cloud variable. Here, the retrievals is due to the departure of the POLDER observations from the bidirectional reflectances horizontal dimensions of a cloud scene are
(~150 m)2 and (6.2 km)2 for the airborne and calculated using the cloud model selected for the inversion. In this paper the angular dispersions spaceborne POLDER, respectively. Since cloud
scenes are assumed homogeneous (constant geo- are characterized for every target by the relative angular standard deviation defined as the angular metrical thickness) cloud optical thickness
vari-ations are proportional to varivari-ations in liquid standard deviation normalized to the mean value of the cloud property under consideration. water content.
3.1. T he airborne POL DER 3.2. T he spaceborne POL DER
The cloud optical thickness is estimated from Following the methodology developed by
Descloitres et al. (1995, 1996), cloud optical thick- the ADEOS-POLDER radiance measurements, using the Independent Pixel Approximation ness and cloud albedo are estimated from the
POLDER reflectance measurements at 0.865 mm, (Buriez et al., 1997). For each cloudy pixel (6.2 km)2, the bidirectional reflectance is compared using the so-called ‘‘Independent Pixel
Approximation’’ (Cahalan et al., 1994). For each to the plane-parallel model, using the discrete ordinate method (Stamnes et al., 1988). For each cloud target (~150 m)2, the bidirectional
reflectance set (i.e., ~15 observations) is compared view angle, the cloud optical thickness is adjusted to make the plane-parallel bidirectional reflectance to the plane-parallel model, using the discrete
ordinate method (Stamnes et al., 1988). The mean equal the reflectance observed in this direction. So the cloud optical thickness is determined for each optical thickness of a cloud target is adjusted so
that the mean reflectance over the ~15 different view direction and each pixel. Moreover, in order to make easier the comparison to ISCCP climato-view angles equals the plane-parallel one
(Descloitres et al., 1995). The corresponding plane- logy (Rossow and Schiffer, 1991), the cloud optical depth is calculated using the ISCCP liquid water parallel albedo is then derived from the mean
(Parol et al., 1999). It is a gamma distribution cloud morphology on radiation, because of the complexity of the cloud structures and their variab-with an effective radius r
e=10 mm and an effective
variance of 0.15 (Hansen and Travis, 1974). The ility from one cloud type to another. All retrieved ‘‘ERB & clouds’’ parameters are based on simple optical thickness is derived at 3 wavelengths
(0.443 mm, 0.670 mm, and 0.865 mm) but finally algorithms in order to be produced operationally. For instance, the cloud optical thickness is derived only the value at 0.670 mm is distributed in the
level-2 ‘‘ERB & clouds’’ products. The values at using the Independent Pixel Approximation. This does not take full advantage of the POLDER 0.443 mm and 0.865 mm are used as indicators of
the reliability of the 0.670 mm optical thickness. capability to observe the radiation field anisotropy. Nevertheless, the cloud parameters derived from For each channel (0.443 mm, 0.670 mm, and
0.865 mm) and for each view angle the narrow- POLDER at global scale are a first step to check the validity of the commonly used plane-parallel band cloud albedo is derived from the retrieved
optical thickness. The shortwave broadband model. That is examined in Section 5. albedo is determined for each view angle and
estimated from the 3 narrow-band albedoes as
explained by Buriez et al. (1997). These ‘‘direc- 4. Airborne POLDER derived cloud properties
tional’’ cloud properties are finally averaged at the super-pixel scale, i.e., on a 9×9 pixels area. As
for the airborne POLDER retrievals, the angular During the ACE-2 CLOUDYCOLUMN clos-ure experiment, the German Dornier was devoted dispersion is characterized for every super-pixel
by the relative angular standard deviation of these to remote sensing above low-level clouds, provid-ing observations at better resolution than satellite ~14 values. Moreover the sub-super-pixel
infor-mation is used to determine the relative spatial images. Coincident in-situ measurements were per-formed by the French Merlin IV aircraft from standard deviations for each viewing direction.
In Section 5 the relative spatial standard deviation Me´te´o-France. This is an opportunity to establish the relationship between microphysics measure-of the optical depth is computed for the 6th
obser-vation that corresponds to near-nadir viewing con- ments and horizontal variations of cloud proper-ties captured by the POLDER and OVID (Barsch ditions for the central part of the orbit path.
In the operational retrieval the relation between and Bakan, 1993) instruments aboard the Dornier (Brenguier et al., 2000). The aim of this section is the top-of-the-atmosphere reflectance and the
cloud optical thickness is dependent on the surface to present some examples and analyses of the cloud optical thickness and spectral cloud albedo reflectivity. For land pixels, the surface reflectance
is obtained from surface parameters previously derived from POLDER reflectances at 0.865 mm for 26 June and 9 July 1997. These 2 days have retrieved from POLDER observations in
cloud-free conditions by the POLDER ‘‘Land surfaces’’ been selected as golden days of the ACE-2 CLOUDYCOLUMN field project.
processing line (Leroy et al., 1997). For ocean pixels, the surface reflectance is calculated using Cox and Munk’s (1956) model.
4.1. T he 26 June 1997 case study The plane-parallel approach used in the level-2
‘‘ERB & clouds’’ operational processing can lead During the ACE-2 mission 02 on 26 June 1997, the Dornier was flown over extended low-level to substantial errors when used to infer cloud
optical thickness from actual satellite measure- clouds, while quasi-simultaneous in-situ micro-physics measurements were performed aboard the ments (Loeb and Coakley, 1998). It may be also a
major weakness in the assessment of the effects of Merlin (Brenguier et al., 2000). The stratocumulus was sampled along 30-km legs. The visible and clouds on radiation (Parol et al., 1994; Brogniez
et al., 1992). Numerous theoretical studies have near-infrared channels (as at 0.865 mm) are primar-ily sensitive to the cloud optical thickness (see for shown that 3-dimensional and plane-parallel
clouds reflect radiation differently (Bre´on, 1992; instance Table 2 in Han et al., 1994). The retrieval of cloud optical thickness is thus almost not Kobayashi, 1993; Loeb et al., 1997). However, it is
hardly possible to derive global cloud properties dependent on the drop size distribution. A gamma size distribution with an effective radius r
e=12 mm from space and take into account the effect of
and an effective variance of 0.15 is assumed maximum and the cloudbow (~140° scattering angle).
(Hansen and Travis, 1974) to retrieve the optical
thickness and derive the corresponding plane- Fig. 5 compares observed and calculated vari-ations of the cloud bidirectional reflectance against parallel albedo.
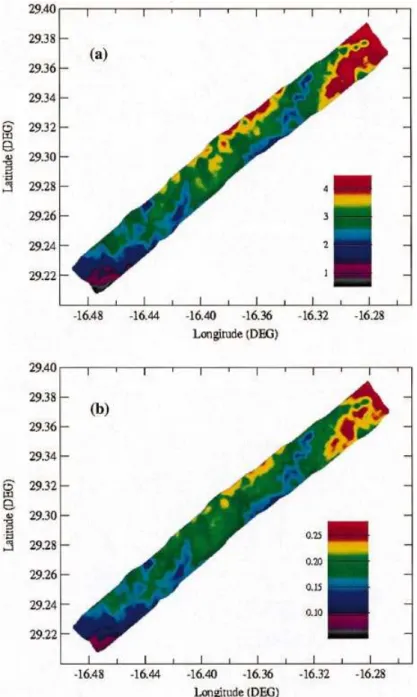
The cloud optical thickness and cloud albedo the view angle in the principal plane. The relative azimuth angle w is measured with respect to the maps of the ~30 km×3 km scenes, observed from
the Dornier along one leg, are reported in Fig. 3. principal plane, so that the azimuthal coordinate of the sun ( backscatter direction) is w=0°. For all This leg corresponds to the southeast part of the
square pattern performed on 26 June. It was plots in the principal plane presented in this paper, positive zenith angles correspond to relative azi-sampled from 14:27 to 14:32 UTC. The color
scale (from black to red) represents a range of muth w=0°, while negative correspond to w= 180°. The plane-parallel simulations reported in optical thickness from 0 to 4.5 or range of albedo
from 0 to approximately 0.28. As expected for this Fig. 5 are made for 2 different sizes of cloud droplets, namely 6 mm and 12 mm. The observed flight mission, the cloud optical thickness values
are low, ranging from 4.5 at the East point (point bidirectional reflectance curve corresponds to the average of 100 consecutive images along the leg E) to less than 1.0 at the South point (point S) of
the leg. As expected for optically thin clouds, the under investigation. As given by Descloitres et al. (1995), this procedure removes the noise due to albedo varies almost linearly against the optical
depth (see for instance Stephens, 1978; Arking and cloud heterogeneity across the POLDER CCD array. The observed peak located around view Childs, 1985). The retrieved albedo decreases from
0.28 at E to approximately 0.05 at S (see Fig. 3b). zenith angle −20° corresponds to the cloudbow (scattering angle ~140°) and the second one more In order to check the sensitivity of cloud optical
thickness and albedo retrievals to cloud micro- intense observed at view zenith angle 20° in our case is the backscattered radiation (scattering physics, the retrieval was also performed using a
cloud droplet effective radius of 6 mm. As expected, angle 180°). As illustrated in this figure, the angu-lar distribution of the simulated bidirectional the retrieved values are only slightly lower and
their spatial distribution (not presented here) is reflectance is highly sensitive to the cloud micro-physics in the observable domain of scattering obviously very similar to Fig. 3. Indeed,
computa-tions show that the relacomputa-tionship between bidirec- angles. In the cloud optical thickness retrieval from POLDER measurements, the optical thick-tional reflectance, cloud optical thickness and
albedo are almost not dependent on the droplet ness of the plane-parallel model is adjusted to make the modeled reflectance match the average size (see Section 8).
More interestingly, as already explained in observed reflectance (0.182 for the present case). However, the angular distribution of the plane-Section 3, the multidirectional capability of
POLDER allows to quantify the angular disper- parallel bidirectional reflectance may still be very different from the observed one. The smoothness sion of the cloud property retrievals. An example
of relative angular standard deviation of cloud of the angular distribution depends on the cloud droplet size. The smaller the droplet size, the optical thickness is reported in Fig. 4 for an
effec-tive radius of 12 mm and 6 mm. broader the peaks. In addition, the relative ampli-tude of the 2 peaks is also highly sensitive to the On the maps in Fig. 4, a greater relative angular
standard deviation indicates a less adequate cloud droplet size. The relative angular standard devi-ation of the retrieved cloud optical thickness (and model. As shown in Fig. 4a, when inverting the
POLDER reflectances assuming a 12 mm effective of the retrieved cloud albedo) can significantly increase if the selected cloud droplet model is radius, a large part of the leg presents relatively
low values of relative angular standard deviations, inadequate (Fig. 4).
In Fig. 6, 2 cloud droplet models were used i.e., less than 5–6%. On the contrary, in Fig. 4b
the map shows a wide central band with very high to retrieve the cloud optical thickness from reflectance measurements in the solar plane. This values. As noted in Subsection 2.2 and shown in
Fig. 2, this part of the POLDER images is some- angular optical thickness is compared to the one retrieved using the whole field-of-view of the times observed in view conditions that correspond
to strong anisotropic features like the backscatter instrument (2.56 for r
Fig. 3. (a) Cloud optical thickness and (b) cloud albedo maps established from airborne POLDER measurements acquired on 26 June 1997 between 14:27 and 14:32 UTC. The effective radius of droplet size distribution is 12 mm.
Fig. 4. Relative angular standard deviation (in %) of cloud optical thickness maps established from airborne POLDER measurements acquired on 26 June 1997 between 14:27 and 14:32 UTC. The effective radius of droplet size distribution is (a) 12 mm and (b) 6 mm.
variability of the optical thickness is lower for r
e=12 mm than for re=6 mm. The 12 mm cloud droplet size distribution is a more suitable cloud model in this case study.
4.2. T he 9 July 1997 case study
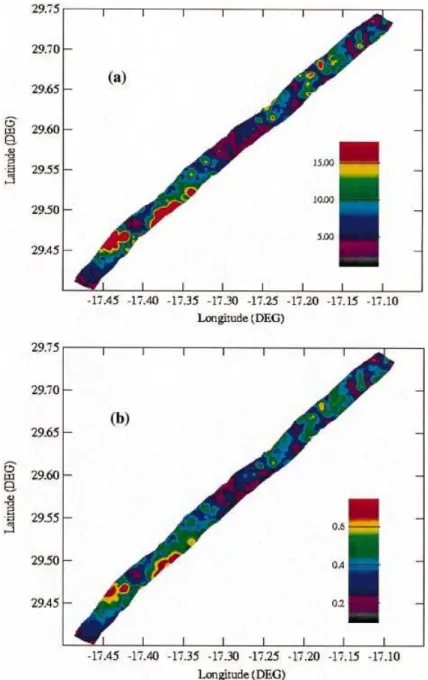
During the ACE-2 mission 06 on 9 July 1997, the Dornier was flown over extended stratocumu-lus clouds thicker than during mission 02. The cloud deck was sampled along 50-km legs. In this section we analyze a leg corresponding to the Northwest part of the square pattern performed on 9 July 1997 (Brenguier et al., 2000). It was sampled between 14:39 and 14:48 UTC. The
Fig. 5. Comparison between the measured cloud
bidirec-procedure presented in the previous section was
tional reflectance (in the solar plane) and theoretical ones
applied to this case. The best agreement between
obtained using droplet effective radius of 6 mm or 12 mm.
The simulations correspond to the 26 June 1997 case observed and simulated bidirectional reflectance
study. The surface albedo is fixed to 0.05. The mean is obtained for droplet size distributions with an retrieved cloud optical depth is equal to 2.56 and 2.97, effective radius ranging from 6 mm to 10 mm. As for re=6 mm and re=12 mm, respectively. shown in Fig. 7, these 2 models minimize the angular variability of the retrieved cloud optical thickness. As noted previously and displayed in this figure, the mean retrieved cloud optical thick-ness is almost not dependent on the model drop size since the mean values are 7.02 and 7.68 for re=6 mm and re=10 mm, respectively.
The cloud optical thickness and cloud albedo
Fig. 6. Cross-sections along the principal plane of the retrieved cloud optical thickness using 2 droplet effective radius of 6 mm or 12 mm. The simulations correspond to the 26 June 1997 case study. The surface albedo is fixed to 0.05. The mean cloud optical depths retrieved using the whole field-of-view of POLDER (solid lines) are equal to 2.56 and 2.97, for re=6 mm and re=12 mm, respectively.
Fig. 7. Cross-sections along the principal plane of the retrieved cloud optical thickness using 3 droplet effective
12 mm). This clearly illustrates the error that is
radius of 6 mm, 10 mm, and 12 mm. The simulations
corre-made when the cloud optical thickness is retrieved
spond to the 9 July 1997 case study. The surface albedo
from one single view angle. According to Fig. 5, is fixed to 0.05. The mean cloud optical depths retrieved the cloud optical thickness is notably underesti- using the whole field-of-view of POLDER (solid lines) mated in the backscatter direction and over- are equal to 7.02, 7.68, and 8.01, for re=6 mm, re=
10 mm, and re=12 mm, respectively.
maps of the ~50 km×3 km scenes are derived to approximately 0.75. The optical thickness and albedo values are definitely greater than the values from POLDER reflectance, assuming r
e=10 mm,
and are reported in Fig. 8. The color scale (from derived on 26 June 1997. The spatial distribution of cloud properties also appears much more black to red) represents a range of optical
thick-ness from 0 to 18.0 or a range of albedo from 0 heterogeneous than in the previous case.
Fig. 8. (a) Cloud optical thickness and (b) cloud albedo maps established from airborne POLDER measurements acquired on 9 July 1997 between 14:39 and 14:48 UTC. The effective radius of droplet size distribution is 10 mm.
The overall relative angular standard deviation Moreover, Pawlowska et al. (1999) show that the vertically uniform optical thickness derived from (not reported here) of the retrieved parameters is
low ( less than 5–6%) for most of the leg. Low POLDER compares well with the microphysical measurements. This optical thickness is used to values of relative angular standard deviations are
mostly found where the cloud optical depth and validate the parameterization based on the adia-batic vertical profile of the microphysics proposed albedo are moderate. The deviation is more
signi-ficant where the cloud is more heterogeneous with by Brenguier et al. (1999).
The other issue is the derivation of droplet sharp variations of optical thickness. In those
particular cases the cloud deck locally departs effective radius from remote sensing data. Several authors have investigated methods based on multi-from the plane-parallel approximation, regardless
of the droplet size. wavelength shortwave measurements to simul-taneously retrieve the cloud optical thickness and the effective radius (Nakajima and King, 1990; 4.3. Discussion
Nakajima et al., 1991; Han et al., 1994; Brenguier et al., 1999). Sensitivity studies on the effect of The angular dispersion of cloud optical
thick-ness derived from multidirectional measurements vertical heterogeneity on the retrieval of effective radius suggest that this radius is typically of cloud radiances with POLDER on board the
Dornier are used to estimate the effective radius 80–100% of the radius at cloud top (Nakajima and King, 1990; Brenguier et al., 1999). The pre-of droplets. Each cloud target (~150 m)2 is
assumed homogeneous and vertically uniform sent feasibility study is mainly based on the angu-lar dependence of the reflected radiance (position with respect to the droplet size distribution. This
procedure is based on the Independent Pixel and intensity of the cloudbow and backscatter peak; see Fig. 4). These features are mainly driven Approximation and was validated by Descloitres
et al. (1995, 1998). This enables to model the by single scattering (Hansen and Travis, 1974). Consequently the proposed approach is a retrieval cloud heterogeneity at spatial scales of a few
hundred meters (Figs. 3, 8). of the upper few units of cloud optical thickness located at the cloud top.
An important issue is the assumption of vertical
homogeneity. Stratocumulus clouds have signifi- The present results show that a 12 mm effective radius is a suitable cloud droplet size model in cant vertical heterogeneity and many authors have
shown that liquid water content and effective the pure marine case study (26 June) while an effective radius of 6 mm to 10 mm is more suitable radius increase with altitude from cloud base to
cloud top (Slingo et al., 1982; Stephens and Platt, to the polluted case (9 July). Assuming no vari-ations of cloud morphological aspect, a verifica-1987). More recently Brenguier et al. (1999) have
shown the adiabatic stratified plane-parallel model tion of the indirect effect of aerosols (the so-called Twomey effect) may be reduced to a verification is more realistic than the vertically uniform
plane-parallel model to parameterize the stratocumulus of the decrease of droplets size via an increase of anthropogenic aerosol concentration. In that cloud optical thickness in global climate models
(GCM). Brenguier et al. (2000) validate the adia- sense, these preliminary results can be interpreted as a confirmation of the indirect effect of aerosols. batic stratified plane-parallel model from in situ
and remote sensing measurements collected during They are consistent with the extended analysis presented by Brenguier et al. (2000; see their the ACE-2 CLOUDYCOLUMN field campaign.
This result is important for the simulation of cloud Fig. 5) who show a first experimental evidence of the indirect effect at the scale of a cloud system. effects in GCMs that include cloud geometrical
thickness as a diagnostic parameter. Nonetheless, these results do not make our procedure
question-able. Simulations by Nakajima and King (1990) 5. ADEOS-POLDER daily retrievals: the 26 June 1997 case study
suggest that the derived vertically uniform optical thickness differs from the true optical thickness by
no more than 3% for typical vertically inhomo- This section presents the ADEOS-POLDER data acquired on 26 June 1997 along 2 ADEOS geneous conditions. Calculations performed by
main results (cloud amount, cloud optical thick- and cloud optical thickness maps (Fig. 9a,b) con-firm this synoptic situation. These cloud properties ness and shortwave broadband albedo) of the
‘‘ERB & clouds’’ operational algorithm are discus- are highly variable in space. The proportion of partly cloudy pixels that can correspond to sed in details for a ~2500 km×2500 km area
corresponding to the ACE-2 region (Fig. 1). The cumulus, scattered stratocumulus or cloud edges is important. Note that ‘‘partly cloudy’’ has not original contribution of POLDER regarding these
properties is emphasized. the same meaning for POLDER as for a usual radiometer. In the case of the POLDER cloud In the operational ‘‘ERB & clouds’’ processing,
the cloud detection algorithm is a threshold detection algorithm, some pixels can be labeled as cloudy for some directions and clear for others method applying several sequential tests for the
presence of clouds. Parol et al. (1999) argue about (Buriez et al., 1997; Parol et al., 1999). Over the ACE-2 region, the derived values of cloud optical the adjustments of the different tests and favorably
compare the POLDER cloud detection algorithm depth and shortwave albedo are quite low. The cloud optical depth ranges from 1.0 to approxi-to the Dynamic Clustering Method applied approxi-to
Meteosat data (Se`ze and Desbois, 1987). The tests mately 8.0 and the shortwave albedo is less than ~0.25 (see Fig. 9c). Because of 2 very different are applied to each individual pixel (6.2 km) and
for every view direction. The cloud cover is deter- spatial scales ((56 km)2 in this case and (~150 m)2 for the airborne POLDER) an exact comparison mined direction by direction and, and the
cloudi-ness is then averaged (Buriez et al., 1997). between these values and those obtained from the airborne data is not realistic. However, these Fig. 9 shows the cloud cover, the cloud optical
thickness and the shortwave broadband albedo values are consistent with low optical depths and spectral albedoes presented in Subsection 4.1. (see Subsection 3.2) for the ACE-2 region of
interest. The cloud cover presented in Fig. 9a is These low values are associated to high values of spatial and angular dispersion of cloud optical obtained by spatial and angular averaging for
each POLDER super-pixel (~9×9 pixels). depth. This is emphasized on Figs. 9d,e that respectively present the relative spatial and angu-Similarly, the cloud optical thickness shown in
Fig. 9b corresponds to a spatial and angular aver- lar standard deviations of the optical thickness. As explained in Subsection 3.2, the cloud is age on the cloudy pixels within the super-pixel.
All large cloud structures associated with the main assumed to be a plane-parallel layer composed of droplets with an effective radius of 10 mm in the climate processes are easily identified and their
location is consistent with what we would expect level-2 ‘‘ERB & clouds’’ operational scheme (Buriez et al., 1997). Consequently, the relative for this time of year: for instance the inter-tropical
convergence zone (ITCZ) along the 10°N parallel angular standard deviations increase if this approximation is inadequate (Fig. 9e). Note that, and the large clear-sky area over the desert of
Sahara. The spatial distribution of cloud cover is in Figs. 9d,e, the color scale upper limits are very different. Generally, the spatial deviation is twice mainly linked to the meteorological synoptic
situ-ation at this date. In particular, a cyclone persisted higher than the angular deviation.
A first reason for a high relative angular stan-over Western Europe at the end of June ( Verver
et al., 2000). High cloudiness is observed off the dard deviation is that the measured angular distri-bution can be very different from the plane-parallel coast of Spain over the Atlantic Ocean.
The spatial distribution of cloud optical thick- cloud model depending on the cloud brokeness, because of cloud shape and mutual shadowing ness and shortwave albedo is consistent with the
observed structures of cloud cover and their effects (Bre´on, 1992; Loeb et al., 1997; Loeb and Coakley, 1998). Another reason is that the micro-expected regional reflective characteristics. There
are some high values all along the ITCZ with physical model is not suitable (Section 4). For instance, it is well known that cirrus cloud proper-some very bright cloud cells. High values also
appear in mid-latitude depression areas (off Spain). ties are very sensitive to ice crystal shape and orientation (Mishchenko et al., 1996). However, More extended than airborne POLDER
obser-vations, the ADEOS-POLDER images show that the study of ice clouds is far beyond the scope of ACE-2. So the rest of the analysis focuses on the low broken stratocumulus clouds covered the
Fig. 9. Image constructed from POLDER level-2 (a) cloud cover, ( b) cloud optical thickness and (c) shortwave albedo derived for 26 June 1997 over the ACE-2 region. (d) and (e) are respectively constructed from relative spatial standard deviation and relative angular standard deviation of cloud optical thickness. (f ) is the thermodynamic phase index (red is for liquid droplets, dark blue for ice crystals, green for mixed phase, and grey for ‘‘clear’’ and ‘‘not computed’’ (Parol et al., 1999).
A thermodynamic phase index (Fig. 9f ) derived curves associated to the 2 cloud fraction cases are not significantly different. However, the magnitude from polarization measurements at 0.865 mm is
used to identify the POLDER pixels composed of of the standard deviations observed in overcast conditions is lower and the optical thickness is liquid water clouds (further details can be found
in Parol et al., 1999). Fig. 10 presents the variabil- larger.
Figs. 10a,c confirm that large values of cloud ity rates as a function of the cloud optical thickness
only for these cloud pixels labeled ‘‘droplets’’. In optical thickness give moderate values of relative spatial standard deviation, while these get more order to assess the effect of brokeness on these
curves, overcast situations are separated from the scattered as the cloud optical depth gets small. In the case of broken cloudiness, small spatial stan-other ones. For the purpose of this analysis, a
POLDER super-pixel is considered as overcast if dard deviation is always related to small optical thickness (Fig. 10a).
the cloud fraction is greater than 0.95. Practically,
overcast super-pixels are mainly located along the The relative angular standard deviation behaves differently (Figs. 10b,d). Low angular standard ITCZ and the southern part of the cyclone
Fig. 10. (a) Relative spatial standard deviation and ( b) relative angular standard deviation of cloud optical thickness versus the optical thickness for super-pixels labeled ‘‘droplets’’ in Fig. 9f; (a) and (b) are non-overcast super-pixels and (c) and (d) are overcast super-pixels.
thickness. Fig.10 shows that the angular dispersion On the contrary, the relative angular deviation decreases with cloud fractional cover. For small is not necessarily correlated to the spatial
variabil-ity, i.e., to the cloud heterogeneity. cloud amounts, the high value of the relative angular standard deviation is indicative of the Furthermore, the 2 relative standard deviations
have been plotted as a function of the cloud cover departure of these pixels from the 10 mm plane-parallel cloud model. This highlights the prime for the cloudy pixels labeled ‘‘droplets’’ (Fig. 11).
The variations of the 2 parameters against the interest of POLDER multi-angular capability. Different cloud models could be investigated in cloud fractional cover are definitely different. The
overall behavior of the spatial deviation can be order to minimize the retrieved angular dispersion. Further research is clearly needed. For overcast described by an arch whereas the angular
devi-ation varies almost linearly. Not surprisingly, the conditions the relative angular standard deviation tends to nearly zero. Although these overcast relative spatial standard deviation of cloud optical
thickness is maximum for a cloud amount close super-pixels (composed of ~9×9 pixels) are not close to homogeneous clouds, they act on average to 0.5. For overcast situations the spatial standard
deviation is still high and of the same order of as a plane-parallel model with re=10 mm. This extends to larger spatial scales some previous magnitude as for broken cloudiness conditions.
Fig. 11. Relative spatial and angular standard deviations of cloud optical thickness versus the cloud fractional cover for super-pixels labeled ‘‘droplets’’ in Fig. 9f. The lines are the mean curves.
results obtained using the airborne POLDER tionality of POLDER measurements is then a useful constraint for the selection of cloud para-instrument (Descloitres et al., 1995, 1998).
However, the suitability of the plane-parallel cloud meters. POLDER allows to determine the cloud optical thickness under some hypotheses, and also model does not imply that the retrieved cloud
optical thickness is accurate. For instance, for enables to test the validity of these hypotheses. As mentioned in the introduction, numerous studies marine stratocumulus clouds, Cahalan (1994)
found that the cloud albedo could be approxi- have derived the cloud optical thickness from space using the plane-parallel approximation and mated properly by a plane-parallel model having
an optical depth 30% smaller than the actual a prescribed cloud droplet size. However, up to now only few direct observations of cloud bidirec-mean optical depth. In the present study, the
derived cloud optical depth has to be considered tional reflectance have been compared to theoret-ical radiation fields calculated using the plane-as an ‘‘effective’’ optical depth.
parallel model (see for instance Stuhlmann et al., 1985; Descloitres et al., 1998).
This paper presented results related to such
6. Conclusion
comparisons within the framework of the ACE-2 Experiment. Cloud optical thickness and cloud Unlike the usual scanning radiometers, the
POLDER instrument provides 10 or more quasi- albedo retrieved from bidirectional reflectances measured by ADEOS-POLDER and its airborne simultaneous reflectance measurements of any
cloud scene. It is always possible to adjust a multi- simulator were presented. First, particular atten-tion was given to airborne POLDER data parameter cloud model (i.e., microphysical and
macrophysical parameters) to match one single acquired on 2 golden days of the campaign 26 June and 9 July 1997. Stratocumulus clouds sampled bidirectional observation of a given cloud scene.
On the contrary, constraining such a model to during these 2 days had developed in air masses of different origins (Brenguier et al., 2000). 26 June adequately match a set of bidirectional
was the last day of a marine to polluted air contribution of POLDER regarding these proper-ties was emphasized.
transition. For the experimental characterization
The cloud optical thickness and cloud albedo of the aerosol indirect effect, thin stratocumulus
values are very low and are thus consistent with clouds had been selected in priority during ACE-2,
airborne POLDER retrievals. However, these low because thin clouds are more sensitive to a change
values are associated to high values of spatial and in droplet concentration. As expected for the
angular variability of cloud optical thickness that 26 June flight mission, the cloud optical thickness
means to high spatial cloud macrophysical or values are very low, ranging typically between 1
microphysical inhomogeneity. In the ‘‘ERB & and 5 for the leg under investigation in this paper.
clouds’’ algorithm, a cloud water droplet model However, the optical thickness values retrieved on
with a prescribed effective radius of 10 mm is used 9 July are approximately 2–3× larger.
to operationally derive cloud optical thickness Even though the cloud optical thickness and
from ADEOS-POLDER data. Consequently, cloud albedo retrievals are shown to be almost when inverting the POLDER reflectances, the not dependent on cloud droplet size in visible optical thickness is the only cloud property that range channels, the multidirectional capability of is allowed to vary. Once again, the multiangular POLDER is demonstrated to be very useful to capability of POLDER allows testing the standard select the cloud microphysical model (in terms of cloud droplet model. Excluding the ice cloud cases effective radius of droplets). The relative angular for which the 10 mm droplet model seems definitely standard deviation of the retrieved parameters inadequate (Descloitres et al., 1998; Parol et al., increases if the cloud microphysical model is inad- 1999), it appears that the angular standard devi-equate. The relative angular standard deviations ations are not straighforwardly related to the are more sensitive to the microphysical model as spatial standard deviations as measured by POLDER at ~56×56 km2 scale. Indeed, the POLDER observed cloud scenes in view
condi-variations of these 2 parameters against the cloud tions that correspond to strong anisotropic
fea-cover are definitely different. This indicates that tures as the backscatter maximum and the
the departure of the observations from the bidirec-cloudbow (~140° scattering angle). Taking
tional reflectance variations of the cloud model advantage of this opportunity, we found that a
selected for the inversion is not a tracer of the 3D 12 mm cloud droplet size distribution was a
suit-optical thickness distribution. able cloud model in the pure marine cloud case
study (26 June). For the polluted case (9 July), the
mean retrieved effective radius of droplets is of 7. Acknowledgements
the order of 6–10 mm. This result can be
inter-The authors are very grateful to Franc¸oise preted as a confirmation of the indirect effect of
Hennequart for her help in processing raw data aerosols. It is consistent with the significant
of the airborne POLDER. They also gratefully increase in droplet concentration measured in
acknowledge 2 anonymous referees for their very polluted marine clouds compared to pure marine
helpful comments and suggestions. This study was clouds (Brenguier et al., 2000). Further
investi-supported by the European Community under gations and comparisons to in-situ microphysical
grant ENV4-CT95-0117, CNES, Re´gion Nord-measurements are needed.
Pas De Calais, and Pre´fecture du Nord through The last section of this paper presented the
EFRO. Some results in this paper were obtained recently validated and processed satellite
using CNES’s POLDER onboard NASDA’s POLDER data acquired along 2 ADEOS orbits
ADEOS. on 26 June. The ACE-2 polluted cases (during the
first couple of weeks of July) were not documented
8. Appendix A
by ADEOS-POLDER that ended acquisition on 29 June after an unexpected failure of the platform
Basic formula for cloud optical thickness retrieval: solar panel. The main results (cloud amount, cloud
droplet size eVect optical thickness and shortwave albedo) of the
‘‘ERB & clouds’’ operational algorithm were dis- For a given drop size distribution n(r), where n(r) is the density of droplets with radius r per cussed for the ACE-2 region and the original
unit of volume, cloud optical thickness is given wavelength eq. (8.6) reduces to: by: t(l)#t=3 2 LWP r e , (8.7) t(l)=
P
H 0P
2 0 Q ext(x)pr2n(r) dr dh, (8.1)where LWP is in (g m−2) and re is in micrometers (Fouquart et al., 1990).
where x=2pr/l is the size parameter, and H is
Two cloud layers have approximately the same the cloud layer geometrical thickness. The
effici-reflection properties if they have the same values ency factor for extinction Qext(2pr/l) is determined for scaled optical thickness and scaled single-from Mie theory (Van de Hulst, 1957). Q
ext(2pr/l) scattering albedo ( Van de Hulst, 1980). The simi-is a function of r, wavelength l, and refractive
larity equation index, m (Hansen and Travis, 1974). The variation
of Q
ext(2pr/l) with size parameter x is small par- t(1−v˜
0g)=t∞(1−v˜ ∞0g∞) (8.8) ticularly for large x and asymptote to a value of
allows us to get t∞ from t and r (the asymmetry approximately 2. This is relevant for spherical
factor g and the single-scattering albedo v˜ 0 are droplets of radius r large compared to the
functions of droplet radius and wavelength; they wavelengths.
are calculated using Mie theory and optical con-If the effective radius of droplet size distribution
stants of liquid water). is introduced (Hansen and Travis, 1974) as:
The effect of drop size on cloud optical thickness retrieval from a single angular measurement of 0.865 mm POLDER reflectance can be estimated re=
P
2 0 pr3n(r) drP
2 0 pr2n(r) dr, (8.2) from this equation. Table 1 presents the relative difference (t∞−t)/t normalized to the cloud optical thickness retrieved assuming the 10 mm effective radius. In the same way, (t∞−t)/t represents the and the expression of the liquid water content, w
relative error caused by 10 mm effective radius (g m−3), as
assumption used in the spaceborne POLDER operational analysis. Table 1 also lists the values w=
P
20 4
3pr3rwn(r) dr, (8.3) of Q
ext, v˜ 0, and g for the different cloud droplet effective radii used in this study.
eq. (8.1) becomes: In this paper cloud optical thickness is derived from measured reflected radiance assuming the t(l)=3Q9 ext
4rw
P
H 0w
redh, (8.4) plane-parallel approximation and then it is appliedto the plane-parallel model to infer the cloud albedo. From the similarity principles ( Van de where r
w is the liquid water density (rw= Hulst, 1980), the so-estimated plane-parallel 103 kg m−3) and Q9 ext is the average of Qext over
albedo is not strongly dependent on drop size the droplet size distribution.
distribution so long as the same distribution is The liquid water path LWP (g m−2) is formally
used in the 2 steps of the analysis. defined as:
Table 1. EVect of drop size on cloud optical thick-LWP=
P
H0
w dh. (8.5)
ness retrieval f rom a single POL DER bidirectional reflectance measurement at 0.865 mm
Assuming that the cloud is vertically uniform with respect to drop-size distribution, the cloud r
e(mm) Qext v˜ 0 g (t∞−t)/t
optical thickness is linked to liquid water path
and effective radius by: 6 2.2 0.999970 0.83804 −0.109 10 2.1 0.999953 0.8557 0 12 2.1 0.999943 0.85831 0.018
t(l)=3Q9 ext
4rwreLWP. (8.6)
The values of Qext, v˜0, and g for the different cloud droplet effective radii used in this study are also listed.
REFERENCES
Arking, A. and Childs, J. D. 1985. Retrieval of cloud deduced from photographs of the sun glitter. Bull. of the Scripps Institute of Oceanography 6, 401–488. cover parameters from multispectral satellite images.
Davis, J. M. and Cox, S. K. 1982. Reflected solar radi-J. Climate Appl. Meteor. 24, 322–333.
ances from regional scale scenes. J. Appl. Meteor. 21, Baldwin, D. G. and Coakley Jr., J. A. 1991. Consistency
1698–1712. of Earth Radiation Budget Experiment bidirectional
Deschamps, P. Y., Bre´on, F. M., Leroy, M., Podaire, A., models and the observed anisotropy of reflected
sun-Bricaud, A., Buriez, J. C. and Se`ze, G. 1994. The light. J. Geophys. Res. 96, 5195–5207.
POLDER mission: instrument characteristics and Barsch, B. and Bakan, S. 1993. First experiences with
scientific objectives. IEEE T rans. Geosci. Remote Sens-the new array spectrometer OVID. In: ARKT IS 1993
ing 32, 598–615. field phase report. Ber. ZMK(ed. Bruemmer, B), Ser. A,
Descloitres, J., Parol, F. and Buriez, J. C. 1995. On the 11, 147–156.
validity of the plane-parallel approximation for cloud Bre´on, F.-M. 1992. Reflectance of broken cloud fields:
reflectances as measured from POLDER during simulation and parameterization. J. Atmos. Sci. 49,
ASTEX. Ann. Geophysicae 13, 108–110. 1221–1232.
Descloitres, J., Pawlowska, H., Pelon, J., Brenguier, J. L., Brenguier, J.L., Chuang, P. Y., Fouquart, Y., Johnson,
Parol, F., Buriez, J. C. and Flamant, P. 1996. Experi-D. W., Parol, F., Pawlowska, H., Pelon, J., Schu¨ller, L.,
mental retrieval of cloud optical thickness during Schro¨der, F. and Snider, J. 2000. An overview of the
EUCREX: comparison of three approaches. Proc. of ACE-2 CLOUDYCOLUMN closure experiment.
the 12th International Conference on Clouds and precip-T ellus 52B, 815–827.
itation. Zurich, Switzerland. Page Bros. (Norwich), Brenguier, J. L., Pawlowska, H., Schu¨ller, L.,
Preus-pp. 394–397. ker, R., Fischer, J. and Fouquart, Y. 1999. Radiative
Descloitres, J., Buriez, J. C., Parol, F. and Fouquart, Y. properties of boundary layer clouds: optical thickness
1998. POLDER observations of cloud bidirectional and effective radius versus geometrical thickness and
reflectances compared to a plane-parallel model using droplet concentration. J. Atmos. Sci., in press.
the ISCCP cloud phase functions. J. Geophys. Res. Brogniez, G., Parol, F., Buriez, J. C. and Fouquart, Y.
103, 11,411–11,418. 1992. Bidirectional reflectances of Cirrus clouds
Diner, D. J., Beckert, J. C., Reilly, T. H., Bruegge, C. J., modelized from observations during the international
Conel, J. E., Kahn, R., Martonchik, J. V., Ackerman, cirrus experiment 89. In: Current Problems in
Atmo-T. P., Davies, R., Gerstl, S. A. W., Gordon, H. R., spheric Radiation, Proc. of the IRS’92, Tallin, Estonia,
Muller, J.-P., Myneni, R., Sellers, R. J., Pinty, B. and 3–8 August 1992, eds: S. Keevallik and O. Karner, Verstraete, M. M. 1998. Multiangle Imaging Spectro-133–136. Radiometer (MISR) description and experiment over-Buriez, J. C., Vanbauce, C., Parol, F., Goloub, P., view. IEEE T rans. Geosci. Rem. Sens. 36, 1072–1087.
Herman, M., Bonnel, B., Fouquart, Y., Couvert, P. Fouquart, Y., Buriez, J. C., Herman, M. and Kandel, and Se`ze, G. 1997. Cloud detection and derivation of R. S. 1990. The influence of clouds on radiation: a cloud properties from POLDER. Int. J. Remote Sens- climate-modelling perspective. Rev. of Geophys. 28, ing 13, 2785–2813. 145–166.
Cahalan, R. F. 1994. Bounded cascade clouds: albedo Hagolle, O., Goloub, P., Deschamps, P.-Y., Cosnef-and effective thickness. Nonlin. Proc. Geophys. 1, roy, H., Briottet, X., Bailleul, T., Nicolas, J.-M., 156–167. Parol, F., Lafrance, B. and Herman, M. 1999. Results Cahalan, R. F., Ridgway, W., Wiscombe, W. J., of POLDER in-flight calibration. IEEE T rans. Geosci.
Gollmer, S. and Harshvardhan. 1994. Independent Remote Sensing 37, 1550–1567.
pixel and Monte Carlo estimates of stratocumulus Han, Q., Rossow, W. B. and Lacis, A. A. 1994. Near-albedo. J. Atmos. Sci. 51, 3776–3790. global survey of effective droplet radii in liquid water Cess, R. D. et al. 1990. Intercomparison and interpreta- clouds using ISCCP data. J. Climate 7, 465–497.
tion of climate feedback processes in 19 atmospheric Hansen, J. E. 1971. Multiple scattering of polarized light general circulation models. J. Geophys. Res. 95, in planetary atmospheres. Part II: sunlight reflected 16,601–16,610. by terrestrial water clouds. J. Atmos. Sci. 28, Cess, R. D. et al. 1996. Cloud feedback in atmospheric 1400–1426.
general circulation models: an update. J. Geophys. Res. Hansen, J. E. and Travis, L. D. 1974. Light scattering in 101, 12,791–12,794. planetary atmospheres. Space Sci. Rev. 16, 527–610. Charlson, R. J., Schwartz, S. E., Hales, J. M., Cess, R. D., Harrison, E. F., Minnis, P., Barkstrom, B. R.,
Ramana-Coackley Jr., J. A., Hansen, J. E. and Hofmann, D. J. than, V., Cess, R. D. and Gibson, G. G. 1990. Seasonal 1992. Climate forcing by anthropogenic aerosols. variations of cloud radiative forcing derived from the Science 255, 423–430. Earth Radiation Budget Experiment. J. Geophys. Res.
95, 18,687–18,703. Cox, C. and Munk, W. 1956. Slopes of the sea surface
Houghton, J. T., Jenkins, G. J. and Ephraums, J. J. (eds.). Pelon, J. and Schu¨ller, L. 1999. Microphysical and radiative properties of stratocumulus clouds. The 1990. Climate change: the IPCC scientific assessment.
World Meteorological Organization/United Nations EUCREX mission 206 case study. Atmos. Res., in press.
Environment Programme, Cambridge University
Press, 364 pp. Raes, F., Bates, T., McGovern, F. and Van Liede-kerke, M. 2000. The second Aerosol Chatacterization Kandel, R. S., Monge, J. L., Viollier, M., Pakhomov,
L. A., Adasko, V. I., Reitenbach, R. G., Raschke, E. Experiment (ACE-2): general context and main results. T ellus 52B, 111–126.
and Stuhlmann, R. 1994. The ScaRaB project: Earth
radiation budget observations from the Meteor satel- Ramanathan, V., Cess, R. D., Harrison, E. F., Minnis, P., Barkstrom, B. R., Ahmad, E. and Hartmann, D. 1989. lites, World Space Congress (Washington)-COSPAR
symp. A.2-S. Adv. Space Research 14(1), 47–54. Cloud radiative forcing and climate: results from the earth radiation budget experiment. Science 243, 57–63. King, M. D., Kaufman, Y. J., Menzel, W. P. and Tanre´, D.
1992. Remote sensing of cloud, aerosol, and water Rossow, W. B. and Schiffer, R. A. 1991. ISCCP cloud data products. Bull. Amer. Meteor. Soc. 72, 2–20. vapor properties from the moderate resolution
imaging spectrometer (MODIS). IEEE T rans. Geosci. Senior, C. A. and Mitchell, J. F. B. 1993. Carbon dioxide and climate. The impact of cloud parameterisation. Rem. Sens. 30, 2–27.
Kobayashi, T. 1993. Effects due to cloud geometry on J. Climate 6, 393–418.
Slingo, A., Nicholls, S. and Schmetz, J. 1982. Aircraft biases in the aldebo derived from radiance
measure-ments. J. Climate 6, 120–128. observations of marine stratocumulus during JASIN. Quart. J. Roy. Meteor. Soc. 108, 833–856.
Leroy, M., Deuze, J. L., Breon, F. M., Hautecoeur, O.,
Herman, M., Buriez, J. C., Tanre, D., Bouffies, S., Spinhirne, J. D., Hart, W. D. and Hlavka, D. L. 1996. Cirrus infrared parameters and short-wave reflectance Chazette, P. and Roujean, J. L. 1997. Retrieval of
atmospheric properties and surface bidirectional relations from observations. J. Atmos. Sci. 53, 1438–1458.
reflectances over the land from POLDER/ADEOS.
J. Geophys. Res. 102, 17,023–17,037. Stamnes, K., Tsay, S. C., Wiscombe, W. and Jaya-weera, W. 1988. Numerically stable algorithm for dis-Loeb, N. G., Varnai, T. and Davies, R. 1997. The effect
of cloud inhomogeneities on the solar zenith angle crete-ordinate-method radiative transfer in multiple scattering and emitting layered media. Appl. Opt. 27, dependence of nadir reflectance. J. Geophys. Res. 102,
9387–9395. 2502–2509.
Stephens, G. L. 1978. Radiation profiles in extended Loeb, N. G. and Coakley Jr., J. A. 1998. Inference of
marine stratus cloud optical depths from satellite water clouds. II: parameterization schemes. J. Atmos. Sci. 35, 2123–2132.
measurements: does 1D theory apply? J. Climate 11,
215–233. Stephens, G. L. and Platt, C. R. M. 1987. Aircraft obser-vations of the radiative and microphysical properties Mishchenko, M. I., Rossow, W. B., Macke, A. and Lacis,
A. A. 1996. Sensitivity of cirrus cloud albedo, bidirec- of stratocumulus and cumulus cloud fields. J. Climate Appl. Meteor. 26, 1243–1269.
tional reflectance and optical thickness retrieval
accu-racy to ice particle shape. J. Geophys. Res. 101, Stuhlmann, R., Minnis, P. and Smith, G. L. 1985. Cloud bidirectional reflectance functions: a comparison of 16,973–16,985.
Nakajima, T. and King, M. D. 1990. Determination of experimental and theoretical results. Appl. Opt. 24, 396–401.
the optical thickness and effective particle radius of
clouds from reflected solar radiation measurements. Vanbauce, C., Buriez, J. C., Parol, F., Bonnel, B., Se`ze, G. and Couvert, P. 1998. Apparent pressure derived from Part I: theory. J. Atmos. Sci. 47, 1878–1893.
Nakajima, T., King, M. D., Spinhirne, J. D. and Radke, ADEOS-POLDER observations in the oxygen A-band over ocean. Geophys. Res. L ett. 25, 3159–3162. L. F. 1991. Determination of the optical thickness and
effective particle radius of clouds from reflected solar Van de Hulst, H. C. 1957. L ight scattering by small particles.John Wiley and Sons, New York, 470 pp. radiation measurements. Part II: marine
stratocumu-lus observations. J. Atmos. Sci. 48, 728–750. Van de Hulst, H. C. 1980. Multiple light scattering, tables, formulas, and applications, vol. 1. Academic Press, Parol, F., Buriez, J. C., Cre´tel, D. and Fouquart, Y. 1994.
The impact of cloud inhomogeneities on the Earth 739 pp.
Verver, G., Raes, F., Vogelezang, D. and Johnson, D. radiation budget: The 14 October 1989 ICE convective
2000. The second Aerosol Characterization Experi-cloud case study. Ann. Geophysicae 12, 240–253.
ment (ACE-2): meteorological and chemical context. Parol, F., Buriez, J. C., Vanbauce, C., Couvert, P.,
T ellus 52B, 126–140. Se`ze, G., Goloub, P. and Cheinet, S. 1999. First results
Wielicki, B. A. and Barkstrom, B. R. 1991. Cloud and of the POLDER ‘‘Earth Radiation Budget and
the earth’s radiant energy system (CERES): an earth Clouds’’ operational algorithm, IEEE T rans. Geosci.
observing system experiment. Second Symp. on Global Rem. Sens. 37, 1597–1612.
change studies. New Orleans, LA, Amer. Meteor. Pawlowska, H., Brenguier, J. L., Fouquart, Y.,
Armbrus-Soc., pp. 11–16. ter, W., Descloitres, J., Fischer, J., Flamant, C.,