Publisher’s version / Version de l'éditeur:
SPIE Electronic Imaging 2011, 2011
READ THESE TERMS AND CONDITIONS CAREFULLY BEFORE USING THIS WEBSITE. https://nrc-publications.canada.ca/eng/copyright
Vous avez des questions? Nous pouvons vous aider. Pour communiquer directement avec un auteur, consultez la première page de la revue dans laquelle son article a été publié afin de trouver ses coordonnées. Si vous n’arrivez pas à les repérer, communiquez avec nous à [email protected].
Questions? Contact the NRC Publications Archive team at
[email protected]. If you wish to email the authors directly, please see the first page of the publication for their contact information.
NRC Publications Archive
Archives des publications du CNRC
This publication could be one of several versions: author’s original, accepted manuscript or the publisher’s version. / La version de cette publication peut être l’une des suivantes : la version prépublication de l’auteur, la version acceptée du manuscrit ou la version de l’éditeur.
For the publisher’s version, please access the DOI link below./ Pour consulter la version de l’éditeur, utilisez le lien DOI ci-dessous.
https://doi.org/10.1117/12.871942
Access and use of this website and the material on it are subject to the Terms and Conditions set forth at
Proposed NRC Portable Target Case for Short-Range
Triangulation-Based 3-D Imaging Systems Characterization
Carrier, Benjamin; MacKinnon, David; Cournoyer, Luc; Beraldin, J.-Angelo
https://publications-cnrc.canada.ca/fra/droits
L’accès à ce site Web et l’utilisation de son contenu sont assujettis aux conditions présentées dans le site LISEZ CES CONDITIONS ATTENTIVEMENT AVANT D’UTILISER CE SITE WEB.
NRC Publications Record / Notice d'Archives des publications de CNRC:
https://nrc-publications.canada.ca/eng/view/object/?id=127417f8-5380-4c03-8049-e0ab08d90c78 https://publications-cnrc.canada.ca/fra/voir/objet/?id=127417f8-5380-4c03-8049-e0ab08d90c78
Proposed NRC portable target case for short-range
triangulation-based 3-D imaging systems characterization
Benjamin Carrier
*, David MacKinnon, Luc Cournoyer, J.-Angelo Beraldin
Institute for Information Technology, National Research Council of Canada
1200 Montreal Road, Ottawa, Ontario, Canada, K1A 0R6
ABSTRACT
The National Research Council of Canada (NRC) is currently evaluating and designing artifacts and methods to completely characterize 3-D imaging systems. We have gathered a set of artifacts to form a low-cost portable case and provide a clearly-defined set of procedures for generating characteristic values using these artifacts. In its current version, this case is specifically designed for the characterization of short-range (standoff distance of 1 centimeter to 3 meters) triangulation-based 3-D imaging systems. The case is known as the “NRC Portable Target Case for Short-Range Triangulation-based 3-D Imaging Systems” (NRC-PTC). The artifacts in the case have been carefully chosen for their geometric, thermal, and optical properties. A set of characterization procedures are provided with these artifacts based on procedures either already in use or are based on knowledge acquired from various tests carried out by the NRC. Geometric dimensioning and tolerancing (GD&T), a well-knows terminology in the industrial field, was used to define the set of tests. The following parameters of a system are characterized: dimensional properties, form properties, orientation properties, localization properties, profile properties, repeatability, intermediate precision, and reproducibility. A number of tests were performed in a special dimensional metrology laboratory to validate the capability of the NRC-PTC. The NRC-PTC will soon be subjected to reproducibility testing using an intercomparison evaluation to validate its use in different laboratories.
Keywords: 3-D Metrology, 3-D Imaging Systems, Characterization, Standardization, Artifacts, Procedure, Portable Case, Best Practices, Geometric dimensioning and tolerancing.
1. INTRODUCTION
For almost 25 years, 3-D imaging technology has expanded considerably and the number of players in this area is continuing to increase; however, standard procedures for characterization and verification have not kept pace with technological development. The Visual Information Technology (VIT) research group of the National Research Council of Canada (NRC) has already worked for years to develop artifacts and procedures for the characterization of 3-D imaging systems, in addition to developing new 3-D measuring technology, software and data processing algorithms. This paper presents a set of tests to fully characterize the capability of a 3-D imaging system to accurately measure the geometric properties of a given artifact. The approach used to perform these tests consist of scanning calibrated and certified artifacts, with known uncertainty much less than the uncertainty of the system under test (SUT), so that parameters from scanned images can be compared to calibrated values generated using more accurate methods. All the artifacts selected for the characterization toolkit were grouped on the same plate in a target case for portability and carrying purpose, allowing us to present the NRC portable target case (NRC-PTC) for short-range triangulation-based 3-D imaging systems characterization.
To define a set of tests that is practical, simple to perform and easy to understand, we decided to use a terminology that is already well-known in the industrial field. Geometric dimensioning and tolerancing (GD&T) was identified as this universal terminology making it possible to communicate all the geometric information concerning a part in either design stage, manufacturing stage, inspection stage or in the reverse engineering process. Tests proposed with the NRC-PTC represent most of the different aspect of GD&T and, thus, make it possible to know the ability of a 3-D imaging
*
system to measure features on a part or an artifact that can be toleranced. Using a set of tests reflecting the GD&T allows the user to directly link the performance of a system to the measurement they need it to perform. Moreover, it makes it easy for a user to select a 3-D imaging system to suit a given application.
Some of the tests presented in this paper are similar to tests described in the VDI/VDE 2634 Part 2[17] but are described here in a terminology linked to the GD&T because the nomenclature used here reflects the one used in the GD&T as per ASME Y14.5-2009[11]. Although this standard is American, it is recognized and used internationally so justifies its use in the context of characterizing 3-D imaging systems. It also exist an ISO standard describing GD&T and further work will make tests presented here compatible with this standard.
We must note that the characterization of 3-D imaging systems does not consist only of the system’s capability to measure geometric properties; to fully characterize a 3-D imaging system, we must also characterize the external frame of reference (EFOR), the mathematic model fidelity used in the fitting calculation, the resolution properties and the optical properties of the surfaces of the objects that the SUT can measure. To this we also add the parameters given by the specifications that the manufacturer provides for the system and the parameters pertaining to the measurement procedure used during the tests. All of the tests define a set of parameters that makes it possible to fully characterize a 3-D imaging system. In this paper, our study focuses on tests based on geometric properties that the system can measure on specific artifacts. The details of all the tests for a full characterization that is include within the NRC-PTC will be part of a longer paper that will be presented in the months to come.
2. NOMENCLATURE
All the tests presented in this paper are to be used for the characterization and verification of short-range triangulation-based 3-D imaging systems. All the systems of this kind can be separated in three categories. These categories are very important, especially when comparing systems with each other because some of the tests presented here apply only to specific categories. These categories are:
1) Static 3-D Imaging Systems: These are systems with fixed origin and use no relative movement between the scanner and the measured object to perform the digitization.
2) Single-Axis 3-D Imaging Systems: These systems use only one degree of freedom (DOF) in the motion between the system and the measured object to perform digitization. This motion can either be a translation or a rotation.
3) Multi-Axis 3-D Imaging Systems: For these systems, any type or relative motion can be used between the system and the measured object to perform the digitization. They allow more than one DOF in the motion. Throughout this paper, the nomenclature and symbols presented in Table 1 will be used as the terminology for all the tests presented.
Table 1: Nomenclature and symbols
Test name
Description Symbol
Test name
Description Symbol
Flatness
Form deviation on a plane F
Bidirectional plane-spacing error
Error of distance between 2 planes with opposite normal
EBPS
Roundness
Form deviation on a sphere R
Angularity
Form deviation on an oriented plane A
Diameter error
Error on sphere diameter Ed
Sphere position error
Error of position of a sphere Lsphere
Angle error
Error of angle between 2 planes Ea
Corner position error
Error of position of a corner Lcorner
Sphere-Spacing Error
Error of distance between 2 spheres ESS
Hole position error
Error of position of a hole Lhole
Unidirectional plane-spacing error
Error of distance between 2 planes with the same normal
EUPS
Surface profile
3. PARAMETERS TO CHARACTERIZE
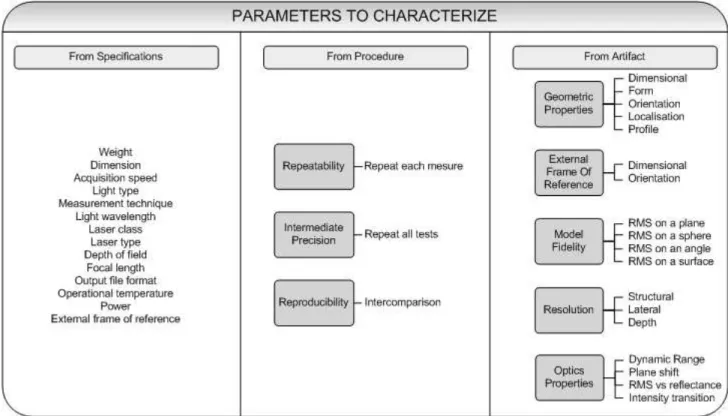
To quantify the capabilities of the SUT, several parameters must be studied and analyzed. It is impossible to completely characterize the SUT using a single value because there are many different types of systems, each having their strengths and weaknesses. In order to represent all aspects of the SUT, three major categories of parameters need to be compiled: parameters provided by the manufacturer's specifications, parameters calculated from the procedure being used and parameters obtained from tests using calibrated and certified artifacts, each with a known uncertainty much lower than the uncertainty of the SUT. Figure 1 provides an overall description of all the parameters needed to fully characterize a 3-D imaging system.
Figure 1: List of parameters used in the characterization of 3-D Imaging Systems
In this paper, parameters from specifications and those used in the procedure will be presented briefly, but the emphasis will be on the parameters coming from the geometric properties of the artifacts within the proposed target case used for characterization and verification of short-range triangulation-based 3-D imaging systems. The other parameters used to characterize a 3-D imaging system will be the subject of another paper in the future.
4. CHARACTERIZATION BASED ON SPECIFICATIONS
Many specifications are provided by the system's manufacturer for which there is no possible interpretation. These parameters are usually provided on the specifications data sheet or technical data of the SUT. Figure 1 presents a list of the characterization parameters of a system provided by manufacturer's specifications for which additional testing is not required to define them. This information is used directly in the characterization of the SUT.
5. CHARACTERIZATION BASED ON PROCEDURE
Some of the parameters to be compiled to have a complete knowledge of the SUT depend of the measuring procedure used in the characterization. Based on this procedure, three characteristics can be analyzed: the measurement repeatability, the intermediate measurement precision and the measurement reproducibility (see Figure 1). These parameters are necessary to determine if the system characteristics are stable and remain valid over time, and how they depend on atmospheric conditions, operator or localization of the tests.
5.1 Measurement repeatability
According to VIM[15], measurement repeatability is defined as measurement precision obtained under a set of repeatability conditions, those conditions involving the same measurement procedure, the same operator, the same measuring system, the same operating conditions, the same localization and the same object, all within a short time interval. This implies that for the repeatability characterization of the SUT, each scan must be performed three times in succession, and the parameters of interest are calculated for each scan. The measurement repeatability will then be calculated from the differences among these three repetitions of the parameters of interest for each test that will be performed.
5.2 Intermediate measurement precision
According to VIM[15], the intermediate measurement precision is defined as measurement precision obtained under a set of intermediate precision conditions, those conditions involve the same measurement procedure, the same location, the same object within a longer time interval. For this characteristic, the operator, the system and the operating conditions can vary. In our case, because we want to study the system itself, the system must not change during the tests. This definition implies that for the characterization of the intermediate measurement precision, all the tests will have to be performed three times, on three successive days. It will not be necessary to redo all the repeatability measurement of the SUT for the second and third days. The intermediate measurement precision will be calculated from the difference among those three sets of measurements for each test that will be performed.
5.3 Measurement reproducibility
According to VIM[15], measurement reproducibility is defined as measurement precision obtained under a set of reproducibility conditions, those conditions involving different locations, operators, systems, but all with the same object. The reproducibility conditions will be fulfilled by the establishment of an intercomparison protocol, that will be used to test the NRC-PTC. This protocol, in addition to providing us with reproducibility information, will allow us to assess the capability of different systems to perform all the tests presented in this paper. From the intercomparison process, it will be possible to perform characterization and verification of all the systems subject to this experiment.
6. CHARACTERIZATION BASED ON ARTIFACTS – GEOMETRIC PROPERTIES
Most of the parameters that allow us to determine the capability of a system to perform certain types of measurements are obtained by comparing the measurement results to internationally-recognized reference values; however, because we do not have access to an international reference standard, we have to use objects with calibrated and certified properties and with a known uncertainty with a magnitude at least five times smaller than that obtained for the SUT. With these known artifacts, it becomes possible to characterize the SUT by comparing the results obtained for an artifact with the corresponding calibrated characteristic value.
There are five properties that will be determined based on a comparison to a known artifact: geometric properties, mathematic model fidelity, EFOR properties, optical properties and resolution properties. The present study only covers the geometric properties.
The reference values associated with the artifacts are obtained using recognized methods that provide a better accuracy than the SUT. In the case of the geometric properties of the artifacts, each feature will be obtained from measurements performed by a coordinate measuring machine (CMM), which is traceable to national standards by appropriate calibration, giving us the reference values for all the artifacts of the NRC-PTC.
Geometric properties
Since 3-D imaging systems are mostly used in the context of design, manufacturing, inspection or reverse engineering, it is important to know the capability of the SUT to measure features associated with GD&T. Indeed, the terminology used in GD&T is the one that makes it possible to define an object with respect to its design, its manufacturing process and its final inspection and it constitutes an internationally-recognized terminology. GD&T as per ASME Y14.5-2009[11] defines five categories of tolerance that are used to describe an object: dimension, form, orientation, localization and profile.
If we want to know an object completely, we have to know its dimensions, form, localization, orientation and the surfaces profile. Measuring systems must be able to collect this information about an object in order to know all its characteristics. The measuring systems must then be tested to determine if it can adequately collect the geometric property information on the object. Those five categories will therefore be evaluated for the SUT.
In addition to being able to perform the characterization of a system, using the GD&T vocabulary and associated tests will enable users to know how well these systems will be able to meet the needs of different applications because the values of all the tested parameters will provide tolerance limits that are associated with the measurements of the SUT.
Figure 2: Portable artifact plate for geometric properties characterization
6.1 Dimensional characteristics
To know the characteristics of a system related to its capability to provide accurate dimensional measurements, five tests need to be performed. These tests are the diameter error on a sphere, the sphere-spacing error, the unidirectional plane-spacing error, the bidirectional plane-plane-spacing error and the angle error.
Diameter error
The diameter error Ed is the difference between the measured diameter dm of a sphere and the calibrated diameter dc of
that same sphere, given by the calibration certificate.
c m
d
d
d
A steel sphere one half to one inch in diameter is used to perform this test (see Figure 2), and the diameter error is calculated for each sphere in the NRC-PTC. A minimum of three spheres must be scanned for this test. The spheres are positioned to ensure that, as much as possible, the entire measurement volume of the SUT is covered.
For each measured sphere, an ideal sphere minimizing the least-squares deviations will be calculated from the original data points. The measured diameter used in equation 1 corresponds to the diameter of the calculated sphere, and is compared to the calibrated diameter recorded on the calibration certificate. The value of the diameter error chosen for the characterization will be the largest value for all scanned spheres in all orientations (see section 8).
Sphere-spacing error
The sphere-spacing error ESS is the difference between the measured distance lm,SS between two sphere centers and the
calibrated length lc,SS of that same distance given by the calibration certificate.
SS c SS m SS
l
l
E
,
, (2)Pairs of steel spheres of one half to one inch in diameter are used to perform this test (see Figure 2), and the sphere-spacing error is calculated for each combination of sphere pair in the NRC-PTC. A minimum of five lengths must be measured and compared to the calibrated lengths. These lengths should, as much as possible, be positioned to cover the entire measurement volume of the SUT.
For each measured sphere, an ideal sphere minimizing the least-squares deviations will be calculated from the original data points, using the calibrated diameter as a fixed parameter in the calculation. The distance between the sphere centers will be measured and compared to the calibrated lengths recorded on the calibration certificate. The sphere-spacing error chosen for the characterization will be the largest value of all scanned lengths from all orientations (see section 8).
Unidirectional plane-spacing error
The unidirectional plane-spacing error EUPS is the difference between the measured distance lm.UPS between two planes
with same normal and the calibrated length lc,UPS of that same distance given by the calibration certificate.
UPS c UPS m UPS
l
l
E
,
, (3)An assembly of steel gauge blocks of different lengths, mounted side by side on a reference plane is used to perform this test (see Figure 2). The unidirectional plane-spacing error will be calculated for each gauge block relatively to the reference plane. A minimum of five lengths must be measured and compared to calibrated lengths. These lengths should, as much as possible, be positioned to cover the entire measurement volume of the SUT.
For each measured plane, an ideal plane minimizing the least-squares deviations will be calculated from the original data points. Planes on gauge blocks will have to be fitted parallel to the reference plane. Distances between the reference plane and the plane on gauge blocks will be compared to the calibrated lengths from the calibration certificate. The unidirectional plane-spacing error chosen for the characterization will be the largest value of all scanned lengths from all orientations (see section 8).
Bidirectional plane-spacing error
The bidirectional plane-spacing error EBPS is the difference between the measured distance lm,BPS between two planes
with opposite normal and the calibrated length lc,BPS of that same distance given by the calibration certificate.
BPS c BPS m BPS
l
l
E
,
, (4)A 4-inch long steel gauge block is used for this test (see Figure 2). Note that this test can only be performed by systems in the third category (multi-axis 3-D imaging systems) because more than one DOF must be available to perform this test.
For both opposite planes of the gauge block, an ideal plane minimizing the least-squares deviations will be calculated from the original data points. Both planes must be fitted constrained parallel one to the other. The distance measured between the two planes will be compared to the calibrated length from the calibration certificate. The bidirectional plane-spacing error chosen for the characterization will be the largest value of all scanned length from all orientations (see section 8).
Angle error
The angle error Ea is the difference between the measured angle am from an orientated plane to a reference plane and the
calibrated angle ac of that same angle given by calibration certificate.
c m
a
a
a
E
(5)An assembly of steel angle blocks from 1° to 60°, mounted side by side on a reference plane is used to perform this test (see Figure 2). The angle error will be calculated for each angle block relatively to the reference plane. A minimum of eight angles must be measured and compared to the calibrated angles.
For each measured plane, an ideal plane minimizing the least-squares deviations will be calculated from the original data points and the angle will be calculated between those planes and the reference plane. These angles will be compared with calibrated angles from the calibration certificate. The angle error chosen for the characterization will be the largest value of all scanned angle from all orientations (see section 8).
6.2 Form characteristics
To know the characteristics of a system related to the capability to give accurate form measurements, two tests need to be performed. These two tests are the flatness of a plane and the roundness of a sphere.
Flatness
The flatness deviation on a plane F is the difference between the maximum and the minimum of the orthogonal distances
dmax,F and dmin,F from the measured points to an ideal plane minimizing the least-squares deviations fitted to the measured
points.
F
F
d
d
F
max,
min, (6)Two artifacts are used to perform this test: an 8-inch long steel 4-ways parallels will be used with flatness measurements being obtained from the long portion of the axis of the measuring volume of the SUT, and an accurate optical flat will be used to calculate the flatness on a local portion of the measuring volume (see Figure 2). Both planes must be scanned in at least six different positions: three standoff distances and three different angles.
For each measured plane, an ideal plane minimizing the least-squares deviations will be calculated from the original data points. The difference between the maximum and the minimum orthogonal distances from the points to the fitted plane will be computed as the flatness deviation. The flatness chosen for the characterization will be the largest value of all scanned planes from all orientations (see section 8).
Roundness
The roundness deviation on a sphere R is the difference between the maximum and the minimum of the radials distances
rmax and rmin, between the measured points and an ideal sphere minimizing the least-squares deviations fitted on
measured points.
min max
r
r
R
(7)Steel sphere of one half to one inch in diameter are used to perform this test (see Figure 2) and the roundness is calculated for each sphere in the NRC-PTC. A minimum of three spheres must be scanned for this test. The spheres will have to be located to cover as much as possible the whole measurement volume of the SUT.
For each measured sphere, an ideal sphere minimizing the least-squares deviations is calculated from the original data points. The sphere diameter must not be constrained in the calculation of the fitted spheres. The difference between the maximum and the minimum of the radials distances from the points to the fitted sphere will be computed as the roundness deviation. The roundness chosen for the characterization will be the largest value of all the scanned spheres from all the orientations (see section 8).
6.3 Orientation characteristics
To know the characteristics of a system related to the capability to give accurate orientation measurements from one feature to another, only one test needs to be performed. It is the angularity deviation. Here, we will analyze only the
angularity that is one of the three elements of the orientation section presented in ASME Y14.5-2009[11], the two other ones being perpendicularity and parallelism. These three tolerances are evaluated the same way, perpendicularity being the particular case of an angle at 90°, and parallelism being the particular case of an angle at 0°. In our case, the angularity test is sufficient to characterize a system for the orientation characteristic. By extension, this test is very similar to the flatness test. The difference is that the flatness test is not compared to a reference while the angularity corresponds to a flatness deviation at an specific angle relative to a reference plane.
Angularity
The angularity deviation A is the difference between the maximum and the minimum of the orthogonal distances dmax,A
and dmin,A from the measured points and an ideal plane minimizing the least-squares deviations fitted to the measured
points but having his orientation fixed at the calibrated angle of that plane relative to the reference plane, given by the calibration certificate.
A
A
d
d
A
max,
min, (8)An assembly of steel angle blocks from 1° to 60°, mounted side by side on a reference plane is used to perform this test (see Figure 2). The angularity deviation is calculated for each angle block. A minimum of eight angles need to be measured.
For each measured plane, an ideal plane minimizing the least-squares deviations is calculated from the original data points, but with a fixed angle at the calibrated value given by the calibration certificate. The difference between the maximum and the minimum of the orthogonal distances from the points to the fitted plate is computed as the angularity deviation of the plane. The angularity chosen for the characterization will be the largest value for all the scanned planes for only the orientations where the NRC-PTC is perpendicular to measuring axis (see section 8, position 1, 2, 3 and 4).
6.4 Localization characteristics
To know the characteristics of a system related to the capability to give accurate localization measurements, three tests need to be performed. These tests are the sphere position error, the corner position error and the hole position error. According to the ASME Y14.5-2009[11], there are two ways to represent the position of a feature. We may want to know the position of the surface of a feature or know the position of the resolved geometry (point, axis or plane) of the envelope. In our case, because the form aspect is treated separately in the form and profile section, we will use the position of the resolved geometry of the feature to be analyzed. Also, this standard provides the opportunity to apply different positioning bonuses depending on the dimension value of the positioned feature, which complicates the analysis. In our case, all the analysis will be made regardless of features size (RFS), which does not imply the dimensions of the features to verify because the dimensions are also treated separately. The RFS case also represents the most restrictive case of the positioning analysis because no bonus can be applied to the feature, ensuring that this represents the worst case scenario, giving us characterization value representing the limits of the system. The RFS case is also the easiest case to analyze.
Sphere position error
The sphere position error Lsphere is the distance between the center of an ideal sphere (xm,sphere, ym,sphere, zm,sphere)
minimizing the least-squares deviations fitted on measured points and the calibrated position of that same sphere (xc,sphere, yc,sphere, zc,sphere) given by the calibration certificate.
2 , , 2 , , 2 ,,sphere csphere msphere csphere msphere csphere m
sphere
x
x
y
y
z
z
L
(9)A steel sphere one half to one inch in diameter is used to perform this test (see Figure 2) and the sphere position error will be calculated for each sphere in the NRC-PTC. A minimum of three spheres must be scanned for this test. The spheres are positioned to cover as much as possible the entire measurement volume of the SUT.
For each measured sphere, an ideal sphere minimizing the least-squares deviations is calculated from the original data points with an unconstrained diameter. The center of the fitted sphere will be calculated and compared to the calibrated position of that same sphere given by the calibration certificate. The sphere position error chosen for the characterization will be the largest value of all the scanned spheres from all the orientations (see section 8).
Corner position error
The corner position error Lcorner is the distance between a corner position (xm,corner, ym,corner, zm,corner) generated by the
intersection of three planes measured by the 3-D imaging system and the calibrated position of that same corner (xc,corner,
yc,corner, zc,corner) given by the calibration certificate.
2 , , 2 , , 2 ,,corner ccorner mcorner ccorner mcorner ccorner m
corner
x
x
y
y
z
z
L
(10)The corner of a steel 123-block is used for this test (see Figure 2), and the corner position error will be calculated for each corner in the NRC-PTC.
For each measured corner, three ideal planes minimizing the least-squares deviations are calculated from the original data points. The position of the intersection of these three planes will be calculated and compared to the reference position of that same corner given by the calibration certificate. The corner position error chosen for the characterization will be the largest value for all scanned corners in all the orientations (see section 8).
Hole position error
The hole position error Lhole is the distance between a hole center position (xm,hole, ym,hole, zm,hole) generated by the
intersection of his axis and the plane on which is located the hole measured by the 3-D imaging system and the calibrated position of that same hole (xc,hole, yc,hole, zc,hole) given by the calibration certificate.
2 , , 2 , , 2 ,,hole chole mhole chole mhole chole m
hole
x
x
y
y
z
z
L
(11)A predrilled steel 123-block is used for this test (see Figure 2), and the hole position error is calculated for the hole in the target case. Note that this test may be impossible to do with static and single-axis systems, depending of the orientation of the target case. In that case, results will be computed each time it will be possible to do so.
For the measured hole, an ideal plane and an ideal cylinder minimizing the least-squares deviations will be calculated from the original data points. The position of the intersection of the axis of the cylinder and the plane will be calculated and compared to the reference position of that same hole given by the calibration certificate. The hole position error chosen for the characterization will be the largest value of all scanned holes from all the orientation (see section 8).
6.5 Profile characteristics
To know the characteristics of a system related to the capability to give accurate surface profile measurements, only one test needs to be performed. This test is the surface profile deviation on a freeform object. Note that this characteristic is closely related to the form characteristic. However, according to the ASME Y14.5-2009[11], this tolerance is more complete because it can control, at the same time, the form, the dimension, the localization and the orientation of a feature. That is why we treat this metric separately.
Surface profile
The surface profile P is the difference between the maximum and the minimum of the orthogonal distances dmax,P and
dmin,P from the measured points and an ideal surface minimizing the least-squares deviations fitted to the measured
points.
P
P
d
d
P
max,
min, (12)A freeform aspheric condenser lens, depolished and cover with a coating is the artifact used for this test (see Figure 2). For the measured surface, an ideal surface minimizing the least-squares errors will be calculated from the original data points. The ideal surface will correspond to a surface generated by a point cloud obtained by a reference measurement made by a CMM. The difference between the maximum and the minimum orthogonal distances from the measured points to the fitted surface will be computed as the surface profile. The surface profile chosen for the characterization will be the largest value of all scanned surface from all the orientations (see section 8).
7. NRC PORTABLE TARGET CASE
The selection of the artifacts for the different tests is function of the geometrical, optical and thermal properties of these artifacts. Indeed, the geometrical properties of the chosen artifacts must represent known features that make it possible to use GD&T-based tests. In addition, all artifacts must have a cooperative surface, which means it should approximate a Lambertian diffuser which does not produce specular reflections. To obtain this kind of surface, all the metallic surfaces in the NRC-PTC are modified by a vapor blast process to obtain the proper optical properties. Glass artifacts are depolished and covered by a chrome coating known to give proper optical properties. Finally, these artifacts must have a low coefficient of thermal expansion to avoid any deviation caused by possible changes in temperature during the test process.
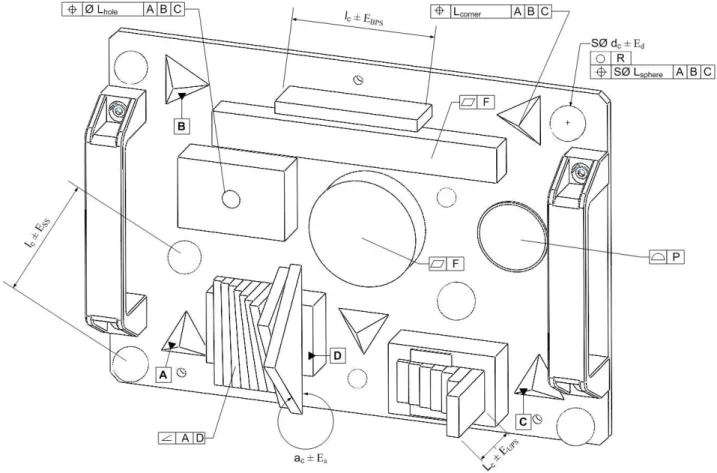
The artifacts are grouped on a composite plate having a low coefficient of thermal expansion. The artifacts used on the plate for the geometric properties are: steel balls, steel 123-block, steel gauge blocks, steel angle blocks, steel 4-ways parallels, depolished and coated optical flat and aspheric lens. All the tests to be performed for the characterization of the geometric properties are shown in the Figure 3, and are presented in a GD&T representation.
Figure 3: GD&T drawing of target case's artifact plate for geometric properties characterization
8. MEASUREMENT PROCEDURE
Before we execute each test presented in this paper, some precautions must be taken. First, the NRC-PTC and the SUT must be allowed to reach a thermal stability with respect to the atmospheric conditions where the tests will be done, ideally in a controlled temperature laboratory maintained at 20°C as stipulated by ISO 1[13]. At least 12 hours must be allowed for thermal stabilization to complete. In the case where the tests may not be done at 20°C, the temperature of the tests should be noted as well as any thermal compensation that applies. Also, for each set of measurements, the portable
target case and the SUT must be mounted properly to avoid any deformation or vibration that may affect the measurement process.
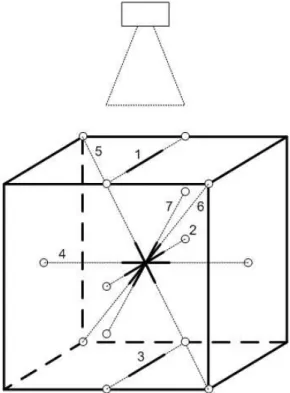
To be able to obtain each characterization parameter, the NRC-PTC will have to be measured in seven orientations. Depending on the SUT, these orientations may be obtained by positioning either the system or the plate, using the configuration that is the easiest to achieve and provides the most stability. These seven orientations are presented in Figure 4. There are three positions along the longest axis of the measuring volume at three different standoff distances defined as the minimum (1), median (2) and maximum (3) distance. Another position is on the axis perpendicular to the first axis at a median standoff distance (4). The plate must also be orientated on two of the body diagonals of the measuring volume (5 and 6). Finally, it has to be orientated 30° from position number 2 (7).
Figure 4: Orientations for digitization
About the characterization parameters related to the procedure, each scan must be taken three times in the same conditions and by the same user to be able to know the measurement repeatability of the system. Also, all the tests for a characterization should be perform three times on three different days to know the intermediate measurement precision.
9. PARAMETERS CALCULATION
To calculate each of the parameters presented in this paper, precautions must be taken to ensure that the calculations are always performed the same way no matter which system is used and no matter who is doing the computation. Algorithms are being developed by the NRC-VIT research group to perform the characterization based on the parameters detailed in this paper.
Without detailing all the algorithms, we should mention few important details that should be taken into account when fitting any feature using the least-squares method. When doing the selection of the points, points on peripheral portion of a sphere or along edges of a plane are excluded from computation to avoid errors because of aberrant points in the boundary portion of the point cloud. After this first exclusion, a maximum of 3 points over 1000 may be removed without any justification to eliminate outliers in the point cloud. If any other points are voluntarily removed from the
point cloud, this decision must be documented to make sure that they are excluded with a valid reason to avoid providing an advantage to the SUT. Additional details on the calculation of parameters are presented by MacKinnon and al.[10].
10. FUTURE WORK
The NRC-PTC represents a much larger work than what has been presented in this paper. In fact, all the other characterization parameters relate to mathematic model fidelity in fitting calculation, EFOR properties, optical properties and resolution properties will be presented soon in a future paper. The NRC-PTC will also be subject to an intercomparison protocol in the coming year. This will validate the use of the target case for characterization and also will allow people to get characterization values for systems that will be part of this study. Tests will also be performed to extend the measured distance from 3m to 5m in order to make the target case more versatile. Finally, the geometric properties tests presented here will be adapted to make the characterization tests compatible with ISO standards of geometric dimensioning and tolerancing.
11. CONCLUSION
We presented the NRC portable target case for short-range triangulation-based 3-D imaging systems characterization. Presented tests make it possible to know the capability of 3-D imaging systems to obtain geometric properties on calibrated artifacts. Geometric properties tests are described in this paper using terminology taken from the ASME Y14.5-2009[11] for GD&T.
The GD&T-related terminology is applied to 3-D imaging systems characterization to simplify the characterization for users from industrial field who already know this terminology and will make system characterization easily applicable to real case application of 3-D imaging systems. The parameter values obtained directly represent a physical metric that can be associated directly to what users want to scan and inspect. Choosing a system for a specific application becomes also more intuitive.
The tests presented here are proposed as the basis of the “Best Practice” for short-range triangulation-based 3-D imaging systems characterization use here at NRC and opens the way to national and international standard methods for the characterization of 3-D imaging systems.
ACKNOWLEDGEMENTS
We are indebted to thank F. Blais, M. Picard, L-G. Dicaire and G. Godin from NRC for taking the time to discuss methodologies and provide feedback on our work on numerous occasions. We also want to thank Dr. Steven D. Phillips from the LSCM Group of Physical Measurement Laboratory (PML) at the National Institute of Standards and Technology (NIST).
REFERENCES
[1] Beraldin, J.-A., Blais, F., El-Hakim, S., Cournoyer, L., Picard, M., “Traceable 3D imaging metrology: Evaluation of 3D digitizing techniques in a dedicated metrology laboratory”, Proc. of the 8th Conference on optical 3-D measurement techniques: Terrestrial laser scanning I, Zurich, Switzerland, SPIE 6491, 310-318, July 9-12 (2007). [2] Boehler, W., Bordas Vicent, M., Marbs, A., “Investigating laser scanner accuracy”, Proc. CIPA, Antalya, Turkey,
vol.34, part 5, 696-701, September 30 to October 4 (2003).
[3] Breuckmann, B., Rein, H., Pfeifer, J., Mutsch, J., “Acceptance test of tomometrical 3D-scanners: Experiences with guideline VDI/VDE 2634, Proc. of the 8th Conference on optical 3-D measurement techniques: Sensor calibration and characterization, Zurich, Switzerland, SPIE, 88-93, July 9-12 (2007).
[4] Bridges, R. E., “Ways to verify performance of 3D imaging instruments” Proc. of Three dimensional imaging metrology: Measurement uncertainty, San Jose, California, USA, SPIE 7239, January 18-22 (2009).
[5] Brownhill, A., Brade, R., Bobson, S., “Performance study of non-contact surface measurement technology for use in an experimental fusion device”, Proc of Videometric range imaging and application X: Industrial/System metrology, San Diego, California, USA, SPIE 7447, August 2-6 (2009).
[6] Carmignato, S., “Experimental study on performance verification test for coordinate measuring systems with optical distance sensor” Proc. of Three dimensional imaging metrology: Coordinate metrology, San Jose, California, USA, SPIE 7239, January 18-22 (2009).
[7] Guidi, G., Remondino, F., Morlando, G., Del Mastio, A., Ucheddu, F., Pelagotti, A., “Performances evaluation of a low cost active sensor for cultural heritage documentation”, Proc. of the 8th
Conference on optical 3-D measurement techniques: Structural light and laser scanning, Zurich, Switzerland, SPIE 6491, 59-69, July 9-12 (2007).
[8] MacKinnon, D., Beraldin, J.-A., Cournoyer, L., Blais, F., “Evaluating laser range scanner lateral resolution in 3D metrology” Proc. of Three dimensional imaging metrology: Artifact based characterization, San Jose, California, USA, SPIE 7239, January 18-22 (2009).
[9] MacKinnon, D., Beraldin, J.-A., Cournoyer, L., Carrier, B., Blais, F., “Proposed traceable structural resolution protocols for 3D imaging systems” Proc of Videometric range imaging and application X: Range system I, San Diego, California, USA, SPIE 7447, August 2-6 (2009).
[10] MacKinnon, D., Beraldin, J.-A., Cournoyer, L., Carrier, B., “Hierarchical characterization procedures for dimensional metrology” Proc. of 3D Imaging Metrology: Theory and New Methods for 3D Metrology, San Francisco, California, USA, SPIE 7864A, January 24-25 (2011).
[11] ASME Y14.5-2009, “Dimensioning and Tolerancing”, ASME, (2009).
[12] ASME Y14.5.1M-1994, “Mathematical definition of dimensioning and tolerancing principles”, ASME, (1994). [13] ISO 1:2002, “Geometrical Product Specifications (GPS) – Standard reference temperature for geometrical product
specification and verification”, International Organization for Standardization (ISO), (2002)
[14] ISO/NP 10360-8 “Geometrical product specifications (GPS) – Acceptance and reverification tests for coordinate measuring machines (CMM) – Part 8: CMMs with optical distance sensors”, International Organization for Standardization (ISO), Under development (2009).
[15] JCGM 200:2008, “International vocabulary of metrology – Basic and general concepts and associated terms (VIM)”, JCGM/WG-2 (2008).
[16] VDI/VDE 2634 Part 1, “Optical 3D measuring systems: Imaging systems with point-by-point probing” The Association of German Engineers (VDI) Berlin, Germany, (2002).
[17] VDI/VDE 2634 Part 2, “Optical 3D measuring systems: Optical systems based on area scanning” The Association of German Engineers (VDI) Berlin, Germany, (2002).
[18] VDI/VDE 2634 Part 3, “Optical 3D measuring systems: Imaging systems based on area scanning in several singles images” The Association of German Engineers (VDI) Berlin, Germany, (2006).