Publisher’s version / Version de l'éditeur:
Canadian Journal of Chemistry, 89, 9, pp. 1036-1046, 2011-08-24
READ THESE TERMS AND CONDITIONS CAREFULLY BEFORE USING THIS WEBSITE.
https://nrc-publications.canada.ca/eng/copyright
Questions? Contact the NRC Publications Archive team at
[email protected]. If you wish to email the authors directly, please see the first page of the publication for their contact information.
NRC Publications Archive
Archives des publications du CNRC
This publication could be one of several versions: author’s original, accepted manuscript or the publisher’s version. / La version de cette publication peut être l’une des suivantes : la version prépublication de l’auteur, la version acceptée du manuscrit ou la version de l’éditeur.
For the publisher’s version, please access the DOI link below./ Pour consulter la version de l’éditeur, utilisez le lien DOI ci-dessous.
https://doi.org/10.1139/v11-034
Access and use of this website and the material on it are subject to the Terms and Conditions set forth at
A multinuclear NMR and quantum chemical study of solid
trimethylammonium chloride
Penner, Glenn H.; Webber, Renee; O'Dell, Luke A.
https://publications-cnrc.canada.ca/fra/droits
L’accès à ce site Web et l’utilisation de son contenu sont assujettis aux conditions présentées dans le site LISEZ CES CONDITIONS ATTENTIVEMENT AVANT D’UTILISER CE SITE WEB.
NRC Publications Record / Notice d'Archives des publications de CNRC: https://nrc-publications.canada.ca/eng/view/object/?id=4a9cb76c-3b4a-481b-8f41-7f3eede703c9 https://publications-cnrc.canada.ca/fra/voir/objet/?id=4a9cb76c-3b4a-481b-8f41-7f3eede703c9
A Multinuclear NMR
and
Quantum Chemical
Study
of
Solid Trimethylammonium Chloride
Glenn H. Penner
1*, Renee Webber
1and Luke A. O’Dell
21.
Department of Chemistry, University of Guelph, Guelph, ON
N1G 2W1, Canada.
2.
Steacie Institute for Molecular Sciences, National Research
Council, 100 Sussex Drive, Ottawa, ON, K1A 0R6, Canada.
*
To whom correspondence should be addressed. Email:
[email protected]
This paper is dedicated to Professor Rod Wasylishen in recognition
of his immeasurable contributions to NMR spectroscopy and to the
Chemistry community within Canada.
Abstract
The solid salt, trimethylammonium chloride (TMAC), is investigated by a combination of NMR spectroscopic techniques and quantum chemical calculations. Chemical shift and nuclear quadrupolar interaction parameters have been measured for 35Cl, 1H/2H, and 15N/14N. These parameters have also been calculated as a function of the hydrogen
position in the N ∙∙∙ H ∙∙∙ Cl fragment. Overall, the measured parameters are consistent with a structure in which the hydrogen is completely transferred to the nitrogen (i. e. N – H ∙∙∙ Cl). The high hydrogen chemical shift (10.9 ppm by 2H CP/MAS) and relatively
small deuterium quadrupolar coupling constant (127 kHz) indicate a moderately strong N – H ∙∙∙ Cl hydrogen bond. A pronounced deuterium isotope effect on the 35Cl quadrupolar
coupling constant is observed.
Introduction
Chemists have used many disparate techniques in their attempts to understand the hydrogen bond. [1] NMR spectroscopy has proven to be one of the most powerful of these methods. [2,3] NMR spectra can be used to study the effects of hydrogen bonding by directly probing the nucleus of the donor or acceptor atom, or even the hydrogen itself. Information about the hydrogen bond comes from the measurement of the chemical shift, nuclear quadrupolar, dipolar or J-coupling interactions through lineshapes and nuclear spin relaxation times.
Solid trimethylammonium chloride (TMAC) is an excellent example of a system with an N – H ∙∙∙ Cl hydrogen bond. TMAC offers several magnetic nuclei (15N,14N,1H, 2H,37Cl , and 35Cl) which are part of the hydrogen bonding structure. Yet the only
reported solid-state NMR work on this solid consists of two studies of the 15N –1H
dipolar coupling. [4,5]
Fourier transform microwave experiments carried out by Legon and Rego, [6,7] gave 14N and 35/37Cl quadrupolar coupling constants (C
Q) which were consistent with a
significant proton transfer from chlorine to nitrogen in the gas phase. Also in line with this conclusion is the N ∙∙∙ Cl stretching force constant, as obtained from the centrifugal force constant, DJ. Subsequent quantum chemical calculations agree that the most stable
species is the Me3NH+Cl−complex (see Figure 1a), with a somewhat elongated N – H
bond length. [8,9]
At room temperature solid TMAC exists as crystals in the monoclinic space group P21/m with one molecule per asymmetric unit (Z’ = 1).[10] See Figure 2. At 308K,
TMAC undergoes a phase transition to a tetragonal phase with space group P4/nmm (also Z’ = 1).[11,12] Attempts to refine the structure in the tetragonal phase were only partially successful. [11,12]
In 1974 Huong and Schlaak examined the IR and Raman spectra of the series Me3NHX, where X = Cl, Br, or I, and noted that the N – H stretching frequency increased
along this series, which is consistent with a decreasing hydrogen bond interaction.[13] Early proton second moment and T1studies and, more recent 13C T1work,
concentrated on the dynamics of the trimethylammonium cation. These show fast methyl and trimethyl reorientation at room temperature.[14-17] The two NMR investigations which were most relevant to hydrogen bonding in solid TMAC, measured the dipolar couplings between the 15N –1H and 15N –2H spin pairs. Roberts et al used
dipolar/chemical shift 2D MAS experiments to obtain r(15N –1H) = 1.075 Å.[4] Hoelger
and Limbach obtained r(15N –1H ) = 1.090Å and 1.096Å from CP/static and CP/MAS
spectra, respectively. They also obtained r(15N –2H) = 1.080Å and 1.083Å from
CP/static and CP/MAS spectra, respectively, of the deuterated sample.[5] These r values are all at least 0.06Å longer than that expected for an isolated N – H bond (1.01 Å).[18] This could be due to slight wobbling motion of the cation and/or vibrational averaging. It could also be due to N – H ∙∙∙ Cl hydrogen bonding.
In this investigation we present the results of a combined multinuclear (15N, 14N, 1H, 2H, and 35Cl) NMR and quantum chemical study of the N – H ∙∙∙ Cl hydrogen bond in
Experimental
Sample Preparation
Trimethylamine hydrochloride was purchased from Aldrich. Trimethylamine-d9
-hydrochloride was purchased from CDN isotopes with a reported isotopic purity of 99%. Trimethylamine hydrochloride-d1was prepared by evaporation from D2O. Due to the
extremely hygroscopic nature of trimethylamine hydrochloride, samples were heated under vacuum for at least 12 hours in order to remove any moisture. All samples were packed in 4.0 mm o.d. zirconia rotors in a glove box under an atmosphere of nitrogen to ensure sample dryness. All experiments were performed within a few days of sample preparation.
NMR Spectroscopy
Solid-state 35Cl NMR spectra were obtained at two fields, 11.75 T (ν
L= 49.06
MHz) and 18.8 T (νL= 78.48 MHz). The 11.75 T experiments were performed on a
Bruker Avance II spectrometer using a 4 mm Bruker HFX MAS probe. Experimental setup and pulse calibrations at 11.75 T were performed using solid NaCl, and 35Cl spectra
were referenced to the centreband of solid NaCl at 0 ppm. The chemical shift was then corrected to NaCl at infinite dilution by subtracting 45.37 ppm.[19] The non-selective, ‘solution π/2’ pulse length determined using NaCl was 6.5 μs. The central-transition selective, ‘solid π/2’ pulse used was therefore, 6.5 μs/(I+1/2) = 3.25 μs. The static spectrum was collected using the π/2 – τ – π/2 – τ – ACQ echo pulse sequence with an interpulse delay of 100 μs. A recycle delay of 1 s was used, and signal averaging was carried out over about 80,000 scans. The high temperature spectrum (330 K) was
obtained using sample heating controlled by a Bruker BVT 3000. The 35Cl experiment at
18.8 T was performed on a Bruker Avance spectrometer using a 4 mm Bruker HX MAS probe. Experimental setup, pulse calibration and referencing were done using solid NaCl, as above. The 35Cl solid π/2 pulse was 4.15 μs and a recycle delay of 1 s was used.
The 1H NMR spectrum was acquired at 11.75T (ν
L= 500.14 MHz) using a Bruker
Avance II spectrometer and a wideline probe constructed to have minimal proton
background. The 1H spectrum was referenced to the residual proton signal in pure liquid
CDCl3at 7.24 ppm. The static spectrum was obtained with a single pulse.
All 2H NMR spectra were acquired at 11.75 T (ν
L= 76.78 MHz) using a Bruker
Avance II spectrometer and a 4 mm Bruker HFX MAS probe. The magic angle was set by maximizing the number of rotational echoes in the 23Na FID of solid NaNO
3spinning
at 5 kHz. Experimental setup and pulse calibrations were performed using solid (CD3)2SO2, and 2H spectra were referenced to (CD3)2SO2 at 2.77 ppm relative to TMS.
The 2H spectrum collected under stationary conditions used the π/2 – τ – π – τ – ACQ
echo pulse sequence with π/2 pulses of 3.6 μs and an interpulse delay of 20 μs. The recycle delay was 30 s and 2000 scans were collected (total experimental time of ~17 h). For the 2H CP/MAS experiments, contact times of 10 ms were employed and 83 kHz
proton decoupling was applied during acquisition. Recycle delays of 5 s were used and an average of 400 scans were collected (total experimental time of 34 min).
The 14N NMR spectrum was acquired at 21.1 T (ν
L= 65.02 MHz) using a Bruker
Avance II console and a 7.0 mm HX static probe built in-house (National Ultra-High Field NMR Facility for Solids, Ottawa). The WURST-QCPMG pulse sequence [20,21] was used with eight-step phase cycling and 50 μs WURST-80 pulses swept over a range
of 1.0 MHz, resulting in an excitation bandwidth of approximately 850 kHz. The optimum RF power for the WURST pulses was experimentally determined as ν1≈ 30
kHz. Continuous-wave 1H decoupling of ν
2≈ 15 kHz power was applied for the duration
of each scan. Solid NH4Cl was used as a reference, and set to 0 ppm. The ultra-wideline
spectrum was acquired in six pieces at transmitter offset frequencies of ±0.4, ±0.7 and ±1.0 MHz, with the WURST pulse sweep direction from low to high frequencies on the high frequency side and vice versa.[22] For each piece, 32 echoes were acquired with 120 scans and a recycle delay of 10 s (total experiment time of 2 h). Transverse 14N
relaxation was observed to be relatively short compared with most crystalline organic molecules that we have previously studied [23,24], indicating the presence of dynamics which can cause rapid transverse dephasing via modulation of either the EFG tensor [25] or heteronuclear dipolar couplings [24]. A variation of the proton decoupling power could in principle be used to identify the latter mechanism [24], however due to experimental time contraints this was not attempted.
A 15N NMR spectrum was acquired at 11.75T (ν
L= 50.70 MHz) using a Bruker
Avance II spectrometer and a 4 mm Bruker HFX MAS probe. A RAMP
cross-polarization pulse sequence was used with 5 kHz sample spinning, a contact time of 10 ms, 100 kHz proton decoupling and a recycle delay of 2s; 4000 scans were collected. The spectrum was referenced to the nitrate signal of solid 15NH
415NO3,which is at 4.4 ppm
with respect to pure liquid nitromethane at 20oC.
Spectral Processing and Simulation
Data were processed using TopSpin software (with the exception of 14N data).
10-100 Hz for MAS samples or 10-100-6000 Hz for static samples, and Fourier transformed. Baseline corrections were applied to all 2H CP/MAS spectra and the 1H static spectrum.
Spectral simulations of 35Cl, 1H and 2H were performed using WSOLIDS1 [26] and the
Solid Line Shape Guide within TOPSPIN 2.1.
For 14N, spectral processing was carried out using the NUTS software (Acorn
NMR). QCPMG trains were split into individual echoes, which were co-added prior to Fourier transformation. Absorptive spectra were obtained via a magnitude calculation and complete spectra were reconstructed from the individual pieces via coaddition. EFG parameters and the isotropic chemical shift were determined by manually fitting
simulations to the experimental spectra using the DMFit software.[27] Computational Details
Potential energy curves, EFG tensors and magnetic shielding tensors were calculated using Gaussian03 (G03).[28] Single-point energy calculations were performed (r(N – H) in trimethylamine hydrochloride was stepped from 1 Å to 1.8 Å) using Hartree-Fock (HF), density-functional theory (DFT) employing the hybrid B3LYP functional, and coupled cluster singles and doubles (CCSD) methods with an augmented Dunning basis set (aug-cc-pVtz). The single-point energy calculations were performed using the X-ray structure of trimethylamine hydrochloride. The X-ray structure does not include hydrogen positions, thus, protons were inserted manually and positions were optimized using the B3LYP/6-311++G** level of theory; the heavy-atom positions were kept fixed during this optimization. Optimization of the hydrogen positions in the N – H∙∙∙Cl bond and the N∙∙∙H – Cl bond were performed with the three methods used to generate the PE curves. For these optimizations, all of the atoms were frozen except for the hydrogen involved in
the bond; the N – H∙∙∙Cl angle was forced to be linear. These optimizations allowed for accurate determination of the energy difference between the two minima in each PE curve. EFG and magnetic shielding calculations were performed with the HF and DFT methods, using Pople-type and Dunning-type basis sets. The gauge-including atomic orbitals method (GIAO) was used for calculating chemical shielding tensors. The EFG and magnetic shielding tensors contained in the G03 output files were analyzed using the EFGShield program.[29]
Plane-wave DFT calculations were performed using the CASTEP software [30-33] in the Materials Studio 4.3 software suite on an HP xw4400 Workstation with a single Intel Dual-Core 2.67 GHz processor and 8 GB DDR RAM. This software employs the gauge-including projector augmented wave algorithm (GIPAW).[30] Revised
Perdew, Burke and Ernzerhof (PBE) functionals were used with the generalized gradient approximation for the exchange-correlation energy. The plane wave basis set cut-off was set to 300 eV and 16 k-points were sampled. Proton positions were inserted manually and optimized using a Broyden-Fletcher-Goldfarb-Shanno optimization algorithm, [34] with the lattice parameters and coordinates of all other atoms fixed. Ultrasoft 14N
pseudopotentials were used for the EFG calculations.[35]
Results and Discussion
Potential energy curve
The calculated potential energy curves as a function of the N ∙∙∙ H distance in solid TMAC are shown in Figure 3. All calculations were performed on isolated TMAC, with
the exception of those employing CASTEP, which used the extended crystal structure. In all calculations the methyl groups, nitrogen atom and chloride ion are held in positions corresponding to the solid state structure and the hydrogen position is varied while being kept co-linear with the nitrogen and chloride atoms. The N ∙∙∙ Cl distance in solid TMAC is 3.005 Å.[10] The N – H distances were varied, in steps of 0.05Å, from that for a typical N – H bond length (1.0 Å), to that corresponding to complete transfer of the proton to the chlorine atom (1.7 Å). As one can see, the PE curve depends strongly on the method used in the calculation. Relative to structure 1a the energies of structure 1c are 27.0 kJ/mol for HF/6-311++G(d,p), -2.9 kJ/mol for MP2/6-311++G(d,p), 5.3 kJ/mol for B3LYP/6-311++G(d,p) and 8.3 kJ/mol for CC(SD)/aug-cc-pvtz. Plane wave calculations show no minimum corresponding to structure 1c. Each isolated molecule curve has a short N – H distance minimum, corresponding to structure 1a, and a long N – H distance minimum, corresponding to structure 1c. These distances are, respectively, 1.060/1.657 Å for HF/6-311++G(d,p), 1.144/1.615 Å for MP2/6-HF/6-311++G(d,p), 1.144/1.561Å for B3LYP/6-311++G(d,p) and 1.11/1.63Å for CC(SD)/aug-cc-pvtz (estimated from curve). The plane wave calculations yield a structure 1a minimum energy at 1.10 Å. In all cases the
optimized short distance is longer than that obtained from an optimized structure of the isolated Me3NH+cation (1.02 ± 0.01Å for all isolated TMAC calculations). This is
consistent with the elongation of the N – H bond expected for an N – H ∙∙∙ Cl hydrogen bond.
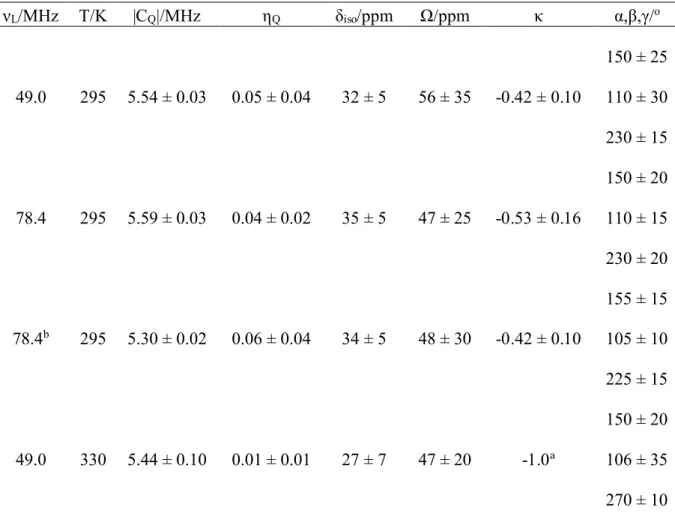
The room temperature35Cl spectra of static samples of TMAC obtained at 11.75T and
18.8T are shown in Figure 4. The combined results of the analyses of these spectra, together with the 11.75T spectrum at 330K (see Figure 5) are provided in Table 1. The parameters obtained from the analyses of the 295K spectra at two fields are in very good agreement. The point symmetry at chlorine in the room temperature phase is C2vand this
is reflected in a κ value which is significantly different from ±1. However the ηQvalue is
still very close to 0. The shielding tensor is obviously more sensitive than the quadrupolar interaction to small deviations from C3symmetry due to crystallographic effects.
The phase above the transition is tetragonal which imposes axial symmetry on the chlorine. Our simulations show that the spectrum is rather insensitive to the κ value. We can simulate the spectrum at 330K with κ values of-0.75 to -1.0. Thus the κ value and ηQ
value are within experimental error of -1 and 0, respectively, at 330K. This is consistent with the crystallographic tetragonal symmetry and a chlorine site symmetry of C3v. In
addition to these changes, the Euler angle γ changes from 230º/225º to 270º. Although a previous attempt at a complete structure refinement of the tetragonal phase at 340K was not fully successful, a N ∙∙∙ Cl distance of 2.972(9)Å was determined.[11,12] This is 0.03(1)Å shorter than that in the monoclinic phase. Evidently the small structural changes that occur during the phase transition result in minor changes in the chlorine quadrupolar interaction and more significant changes in the asymmetry of the shielding tensor.
It is of interest here to compare the optimized N – H distance, the 35Cl C
Q, and the
chlorine shielding tensor for the monomer and extended lattice structures of solid TMAC. The optimized N – H distance in the monomer is 1.124Å (B3LYP/6-311G) and is 1.080Å for the extended lattice (CASTEP, using revised Purdew-Burke-Ernzerhof functionals).
The CQvalues for these structures are -14.9 and -9.6 MHz, respectively. In all cases the
ηQwas very close to zero. The calculated Ω/κ values are 138 ppm/-0.94 and 113.5
ppm/0.12, respectively.
There have been several 35/37Cl NMR studies of solids with N – H ∙∙∙ Cl
interactions.[19,35-38] Our observed CQand Ω values are consistent with these studies.
Of particular interest are the results for quinuclidine hydrochloride, which is structurally similar to TMAC. Both the │CQ│value of 5.25 ± 0.02 MHz and the estimated Ω of 50 ±
30 ppm are very close to our values for TMAC.[19]
Figures 6 and 7 show the computed dependence of the 35Cl C
Q and Ω values,
respectively, as a function of the N – H distance in isolated TMAC (heavy atoms held at X-ray structure values). The best agreement with experiment is with the HF calculation when r(N – H) = 1.0 Å. These calculations show that the magnitude of CQvalues steadily
decrease with decreasing distance and reach a value of about -6.0 MHz at 1.0 Å. This is reasonably close to our measured values considering that the fast rotational motion of the methyl protons and the methyl groups are not taken into account in these calculations. The computed spans of the chlorine shielding tensor steadily increase with N – H distance, reaching a maximum in the 1.5 to 1.6 Å range. The computed spans are in best agreement with the experimental values at 1.0 Å, but are still too large.
Although the CSA values we obtain have large errors associated with them, the fact that spectral analyses at two significantly different fields yield results which are in good agreement and compare favorably with previous work implies that our values are very reliable. [15] However, the Ω and κ values we obtained from our spectra are not in very good agreement with the calculations mentioned above.
At this point it is worthwhile to briefly discuss the effect of proton transfer on the chlorine quadrupolar coupling constant in general. Gas phase 35Cl C
Qvalues are available
for HCl (-67.6 MHz), H3N ∙∙∙ HCl (-47.6 MHz), and TMAC/TMAC-d1(-21.6/-19.7
MHz).[6,7] Comparison of these values with Figure 6 indicates that the magnitude of CQ
decreases as the proton is transferred from Cl to N. Our experimental value of (±)5.59 ± 0.03 MHz is indicative of complete proton transfer from Cl to N if one ignores
intermolecular and crystal lattice contributions to the CQin solid TMAC.
Isotope effect on the 35Cl quadrupolar coupling constant
The 35Cl spectra of TMAC and TMAC-d
1are shown in Figure 4. Results of simulations
of these spectra are provided in Table 1. The 35Cl C
Qvalues for TMAC and TMAC-d1are
clearly different, and the difference is easily outside the experimental error limits. This kind of isotope effect has been observed in the 35Cl C
Qvalues of TMAC as measured by
gas phase microwave spectroscopy. [6,7] In the gas phase, the CQof the deuterated
compound is 9% lower than that of the protonated compound. This is a rather significant shift in CQ. Our solid-state results show a 5% change, which is smaller, but also quite
significant.
An H/D isotope effect on the 35Cl C
Qvalues in a series of long chain
n-CxH2x-1NH3Cl alkylammonium salts has been reported. These show an average 2%
decrease in the 35Cl C
Qvalues on deuteration of all three N – H sites. [39] However, this
effect, which is presumably attenuated by the rapid rotation of the NH3+groups, is not
discussed in any detail. If the stretching potential of the N – H bond is anharmonic, deuteration will very slightly decrease the bond length. As can be seen from Fig. 6, a decrease in r(N – H) should result in a decrease in the magnitude of the 35Cl C
This is indeed what is observed. The degree to which deuteration affects the 35Cl C Q
value will depend on the anharmonicity of the N – H stretching potential. This can be demonstrated by comparing the deuterium isotope effect in gas and solid phase TMAC. Since the CQis much larger in the gas phase, it is likely that the N – H bond is slightly
longer, with a concomitant increase in anharmonicity. The expected result is a much larger isotope effect on the 35Cl C
Qin gas phase TMAC, as is observed.
Deuterium spectra and calculations
The deuterium spectra of the N – D deuteron in TMAC are expected to be quite sensitive to the degree of N – D ∙∙∙ Cl hydrogen bonding in solid TMAC. Figure 8 shows the deuterium quadrupolar echo spectrum of a static sample of TMAC-d1at 295K. The CQis
130 ± 5 kHz and the ηQis 0.03 ±0.03. The S/N was too low, and the required relaxation
delay was much too long, to obtain a series of temperature dependent spectra in a reasonable time. Instead, CP/MAS spectra were obtained at temperatures of 320K, 350K and 370K. The CP/MAS spectrum at 370K, together with a simulation, can be found in Figure 9. These spectra show a small component which increases in relative intensity with temperature (vide infra). It is of interest to note that the chemical shift, CQand ηQ
are essentially temperature independent over this temperature range. For example, at 295K and at 370K CQ, ηQand δisoare 127 ± 6 kHz, 0.06 ± 0.05 and 10.9 ± 0.9 ppm and
126 ± 5 kHz, 0.05 ± 0.05 and 10.9 ± 1.0 ppm, respectively. If the deuteron was rapidly hopping between two sites with significantly different quadrupolar and shielding
interactions, as would be implied by some of the potential energy curves in Figure 3, one would expect a measurable temperature dependence of CQand δiso. Also, the fact that CQ
and δisoare independent of temperature, suggests that there is no temperature dependent
wobbling motion of the trimethylammonium cation. This is a frequently observed phenomenon, particularly in small spheroid molecules, which causes a reduction of the observed CQwith temperature.[40] The N – H distance dependence of the computed
deuterium CQ values are shown in Figure 10. The HF, B3LYP and plane wave values
match the experimental CQat about 1.04 Å.
The 2H CP/MAS spectrum at 370K can be seen in Figure 9. This spectrum clearly
shows a very small component with a lower chemical shift and much smaller CQ(see
Figure 9 inset). At 370K CQ, ηQand δisofor this component are 22 ± 1 kHz, 0.09 ± 0.05
and 2.9 ± 0.3 ppm. The relative intensity of the minor component increases with temperature, reaching a maximum relative intensity of 2% and 370K. A plot of lnK versus 1/T yields a straight line with a slope corresponding to a ΔE of 16 kJ/mole. The appearance of the minor component can be interpreted as a result of the presence of a solid phase in which the Me3NH+cation is undergoing large amplitude precessional
motion. A wobbling, precessional, motion of the Me3NH+cation would require a partial
or complete breaking of the N – H ∙∙∙ Cl hydrogen bond. In the absence of hydrogen bonding, amine proton chemical shifts are in the range of 0.5 – 5 ppm.[41] Our B3LYP/6-311++G(d,p) calculations on isolated Me3NH+give δiso= 3.1 ppm. The
observed chemical shift of the minor component, at 2.9 ppm, is consistent with this situation. If the cation is precessing, the ratio of the CQvalues for the two components
yields an effective precessional angle of about 48º.
It should also be noted that the variation in peak intensity may be due to variations in CP efficiency. However, if this were the case, the intensity would be expected to
decrease with an increase in temperature as a larger amplitude wobbling motion should reduce the effective 1H-2H dipolar interactions.
It is only through the fortuitous coincidence of the minor component having a very different chemical shift and a much smaller CQthan the major component that we
are able to see it in the 2H CP/MAS spectrum. Unfortunately, the required signal-to-noise
ratios in the 35Cl, 14N, and 15N spectra are simply not achievable on our equipment with
practical amounts of spectrometer time. The 2H MAS spectrum of the methyl deuterated
sample and the 13C CP/MAS spectrum do not have the chemical shift resolution needed
to observe a species with such a low relative concentration and such a small chemical shift difference from the major component. Although the 1H spectrum has the sensitivity,
it is not possible to observe such a relatively small resonance in the presence of two large and broad lineshapes, in addition to the significant proton background of the probe. The best chance of observing the minor component is via a 15N CP/MAS spectrum of a 15N
enriched sample. However, such a sample is unavailable to us at this time.
Proton Spectra and calculations
The proton spectra of a static sample of powdered TMAC-d9is shown in Figure 11.
Nearly complete deuteration of the methyl group essentially eliminates any
intramolecular proton-proton dipolar coupling. The proton-deuteron dipolar coupling will be a factor of 6 smaller than proton-proton dipolar coupling and rapid methyl and
trimethyl rotation with reduce this coupling by a further factor of 9. As a result any dipolar couplings will simply add to the broadening of the spectral lines. There are two dominant lineshapes; an intense featureless peak, which constitutes 23% of the total
intensity and a broad lineshape corresponding to 77% of the total intensity. The spectrum can be deconvoluted into a component at 3.5 ± 0.8 ppm with a large linewidth and a component at 9.0 ± 1.0 ppm with a span of 45 ± 1.5 ppm and skew of – 0.88 ± 0.05 (CSA = 42 ppm and η = 0.13). We assign the 3.5 ppm component to residual protons on the methyl groups and the 9.0 ppm component to the N – H proton. The relative peak areas correspond to a residual concentration of methyl protons of about 3%, due to incomplete deuteration of the sample. A plot of the calculated span of the hydrogen CS tensor (skew = -1 in all calculations), as a function of N – H distance is depicted in Figure 12. The observed span is consistent with the isolated TMAC calculation for N – H distances ranging from 1.2 – 1.7 Å. The plane wave calculations disagree with the observed span for all distances. The isotropic chemical shift, obtained from simulation of the proton spectrum, is nearly 2 ppm smaller than that obtained from the deuterium CP/MAS
spectra. A primary isotope effect should move the chemical shift in the opposite direction [42]. The disagreement between the 2H and 1H spectra is likely due to the large error in
the determination of the proton shift. Unfortunately the severe proton background in our MAS probes made it impossible to obtain an analyzable MAS spectrum. The computed isotropic hydrogen chemical shifts are presented in Figure 13. The curves show δiso
values of 8 – 10 ppm for r(N – H) = 1.0 Å, typical of moderate hydrogen bonding. In the 1.3 to 1.4 Å range values of 15.5 – 17.5 ppm were calculated, consistent with strong hydrogen bonding. The chemical shift then returns to 8 – 10 ppm for r(N – H) = 1.7 Å, as would be expected for a weak Cl – H ∙∙∙ N bond. The best agreement between the
computed and observed hydrogen chemical shifts occurs in the range of 1.0 to 1.08 Å. Nitrogen spectra and calculations
The 14N powder pattern is shown in Figure 14. The outermost shoulders are somewhat
hidden in the noise, but given the well-defined nature of the main discontinuities, it was unnecessary to obtain these features with a higher S/N, and this experimental spectrum allowed an iterative simulation to be made which resulted in the experimental parameters │CQ│= 1.50 ± 0.02 MHz, ηQ= 0.02 ± 0.02 and δiso= -140 ± 50 ppm. CSA effects,
predicted by CASTEP to be on the order of 10 ppm, were neglected from the simulation. The uncertainties were estimated visually from the quality of fit, and the very large uncertainty in the isotropic chemical shift arises from the very broad nature of the lineshape. The EFG parameters, which are measured very accurately by this technique, are in good agreement with DFT values calculated from the crystal structure using the CASTEP software. These calculations show that the 14N C
Qis very insensitive to r(N –
H) in the 1.0 to 1.2 Å range. DFT calculations of CQfor the monomer are plotted , as a
function of N – H distance in Figure 15. It has been demonstrated that these parameters can generally be calculated from crystal structures with high accuracy if the crystal structure is well-defined and dynamics are absent. [23, 24] In this case, the lack of accurate proton positions and presence of dynamics will account for the discrepancy between the experimental and calculated values. The EFG tensor orientation predicted by CASTEP has the largest component of the tensor, V33, aligned with the N-H bond as
might be expected from the crystal structure. The most shielded component of the CSA tensor (δ33) is tipped away from V33by 74.5°.
The 15N CP/MAS spectrum (see Supplementary Information) yields a chemical
shift of -335.7 ppm with respect to liquid CH3NO2. Based on simulations of the
measure and we place the upper limit at 10 ppm. All of our calculations give values Ω values below 10 ppm and show very little variation with r(N – H). Analyses of the dipolar
15N spectra of TMAC and TMAC-d
1at 2.1 T completely ignored the effects of CSA.[5]
The calculated isotropic chemical shift is rather dependent on the method used and also shows very little variation with r(N – H).
The structure of TMAC
An evolving aspect of NMR crystallography is the use of solid-state NMR spectroscopy to refine structures in crystalline solids.[43] In the case of solid crystalline TMAC this was not possible. Comparison of the measured and calculated shielding and quadrupolar parameters yield only qualitative agreement that solid TMAC exists in structure 1a. The best determination to date of the hydrogen position in TMAC has been done through the measurement of 15N –1H and 15N –2H dipolar interactions by Hoelger and Limbach.[5] It
should be noted that these are the vibrationally averaged internuclear distances. This is evident from the slight shortening of the bond length, by about 0.01Å upon deuteration, which is consistent with what is expected for a somewhat anharmonic potential. The numbers are in good agreement with our CASTEP optimized value of 1.080Å.
Conclusions
A multinuclear NMR and quantum chemical study of solid trimethylammonium chloride was undertaken in order to investigate the effects of N – H ∙∙∙ Cl hydrogen bonding on
the various observable NMR parameters. In addition, the effects of N – H internuclear distance were calculated using different quantum chemical methods.
Calculations of the energy profile, as a function of r(N – H), are highly dependent on the computational method used. Calculations also show that the shielding and
quadrupolar interactions for 1/2H and 35Cl are very sensitive to the hydrogen position in
the 1.0 to 1.2 Å range of r(N – H), whereas the 14N C
Qis much less dependent.
Unfortunately, it was not possible to refine the hydrogen position based on comparisons of the calculated and observed NMR parameters as has successfully been done for the bromine position in solid MgBr2by Widdifield and Bryce.[43] With the
exception of the proton chemical shift anisotropy, the measured NMR parameters are consistent with a relatively short N – H bond (structure 1a). The high hydrogen chemical shift (10.9 ppm by 2H CP/MAS) and relatively small deuterium quadrupolar coupling
constant (127 kHz) indicate a moderately strong N – H ∙∙∙ Cl hydrogen bond. Our calculations show that the single molecule DFT and plane wave DFT calculations are often in reasonably good agreement. The exceptions being the hydrogen span, the 14N C
Qand, to a lesser degree, the 35Cl span. In some cases there is better
agreement between the computations and experiment in the r(N – H) range of 1.0 to 1.2 Å (the interval of most interest to this study) for single molecule DFT (e.g. chlorine span), and in some cases the agreement is better for the DFT plane wave calculations (14N
and 35Cl C
Qvalues). For crystalline compounds one would expect better agreement for
the plane wave DFT calculations. In the case of TMAC any lack of agreement is likely due to molecular dynamics in the form of methyl and trimethyl reorientation together with uncertainty in the methyl C – H bond lengths. The latter effect can be mostly taken
into account by using standard alkyl C – H bond lengths or by optimizing the methyl hydrogen positions for every calculation. The effects of the dynamics is more difficult to deal with since this effect would have to be weighted over the rotational potential energy functions for both methyl and trimethyl rotation.
Supplementary data
Supplementary data for this article are available on the journal Web site (canjchem.nrc.ca).
Acknowledgements
The Natural Sciences and Engineering Research Council of Canada is thanked for a Discovery grant (to GHP). The University of Guelph NMR Centre is supported by the Canada Foundation for Innovation and the Ontario Research Fund.
The National Ultra-High Field NMR Facility for Solids, Ottawa (www.nmr900.ca), is acknowledged for providing access to the 900 MHz facility and also for the use of the CASTEP software. In particular, Victor Terskikh and Eric Ye are acknowledged for assistance with the NMR experiments, and Paul Morris is thanked for help with probe construction and modifications.
One of the authors (GHP) would like to personally thank Rod Wasylishen for his hospitality during a postdoctoral fellowship (1986-88) and a sabbatical leave (2001).
References
[1] Jeffrey, G. A. An Introduction to Hydrogen Bonding, 1997, Oxford University Press: New York.
[2] Becker, E. D. “Hydrogen Bonding” in Encyclopedia of Magnetic Resonance, eds-in-chief R. K. Harris and R. E. Wasylishen, John Wiley: Chichester.
[3] Brown, S. P. “Hydrogen Bonding in Crystalline Organic Solids” ” in
Encyclopedia of Magnetic Resonance, eds- in-chief R. K. Harris and R. E. Wasylishen, John Wiley: Chichester.
[4] Roberts, J. E.; Harbison, G. S.; Munowitz, M. G.; Herzfeld, J.; Griffin, R. G. J. Am. Chem. Soc. 1987, 109, 4163.
[5] Hoelger, C.-G.; Limbach, H.-H. J. Phys. Chem. 1994, 98, 11803. [6] Legon, A. C.; Rego, C. A. J. Chem. Soc. Chem. Commun. 1988, 1496. [7] Legon, A. C.; Rego, C. A. J. Chem. Phys., 1989, 90, 6867.
[8] Bacskay, G. B.; Craw, J. S. Chem. Phys. Lett. 1994, 221, 167.
[9] Davies, A. S.; George, W. O.; Howard, S. T. Phys. Chem. Chem. Phys. 2003, 5, 4533.
[10] Lindgren, J.; Olovsson, I. Acta Crystallogr. Sect. B:Stuct. Sci. 1968, 24, 554. [11] Sugiyama, M.; Machida, M.; Koyano, N.; Iwata, Y. J. Korean Phys. Soc. 1996,
29, S537.
[12] Kido, J.; Machida, M.; Kobayashi, T. J. Korean Phys. Soc. 1996, 29, S542. [13] Huong, P. V.; Schlaak, M. Chem. Phys. Lett. 1974, 27, 111.
[14] Andrew, E. R.; Canepa, P. C. J. Magn. Reson. 1972, 7, 429. [15] Sjöblom, R.; Tegenfeldt, J. Acta Chem. Scand. 1972, 26, 3075. [16] Sjöblom, R.; M. Punkkinen. J. Magn. Reson., 1975, 20, 491. [17] Machida, M. Ferroelectrics, 2006, 338, 205.
[18] Pople, J. A.; Beveridge, D. L. Approximate Molecular Orbital Theory. 1970, McGraw-Hill, New York, USA.
[19] Bryce, D. L.; Gee, M.; Wasylishen, R. E. J. Phys. Chem. A 2001, 105, 10413. [20] O’Dell, L.A.; Schurko, R.W. Chem. Phys. Lett. 2008, 464, 97.
[21] O’Dell, L.A.; Rossini, A.J.; Schurko, R.W. Chem. Phys. Lett. 2009, 468, 330. [22] O’Dell, L.A.; Schurko, R.W. J. Am. Chem. Soc. 2009, 131, 6658.
[23] O’Dell, L.A.; Schurko, R.W. Phys. Chem. Chem. Phys. 2009, 11, 7069. [24] O’Dell, L.A.; Schurko R.W.; Harris, K.J.; Autschbach, J.; Ratcliffe, C.I. J.
Am.Chem. Soc. 2011, 133, 527.
[25] O'Dell L.A.; Ratcliffe C.I., Chem. Commun. 2010, 46, 6774.
[26] Eichele, K.; Wasylishen, R. E. WSOLIDS NMR simulation package. Version 1.19.11. 2009.
[27] Massiot, D.; Fayon, F.; Capron, M.; King, I.; Le Calvé, S.; Alonso, B.; Durand, J.O.; Bujoli, B.; Gan, Z.; Hoatson, G. Magn. Reson. Chem. 2002, 40, 70.
[28] Frisch, M. J.; Trucks, G. W.; Schlegel, H. B.; Scuseria, G. E.; Robb,M. A.;
Cheeseman, J. R.; Montgomery, J. A., Jr.; Vreven, T.; Kudin, K. N.; Burant, J. C., et al. Gaussian 03, revision C.02; Gaussian, Inc.: Wallingford, CT, 2004.
[29] Adiga, S.; Aebi, D; Bryce, D. L. Can. J. Chem. 2007, 85, 496.
[30] Clark, S.J.; Segall, M.D.; Pickard, C.J.; Hasnip, P.J.; Probert, M.J.; Refson, K.; Payne, M.C. Z. Kristallogr. 2005, 220, 567.
[31] Pickard, C.J.; Mauri, F. Phys. Rev. B 2001, 63, 245101.
[32] Profeta, M.; Mauri, F.; Pickard, C.J. J. Am. Chem. Soc. 2003, 125, 541. [33] Yates, J.R.; Pickard, C.J.; Mauri, F. Phys. Rev. B 2007, 76, 024401.
[34] Pfrommer, B.G.; Cote, M.; Louie, S.G.; Cohen, M.L. J. Comput. Phys. 1997, 131, 233.
[35] Gervais, C.; Dupree, R.; Pike, K. J.; Bonhomme, C.; Profeta, M.; Pickard, C. J.; Mauri, F. J. Phys. Chem. A 2005, 109, 6960.
[36] Bryce, D. L.; Sward, G. D. J. Phys. Chem. B 2006, 110, 26461.
[38] Chapman, R. P.; Bryce, D. L. Phys. Chem. Chem. Phys. 2007, 9, 6219. [39] Honda, H. Z. Naturforsch. 2003, 58a, 623.
[40] Sidhu, P. S.; Bell, J.; Penner, G. H.; Jeffrey, K. R. Can. J. Chem. 1996, 74, 1784. [41] Pavia, D. L.; Lampman, G. M.; Kris, G. S. Introduction to Spectroscopy, 2ndEd.
Saunders 1996. page 119.
[42] Perrin, C. L.; Nielson, J. B. Ann. Rev. Phys. Chem. 1997, 48, 511.
Table 1 νL/MHz T/K |CQ|/MHz ηQ δiso/ppm Ω/ppm κ α,β,γ/o 49.0 295 5.54 ± 0.03 0.05 ± 0.04 32 ± 5 56 ± 35 -0.42 ± 0.10 150 ± 25 110 ± 30 230 ± 15 78.4 295 5.59 ± 0.03 0.04 ± 0.02 35 ± 5 47 ± 25 -0.53 ± 0.16 150 ± 20 110 ± 15 230 ± 20 78.4b 295 5.30 ± 0.02 0.06 ± 0.04 34 ± 5 48 ± 30 -0.42 ± 0.10 155 ± 15 105 ± 10 225 ± 15 49.0 330 5.44 ± 0.10 0.01 ± 0.01 27 ± 7 47 ± 20 -1.0a 150 ± 20 106 ± 35 270 ± 10
aUpper limit. This value can vary from -0.75 to -1.0 without affecting the lineshape. b
Results for TMAC-d1.
Table 2
aExtracted from 2H spectrum recorded at room temperature.
|CQ| /MHz ηQ δiso/ppm Ω/ppm κ ∆δ ηCS 2Ha 0.127±0.006 0.06±0.05 10.9±1
1H - - 9.0±1.0 45±1.1 -0.88±0.05 42±1 0.13±0.04 14N 1.50±0.02 0.02±0.02 -141±50 ≤10 ≤10
Figure Captions Figure 1
Three possible species of TMAC. a) Me3NH+Cl−, b) Me3N∙∙∙H∙∙∙Cl and c) Me3N∙∙∙HCl.
Figure 2
The crystal structure of TMAC in the monoclinic phase showing a heptamer. Figure 3
Hydrogen atom displacement potential energy curves for TMAC with all heavy atoms fixed in their crystal structure positions while the H atom positions were optimized. Diamonds: single molecule HF/6-311++G(d,p), circles: single molecule CC(SD)/aug-cc-pvtz, squares: single molecule B3LYP/6-311++G(d,p), yellow crosses: single molecule MP2/6-311++G(d,p), red triangles CASTEP. The curves are included as a visual guide. Figure 4
A) The static 35Cl spectrum of TMAC at 11.75T (upper trace) together with simulation
(lower trace). B) The static 35Cl spectrum of TMAC-d
1at 18.8T (upper trace) together
with simulation (lower trace). C) The static 35Cl spectrum of TMAC at 18.8T (upper
trace) together with simulation (lower trace). Figure 5
The 35Cl spectrum (upper trace) of a static sample of solid TMAC at 11.75T and 330K
together with simulation (lower trace). Figure 6
Plots of the calculated35Cl C
Qas a function of N – H distance for TMAC with all heavy
atoms fixed in their crystal structure positions while the H atom positions were optimized. Squares: B3LYP/6-311++G(d,p); diamonds: HF/6-311++G(d,p); triangles: GIPAW plane wave calculation.
Figure 7
Plots of the calculated span of the chlorine chemical shift tensor as a function of N – H distance for TMAC with all heavy atoms fixed in their crystal structure positions while the H atom positions were optimized. Squares: B3LYP/6-311++G(d,p); diamonds: HF/6-311++G(d,p); triangle: GIPAW plane wave calculation.
Figure 8
The quadrupolar echo spectrum of a static sample of TMAC-d1at 295K, together with a
simulation using CQ= 130 kHz and ηQ= 0.03. Effects of CSA were not included in the
simulation. The strong narrow peak at the center of the spectrum is due to traces of moisture in the sample (despite thorough drying). The lineshape is asymmetric due to an asymmetric distribution of points around the center of the echo.
The deuterium CP/MAS spectrum of a sample of TMAC-d1at 370K with sample
spinning rate of 5 kHz, together with a simulation using CQ= 126 kHz and ηQ= 0.05 and
δiso= 10.9 ppm.
Figure 10
Plots of the calculated 2H C
Qas a function of N – H distance for TMAC with all heavy
atoms fixed in their crystal structure positions while the H atom positions were optimized. Squares: B3LYP/6-311++G(d,p); diamonds: HF/6-311++G(d,p); triangle: GIPAW plane wave calculation.
Figure 11
Plots of the calculated hydrogen chemical shift as a function of N – H distance for TMAC with all heavy atoms fixed in their crystal structure positions while the H atom positions were optimized. Squares: B3LYP/6-311++G(d,p); diamonds: HF/6-311++G(d,p); triangle: GIPAW plane wave calculation.
Figure 12
Plots of the proton spectrum of a static sample of TMAC-d9(upper trace) together with
simulations of the contributions to the lineshape of the N – H proton (red) and residual CH3protons (blue). The convolution of the two components are combined to yield the
simulated lineshape. This is shown just below the experimental spectrum. Figure 13
Plots of the calculated span of the hydrogen chemical shift tensor as a function of N – H distance for TMAC with all heavy atoms fixed in their crystal structure positions while the H atom positions were optimized. Squares: B3LYP/6-311++G(d,p); diamonds: HF/6-311++G(d,p); triangle: GIPAW plane wave calculation.
Figure 14
(a) 14N spectrum obtained at 21.1 T, and (b) a fitted simulation made using parameters C Q
= 1.50 MHz, ηQ= 0.02 and δiso= 200 ppm.
Figure 15
Plots of the calculated 14N C
Qas a function of N – H distance for TMAC with all heavy
atoms fixed in their crystal structure positions while the H atom positions were optimized. Squares: B3LYP/6-311++G(d,p); diamonds: HF/6-311++G(d,p); triangle: GIPAW plane wave calculation.
Table Captions Table 1
Experimentally determined35Cl QC and CS NMR tensor parameters.
Table 2
Fig.1
Fig.4 Bo=18.8T Bo=18.8T Bo=11.75T A. Protonated B. Deuterated C. Protonated
Fig.5
Fig. 7
Fig. 9
Fig. 11
Fig. 13