Publisher’s version / Version de l'éditeur:
Structures Congress 2010: Proceedings of the 2010 Structures Congress, May 12-15, 2010, Orlando, Florida, pp. 1299-1309, 2010-05-01
READ THESE TERMS AND CONDITIONS CAREFULLY BEFORE USING THIS WEBSITE. https://nrc-publications.canada.ca/eng/copyright
Vous avez des questions? Nous pouvons vous aider. Pour communiquer directement avec un auteur, consultez la
première page de la revue dans laquelle son article a été publié afin de trouver ses coordonnées. Si vous n’arrivez pas à les repérer, communiquez avec nous à [email protected].
Questions? Contact the NRC Publications Archive team at
[email protected]. If you wish to email the authors directly, please see the first page of the publication for their contact information.
NRC Publications Archive
Archives des publications du CNRC
This publication could be one of several versions: author’s original, accepted manuscript or the publisher’s version. / La version de cette publication peut être l’une des suivantes : la version prépublication de l’auteur, la version acceptée du manuscrit ou la version de l’éditeur.
For the publisher’s version, please access the DOI link below./ Pour consulter la version de l’éditeur, utilisez le lien DOI ci-dessous.
https://doi.org/10.1061/41130(369)118
Access and use of this website and the material on it are subject to the Terms and Conditions set forth at
A simple approach for performance evaluation of structures in fire
Mostafaei, H.
https://publications-cnrc.canada.ca/fra/droits
L’accès à ce site Web et l’utilisation de son contenu sont assujettis aux conditions présentées dans le site LISEZ CES CONDITIONS ATTENTIVEMENT AVANT D’UTILISER CE SITE WEB.
NRC Publications Record / Notice d'Archives des publications de CNRC:
https://nrc-publications.canada.ca/eng/view/object/?id=f2ea2e81-3db2-4892-9330-fbecd3d4131e https://publications-cnrc.canada.ca/fra/voir/objet/?id=f2ea2e81-3db2-4892-9330-fbecd3d4131e
http://www.nrc-cnrc.gc.ca/irc
A sim ple a pproa c h for pe rfor m a nc e eva luat ion of
st ruc t ure s in fire
N R C C - 5 2 7 1 7
M o s t a f a e i , H .
J a n u a r y 2 0 1 0
A version of this document is published in / Une version de ce document se trouve dans:
The Structural Engineering Institute's 2010 Structures Congress Joint with the North American Steel Construction Conference, Orlando, Florida, May 12-15, 2010, pp. 11
The material in this document is covered by the provisions of the Copyright Act, by Canadian laws, policies, regulations and international agreements. Such provisions serve to identify the information source and, in specific instances, to prohibit reproduction of materials without written permission. For more information visit http://laws.justice.gc.ca/en/showtdm/cs/C-42
Les renseignements dans ce document sont protégés par la Loi sur le droit d'auteur, par les lois, les politiques et les règlements du Canada et des accords internationaux. Ces dispositions permettent d'identifier la source de l'information et, dans certains cas, d'interdire la copie de documents sans permission écrite. Pour obtenir de plus amples renseignements : http://lois.justice.gc.ca/fr/showtdm/cs/C-42
A Simple Approach for Performance Evaluation of Structures in Fire H. Mostafaei1
1
Institute for Research in Construction, National Research Council Canada, M-59, 1200 Montreal Road, Ottawa, Ontario K1A 0R6; PH (613) 993-9729; FAX (613)
954-0483; email [email protected] ABSTRACT
A simple performance-based test technique was developed for the fire resistance assessment of columns. In this method, the column specimen is tested using a conventional column furnace while it is coupled with a simple analytical model. The simplified model simulates the remainder of the building. The components of
interaction between the column specimen and the analytical model are deformations and loads. The new test approach includes the axial load-deformation interaction components. In other words, the axial load of the column specimen is varied
according to the structural system response. The simple approach was employed for different building frames and the results were compared and verified with those obtained from an analysis using the SAFIR computer software. This paper provides the theoretical concept and formulation of the simple hybrid test approach. Before putting the model in practice, it will be further verified through a future experimental program.
INTRODUCTION
Fire resistance testing provides a means of determining whether or not the building materials or elements meet minimum performance criteria as set out in the building codes. Traditionally, fire resistance ratings of building elements have been measured using the prescriptive test method, basically by assessing individual elements with no consideration to the interaction between a structural element and the structural system of the whole building. In other words, building elements such as beams and columns are tested separately from other building elements. Research has determined that the column load does not remain constant under high temperature. In fact, the load is greatly increased. Hence, a practical fire safety design of buildings requires
assessment and testing of structures based on the performance of the whole structural system. To this direction, this paper explores a new, simple, experimental technique to test the fire resistance of building columns with consideration of the effects from the structural systems. Further details of the new method, including numerical
examples for reinforced concrete and steel building frames, have been provided in two research reports previously published by the National Research Council Canada (Mostafaei and Mannarino, 2009 and Mostafaei and Hum 2009).
CONCEPT OF THE NEW TEST METHOD
Figure 1 illustrates the new simple fire test technique. It includes computer software or a simplified analytical model, and a column furnace test facility. The analytical tools model the entire building frame, except the column specimen, to determine the load-deformation interaction components between the column and remainder of the building. In this study, the simplified analytical model was developed and the computer structural engineering software, SAFIR, was implemented to verify the analytical results.
The analytical models are defined as load-deformation relations. The axial and lateral load-deformation curves are determined according to the axial and lateral thermal expansion of the structure. For this study, only the axial load-deformation relation is determined by the analytical process. Therefore, the column is fire tested under variable axial load. The value of the axial load is determined according to the frame stiffness calculated by the analysis. This process can be implemented in real time to feed back the test results into the analysis with the new mechanical properties at a given temperature of the column obtained from the test.
Interaction Between Test and Analysis Computer Analysis
or Analytical Modeling
Column Test Building Frame
Figure 1 A hybrid testing technique for assessment of fire resistance of columns considering the restraint conditions from the structural system.
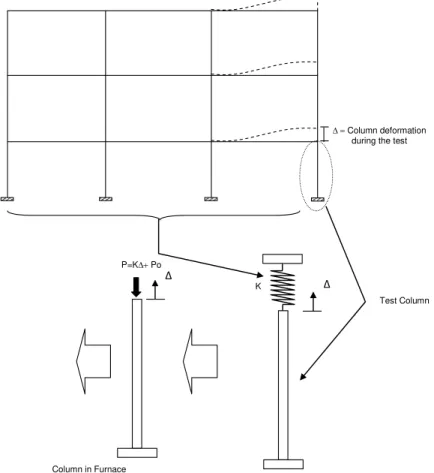
Figure 2 illustrates the test technique for testing of the right corner column of the first floor of a 3-bay, 3-storey frame. The main contribution from the frame in this method is the frame vertical stiffness in the direction of the test column’s axial thermal expansion. When the test column is exposed to fire it elongates vertically due to
thermal expansion which results in vertical displacement of the column. A future enhancement of this method is to include the horizontal component of thermal expansion as an extra horizontal spring model on the column.
When the column is at the ambient temperature, typically it is only under the initial axial load Po due to the gravity load. In order to include the effect of frame restraint, an additional deformation-dependent load (kΔ) is added to the initial load Po using Equation (1).
P=KΔ+ Po (1) where ∆ is the column axial deformation during the fire test; K is the vertical stiffness of the frame at the column’s support and Po is the initial applied axial load. The test can be implemented with either load or displacement control using Equation (1).
Δ = Column deformation during the test
Column in Furnace P=KΔ+ Po
Test Column K Δ
Δ
Figure 2. A simple performance based test technique for fire resistance of columns considering the restraint conditions from the structural system. INTERACTION COMPONENTS
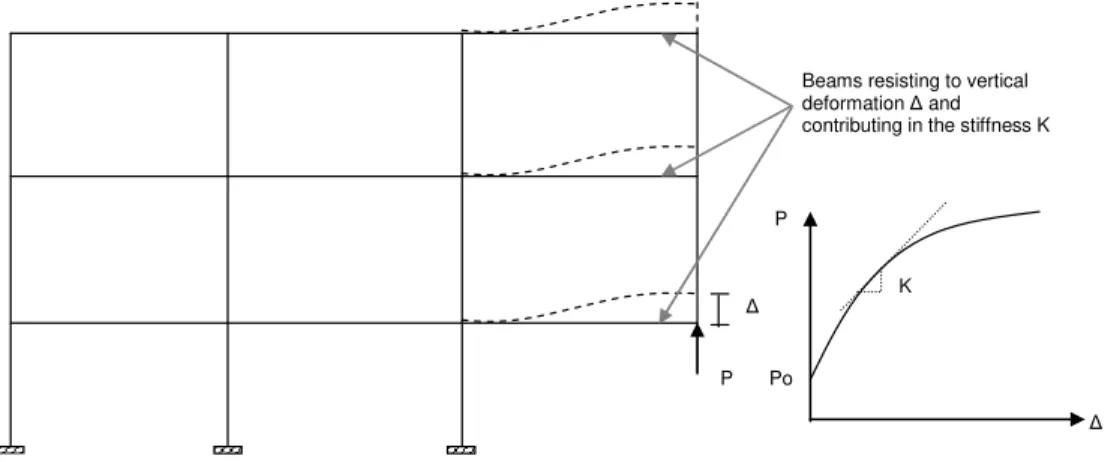
Figure 3 illustrates a three storey frame when it is detached from the test column. It shows the interaction components of load, P, and deformation, Δ, between the frame
and the test column and the vertical load-deformation, P-Δ, relation. The P-Δ curve is the main result obtained from the analysis which will be employed later to control the load/deformation of the test column during the test.
Δ P
Beams resisting to vertical deformation Δ and contributing in the stiffness K
Δ P
K
Po
Figure 3. Load and deformation interaction components between the column specimen and the remainder of the structural system.
THE SIMPLIFIED METHOD A Simplified Equation
An attempt was made to develop a simple analytical process to determine the structure vertical stiffness, K, implemented in hand calculation. In this method, K is determined according to Equation (2), derived for a beam with flexible supports.
∑ .
(2) where n is the number of beams that are resisting against vertical movement of the test column. In Figure 3, three beams are resisting vertical movement and are accordingly deformed. Therefore, n = 3 for a corner test column, but in case of the middle test columns, in the same figure, n = 6; E, I, and L are respectively Modulus of Elasticity, Moment of Inertia, and Length of the beam; i is an index number identifying a particular beam; and α, the Beam Connections Rigidity Factor, which is between 0 and 1, which in turn is determined based on the rigidity ratio of beam connections, as described in the next section. Derivation of Eq. (2) and numerical examples were provided by Mostafaei and Hum (2009).
Beam Connections Rigidity Factor
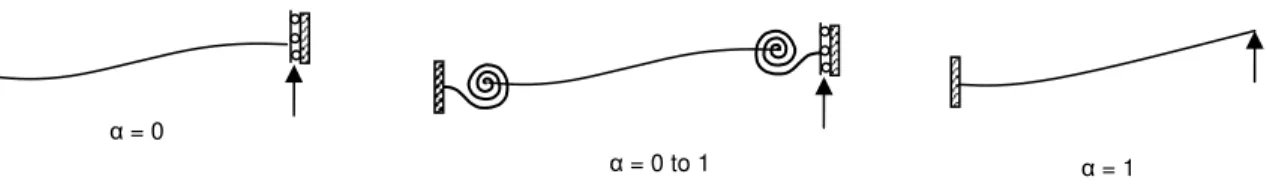
The rigidity of the beam connections is included in Equation (2) using factor α. Figure 4 illustrates values of α for different beam support conditions.
Figure 4. Factor α for fixed, variable and cantilever beams.
In general factor α could be determined by Equation (3).
(3)
where E, I, and L are components of the beam i and Ka and Kb are the beam’s end
support rigidities to rotation determined by Equation (4).
∑ ∑
.
(4) where E, I, and L are determined for the beams and columns connected to beam i in Equation (2), except the beam i. ma and mb are total number of beams and columns
connected to beam i at a and b respectively. Lateral Rigidity Factor, , of the beams and columns in Equation (4) is between 1 and 4 based on beam or column rigidity against lateral movement.
Lateral Rigidity Factor
For all beams, the lateral rigidity factor can be determined based on the axial rigidity of the columns in the frame, which is comparatively high for typical building
structures. In low to moderate rise frames, a between 3.0 and 3.5 would be
reasonable. This also applies to columns in a braced frame where lateral movements are limited by the bracing system. In this study, a value of is considered for lateral rigidity of the beams. For columns in moment-resisting frames, is relatively more variable and determined according to Equation (5).
(5)
where E, I, and L are calculated for the column and:
α = 0
∑
∑
(6)
where Ks is the lateral rigidity for column s; E, I, and L are components for column j
in floor i; n is number of floors in and underneath of column s and m is number of columns in floor i.
For simplicity, one may consider all the columns to be similar in equations (5) and (6), resulting in:
(7)
For the test column in Figure 2, n = 1 and m = 4, therefore, = 3.4.
Test Column
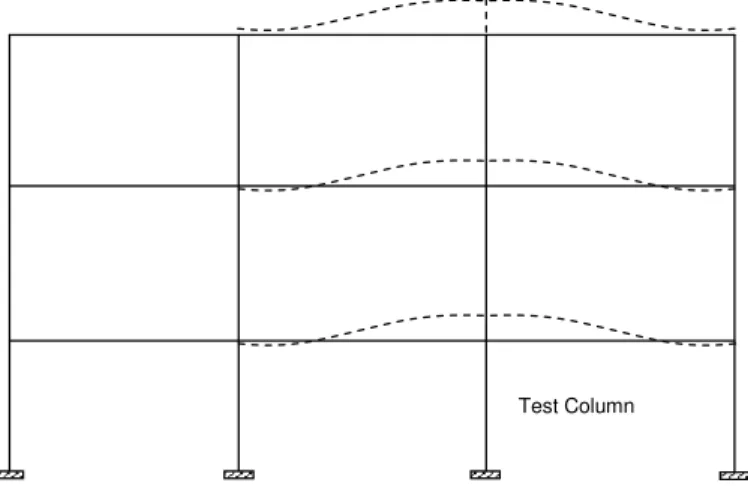
Figure 5. Roughly symmetric deformation and rotation in connections in frames when a middle column is selected for the test.
Equation (6) applies when all connections are rigid for rotation. In the case of a middle test column where there is more likelihood of symmetric frame deformations, as shown in Figure 6, this equation may be applicable. However, for a corner test column, due to asymmetric deformations (see Figure 6), connections are also rotating according to the beam’s stiffness. Based on the analysis implemented for different frames in this study, when a corner column is selected as the test column, is considered as 55% of the values determined by Equation (5). This value may be reduced for frames with higher number of floors, but for the group of frames in this study such a value seems reasonable. Further study is needed on this.
FULL ANALYSIS FOR MODEL VERIFICATION
For model verification, the entire structure frame was simulated using a structural analysis program. In this study, the SAFIR computer program, developed at the University of Liege for the simulation of the behavior of building structures subjected to fire (Franssen, 2007), was used for the analysis.
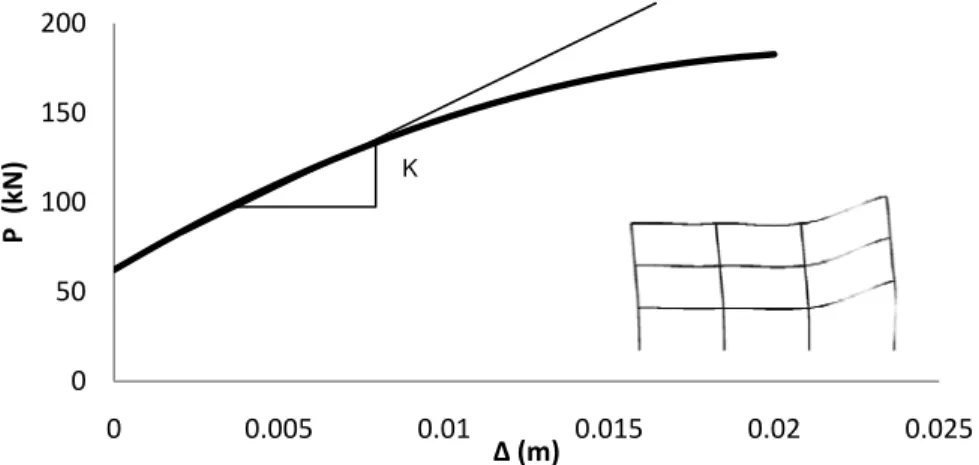
As an example, the full analysis method was applied using the SAFIR program for a three storey frame, frame U1, with material properties provided in Table 1 and Table 2. The results are illustrated in Figure 6. The P-Δ curve was obtained by simulating the entire frame and exposing only the test column to the ASTM E119 temperature-time curve.
Although the P-Δ curve is nonlinear at the large deformations, in most cases, the axial deformation of the test column would not exceed the linear part of the P-Δ curve. Therefore stiffness K may be considered constant for the duration of the test. This provides more stability and makes the load control process of the test easier. If the axial deformation exceeds the linear stage of the curve then the nonlinear relation for
K is used. 0 50 100 150 200 0 0.005 0.01 0.015 0.02 0.025 P (kN) Δ (m) K
Figure 6. P-Δ curve obtained by implementing a full analysis using the SAFI software.
MODEL VERIFICATION
Six steel frame prototypes with different heights have been selected for this study: model verification for reinforced concrete frames were provided by Mostafaei and Mannarino (2009). The analysis was implemented for both corner and middle test column cases. Beam and column details are provided in Table 1 and Table 2.
Dimensions of the frames are provided in figures 7(a) to 7(f). The frame sections and dimensions were selected according to typical steel building frames seen in the North America.
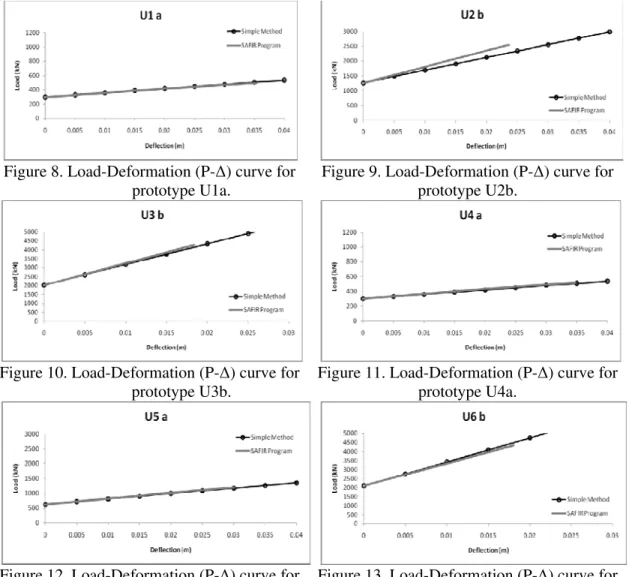
Both the full analysis method using the SAFIR program and the simplified method were implemented to determine the vertical frame stiffness corresponding to test columns of the frame prototypes. Some of the results were illustrated and compared in figures 8 to 13, for the full result see report by Mostafaei and Hum (2009). The comparison and correlation between the results of the two approaches indicate that the simplified method provides relatively acceptable values for the frame equivalent vertical load, P, deformation, Δ, and stiffness K.
Table 1. Details of frame prototypes.
Frame No. of
Stories Test Column
Column Serial Size (mm) Column Length (mm) Beam Serial Size (mm) Beam Length (mm)
U1a 3 1st floor, corner W360x370 (147.3) 3800 W610x180 (81.9) 7000 U1b 3 1st floor, middle W360x370 (147.3) 3800 W610x180 (81.9) 7000 U1c 3 2nd floor, middle W360x370 (147.3) 3800 W610x180 (81.9) 7000 U2a 6 1st floor, corner W360x370 (196.4) 3800 W610x230 (113.1) 7000
U2b 6 1st floor, middle W360x370 (196.4) 3800 W610x230 (113.1) 7000 U2c 6 2nd floor, middle W360x370 (196.4) 3800 W610x230 (113.1) 7000 U2d 6 5th floor, middle W360x370 (196.4) 3800 W610x230 (113.1) 7000 U3a 10 1st floor, corner W360x410 (236.6) 3800 W760x265 (147.3) 7000 U3b 10 1st floor, middle W360x410 (236.6) 3800 W760x265 (147.3) 7000 U3c 10 2nd floor, middle W360x410 (236.6) 3800 W760x265 (147.3) 7000 U3d 10 5th floor, middle W360x410 (236.6) 3800 W760x265 (147.3) 7000 U3e 10 8th floor, middle W360x410 (236.6) 3800 W760x265 (147.3) 7000 U4a 3 1st floor, corner W360x370 (147.3) 3800 W610x180 (81.9) 7000 U4b 3 1st floor, middle W360x370 (147.3) 3800 W610x180 (81.9) 7000 U4c 3 2nd floor, middle W360x370 (147.3) 3800 W610x180 (81.9) 7000
U5a 6 1st floor, corner W360x370 (196.4) 3800 W610x230 (113.1) 7000 U5b 6 1st floor, middle W360x370 (196.4) 3800 W610x230 (113.1) 7000 U5c 6 2nd floor, middle W360x370 (196.4) 3800 W610x230 (113.1) 7000 U5d 6 5th floor, middle W360x370 (196.4) 3800 W610x230 (113.1) 7000 U6a 10 1st floor, corner W360x410 (236.6) 3800 W760x265 (147.3) 7000 U6b 10 1st floor, middle W360x410 (236.6) 3800 W760x265 (147.3) 7000 U6c 10 2nd floor, middle W360x410 (236.6) 3800 W760x265 (147.3) 7000 U6d 10 5th floor, middle W360x410 (236.6) 3800 W760x265 (147.3) 7000 U6e 10 8th floor, middle W360x410 (236.6) 3800 W760x265 (147.3) 7000 W = Distributed load on beams, W (all beams) = 30000 N/m
E (steel)= 2.0×10¹¹ N/m2, fy (Steel)= 2.9×10⁸ N/m2
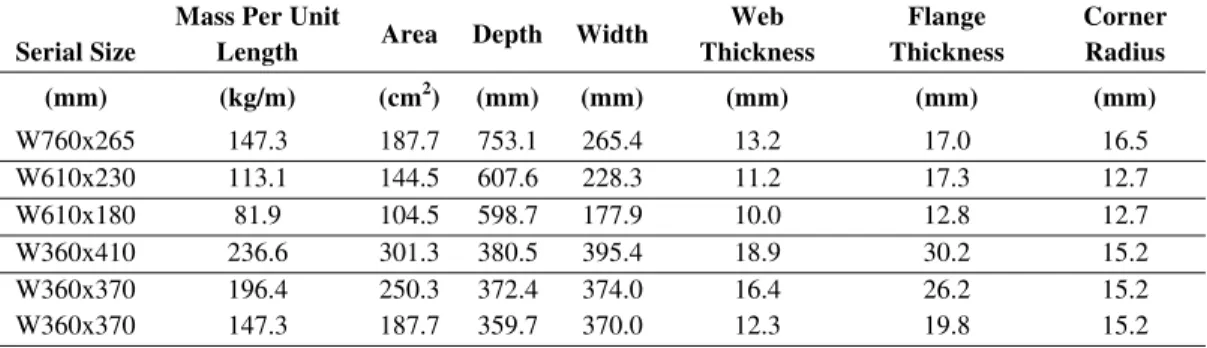
Table 2. Details of Steel.
Serial Size
Mass Per Unit
Length Area Depth Width
Web Thickness Flange Thickness Corner Radius (mm) (kg/m) (cm2) (mm) (mm) (mm) (mm) (mm) W760x265 147.3 187.7 753.1 265.4 13.2 17.0 16.5 W610x230 113.1 144.5 607.6 228.3 11.2 17.3 12.7 W610x180 81.9 104.5 598.7 177.9 10.0 12.8 12.7 W360x410 236.6 301.3 380.5 395.4 18.9 30.2 15.2 W360x370 196.4 250.3 372.4 374.0 16.4 26.2 15.2 W360x370 147.3 187.7 359.7 370.0 12.3 19.8 15.2
Figure 7(a). Details of columns and beams for frame U1. 7.0m 7.0m 7.0m Beams: W 610×82 Columns: W 360×147 3.80m 3.80m 3.80m Frame U1 a b c .
Figure 7(b). Details of columns and beams for frame U2
Figure 7(c). Details of columns and beams for frame U3
7.0m 7.0m 7.0m Columns: W 360×196 3.80m 3.80m 3.80m 3.80m 3.80m 3.80m All beams: W 610×113 Frame U2 a b c d 7.0m 7.0m 7.0m 3.80m 3.80m 3.80m 3.80m 3.80m All Columns W 360×237 3.80m 3.80m 3.80m 3.80m 3.80m Beams: W 760×147 Frame U3 a b c d e
Figure 7(d). Details of columns and beams for frame U4.
7.0m
7.0m 7.0m Beams: W 610×82 All Columns: W 360×147
3.80m 3.80m 3.80m 7.0m 7.0m Frame U4 a b c
Figure 7(e). Details of columns and beams for frame U5. 7.0m 7.0m 7.0m 3.80m 3.80m 3.80m 3.80m 3.80m 3.80m
All beams: W 610×113 All Columns: W 360×196
7.0m 7.0m Frame U5 a b c d 7.0m 7.0m 7.0m 3.80m 3.80m 3.80m 3.80m 3.80m All Columns W 360×237 3.80m 3.80m 3.80m 3.80m 3.80m Beams: W 760×147 7.0m 7.0m Frame U6 a b c e d
Figure 7(f). Details of columns and beams for frame U6.
CONCLUSIONS
A new hybrid test technique could be implemented to assess fire performance of building columns. The calculation process, developed in this study, is a simple method for determining the effect of the vertical structural frame response on fire resistance of the columns. Load and deformation of the test column, at the support, were examined to be the main interaction components between the analytical model and the test specimen. The method was implemented and verified for columns in different stories in six different steel building frames. Studies are still being carried out to implement the approach to include consideration of the lateral load due to floor thermal expansion.
ACKNOWLEDGEMENT
Acknowledgements are extended to Jessica Mannarino and Joe K. Hum, for their contributions in this study.
Figure 8. Load-Deformation (P-Δ) curve for prototype U1a.
Figure 9. Load-Deformation (P-Δ) curve for prototype U2b.
Figure 10. Load-Deformation (P-Δ) curve for prototype U3b.
Figure 11. Load-Deformation (P-Δ) curve for prototype U4a.
Figure 12. Load-Deformation (P-Δ) curve for prototype U5a.
Figure 13. Load-Deformation (P-Δ) curve for prototype U6b.
REFERENCES
Franssen, J.M. (2007). “User’s Manual For SAFIR 2007a Computer Program For Analysis of Structures Subjected to Fire.” University of Liege, Belgium.
Mostafaei, H., Mannarino, J. (2009). “A Performance-based Approach for Fire-Resistance Test of Reinforced Concrete Columns.” National Research Council
Canada, Research Report, No. 287.
Mostafaei, H., Hum, J.K. (2009). “A Hybrid Fire-Resistance Test Method for Steel Columns.” National Research Council Canada, Research Report, No. 292.