Critical Review of Thallium in Aquatic
Ecosystems
Research Report No R-1272
April 2011
Critical Review of Thallium in Aquatic Ecosystems
Final Project Report presented toInorganics Unit
Ecological Assessment Division Science and Technology Branch
Environment Canada Fontaine Building 200 Boulevard Sacré-Cœur
Gatineau QC K1A 0H3
EC Contribution Agreement with the CNTC for 2010/2011
Report prepared by
Patrice Couture, Claude Fortin, Landis Hare, Dominique Lapointe and Danaé Pitre Institut national de la recherche scientifique, Centre Eau Terre Environnement, 490 de la Couronne,
Québec, QC, G1K 9A9.
* Corresponding author: [email protected]
Research Report No R-1272 April 2011
Critical review of thallium in aquatic ecosystems
Patrice Couture, Claude Fortin, Landis Hare, Dominique Lapointe, Danaé Pitre INRS-ETE, Université du Québec, Quebec City, QC, G1K 9A9, Canada.
Table of contents
1. Summary: Why be concerned about thallium in the aquatic environment? ... 1
2. Thallium inputs to aquatic ecosystems ... 2
2.1. Natural sources and background concentrations of thallium... 2
2.2. Industrial sources of thallium... 2
2.3. Thallium concentrations in the abiotic environment ... 3
3. Thallium speciation... 4
3.1. Thallium speciation in water... 4
3.2. Thallium speciation in sediments... 5
4. Thallium bioaccumulation ... 5
4.1. Thallium accumulation by aquatic plants ... 5
4.2. Thallium accumulation by aquatic animals ... 7
5. Thallium transfer along aquatic food chains... 9
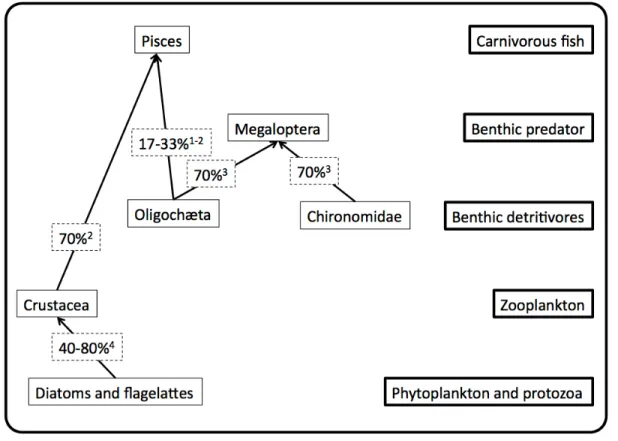
6. Thallium toxicity to aquatic organisms... 11
6.1. Thallium speciation and thallium toxicity ... 11
6.2. Thallium toxicity to bacteria, fungi and primary producers ... 12
6.3. Thallium toxicity to aquatic invertebrates ... 13
6.4. Thallium toxicity to fish... 14
6.5. Mechanisms of thallium toxicity ... 15
7. Knowledge gaps concerning thallium in aquatic ecosystems... 16
List of tables and figures
Table 1. Thallium concentrations reported in various abiotic environmental
compartments...17 Table 2. Formation constants of Tl(III) with hydroxide and chloride ions. ...21 Table 3. Thallium (I) concentrations reported in aquatic plants...22 Table 4. Thallium concentrations reported in aquatic animals and in the water or
sediment to which they have been exposed in either the laboratory or in the field. Values of [Tl] animal are for whole animals, except for some fish where values are for muscle (superscript a), liver (superscript b), kidneys (superscript
c) or gills (superscript d) only. Where fish concentrations are given in wet
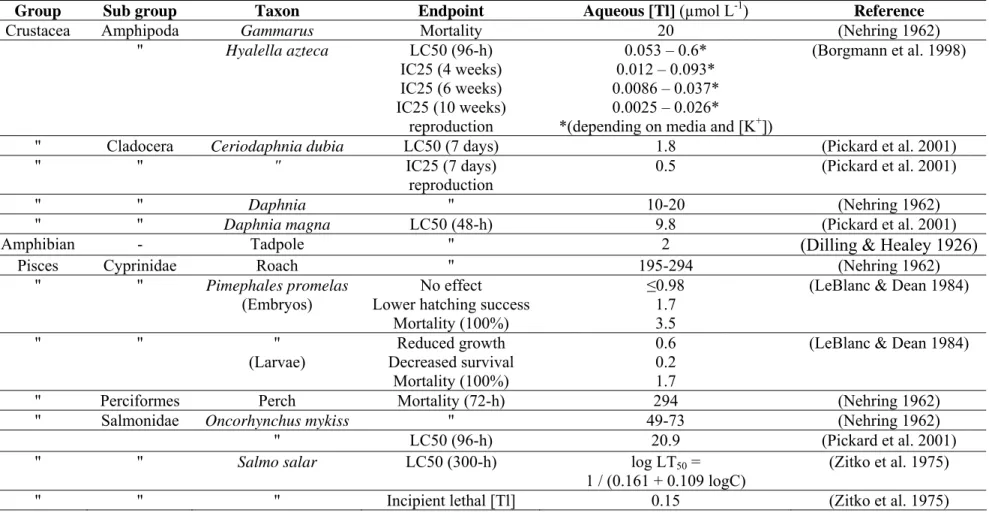
weights (superscript e) they have been converted to dry weights by assuming a ratio of 5:1, respectively (CRESP 2006). ...23 Table 5. Toxicity of Tl(I) to aquatic bacteria, fungi, and primary producers. ...24 Table 6. Toxicity of thallium to aquatic animals. ...26 Figure 1. Schematic diagram illustrating the efficiency with which thallium is
transferred among trophic levels in planktonic and benthic food webs...27 Figure 2. Relationship (means ± SD) between the assimilation efficiency of Tl by two
predators, the insect Sialis velata and the fish Pimephales promelas, and the proportions of Tl in various prey types (the worm T. tubifex, the insect C.
riparius and the crustacean D. magna) that are theoretically available for
uptake by these predators (TAM). The dashed line represents a 1:1
1. Summary: Why be concerned about thallium in the aquatic
environment?
First, for Tl to be considered of general environmental concern it needs to be present in the aquatic environment at concentrations that can elicit negative effects in living organisms. Second, it needs to reach these concentrations over a wide geographical area (confined local hot spots would nevertheless require adequate action) or in ecologically-critical areas or both. When these conditions are met, it usually indicates that human beings have increased the flux of an element from the Earth’s crust thereby altering its geochemical cycling. The corollary is that by altering human activities, the flux of the element can be decreased such that negative effects are minimized.
The answer to the first question, “is Tl present in the aquatic environment at concentrations that elicit negative responses in the biota”, is a tentative “yes”. Tentative, because most studies of Tl toxicity have been conducted in the laboratory where conditions rarely approximate those in the field. Still, the inherent toxicity of Tl as compared to those of other trace elements, as measured under similar laboratory conditions, gives cause for concern. For example, in water-only toxicity tests using a fresh-water amphipod (Borgmann et al. 1998), Tl was found to be less toxic than cadmium (Cd) and mercury (Hg), about as toxic as lead (Pb), and more toxic than copper (Cu), nickel (Ni), and zinc (Zn). In the case of mammals, Tl is reported to be the most toxic of the above-mentioned elements (Zitko 1975). These comparative results, although obtained in the laboratory under artificial conditions that are likely to overestimate Tl toxicity compared to cationic metals, indicate that caution is needed if industrial processes are likely to significantly increase Tl concentrations above background values usually found in the environment. The toxicity of Tl is likely related to the fact that Tl and the essential element potassium (K) are univalent cations with similar ionic radii. This means that Tl+ can compete with K+ at biological membranes and substitute for K in metabolic processes. Interference in the management of essential trace elements is clearly a means by which a non-essential metal such as Tl can produce negative biological effects. The tentative nature of the positive response to the question “is Tl present in the aquatic environment at concentrations that elicit negative responses in the biota” is also a consequence of the fact that field measurements of Tl in water, sediments and aquatic organisms are very limited. Furthermore, there is very little information available on Tl speciation in water and sediments collected in the field.
The answer to the second question, “is Tl present at concentrations of concern over a wide geographical area” is related to the means by which humans increase the flux of Tl to the environment. Human-related sources of Tl that are small in scale include its use in rat poisons, clinical epilators, and some alloys (Peter & Viraraghavan 2005). Although potentially harmful on a local or individual scale, such uses can be relatively easily controlled. For example, the use of Tl as a rat poison (Gratz 1973) has been banned by the World Health Organization and other health agencies (although its use for this purpose continues in some developing countries). However, humans are also involved in the generation of large-scale sources of Tl that make this element a contaminant of
concern. For example, Tl is present in coal and as such can enter the environment during coal mining, processing and use in coal-fired power plants and other coal-based industrial processes (Cheam 2000). Furthermore, Tl is present in sulfide-rich ores mined for copper, gold, lead, uranium and zinc (Peter & Viraraghavan 2005) and the refining of such ores can release Tl over a wide geographical scale. Given these facts, the answer to the second question is also positive.
The positive answers to the two basic questions about Tl concentrations and potential for toxicity in the environment suggest that a review of the state of knowledge of Tl in aquatic ecosystems is warranted so that research can be focused on filling knowledge gaps. By this means, Tl impacts could be more easily measured and understood and Tl use better regulated. Thus, we set out to summarize the current state of knowledge concerning Tl in fresh water ecosystems including inputs, speciation, bioaccumulation, transfer along food chains and toxicity. Lastly, we summarize knowledge gaps about this metal.
2. Thallium inputs to aquatic ecosystems
2.1. Natural sources and background concentrations of thallium
Thallium, a non-essential, malleable, metal, was named after the green spectral line that led to its discovery (from thallos, the Greek word for a green shoot or twig). The abundance of Tl in the Earth's crust (6x10⁻⁵ weight %) exceeds those of elements such as cadmium and lead that have received far greater scientific study (Korenman 1963). The reported average Tl concentration in the Earth's crust (3.9 nmol g-1) (Sahl et al. 1978) far exceeds that in the mantle (0.02 nmol g-1) (Brooks & Ahrens 1961). Thallium in the
Earth’s crust tends to be associated with igneous rocks (Sahl et al. 1978), with Tl concentrations being highest in sulfidic ores of copper, lead and zinc, arsenic-rich gold deposits and coal (Murao & Itoh 1992; Percival & Radtke 1993; Leach et al. 1995; Schaub 1996; Peter & Viraraghavan 2005). Exceptionally, minerals such as lorandite and crooksite can contain up to 60% Tl (Kazantzis 2000). Soil erosion, forest fires, and volcanic activity are the predominant means by which metals such as Tl are naturally mobilized into the aquatic environment.
2.2. Industrial sources of thallium
Although the industrial production of Tl is small (10 to 15 metric tonnes year-1 in
1991) compared to that of many trace metals, up to 5000 metric tonnes of Tl year-1 are mobilized worldwide through industrial processes (Schaub 1996). The most important anthropogenic sources of Tl to the environment are the combustion of fossil fuels and the smelting of ferrous and non-ferrous ores (Peter & Viraraghavan 2005). Emissions from coal-fired power-generating and cement plants can contain up to 700 and 2500 µg m-3 of Tl, respectively (Schaub 1996). Thallium-rich dust particles are produced during the smelting of metal-rich sulfidic ores, which allows Tl to be recovered as a by-product of the smelting process. For example, ~0.01 µmol of Tl can be recovered per gram of zinc
sulfide smelted (Nriagu 1998). Thallium is also recovered during the production of sulfuric acid (Nriagu 1998). Additional industrial sources of Tl include petroleum refining, brickworks and the production and use of potash-derived fertilizers (Schaub 1996; Cheam 2001). Thallium has been used for medicinal purposes as a hair-removal agent in the treatment of ringworm of the scalp as well as in the treatment of venereal diseases, tuberculosis and malaria (Schaub 1996; Kazantzis 2000). It has also been used as a rodenticide, an insecticide and a fungicide. Contemporary uses of Tl include the manufacturing of semiconductors, scintillation counters, thermometers, lasers, special types of glasses, fireworks, dyes, and metal alloys that resist corrosion, as well as its use as a catalyzing agent for many organic reactions (LeBlanc & Dean 1984; Schaub 1996; Nriagu 1998; Kazantzis 2000). Wastewaters from such industries represent potential sources of Tl to the environment.
2.3. Thallium concentrations in the abiotic environment
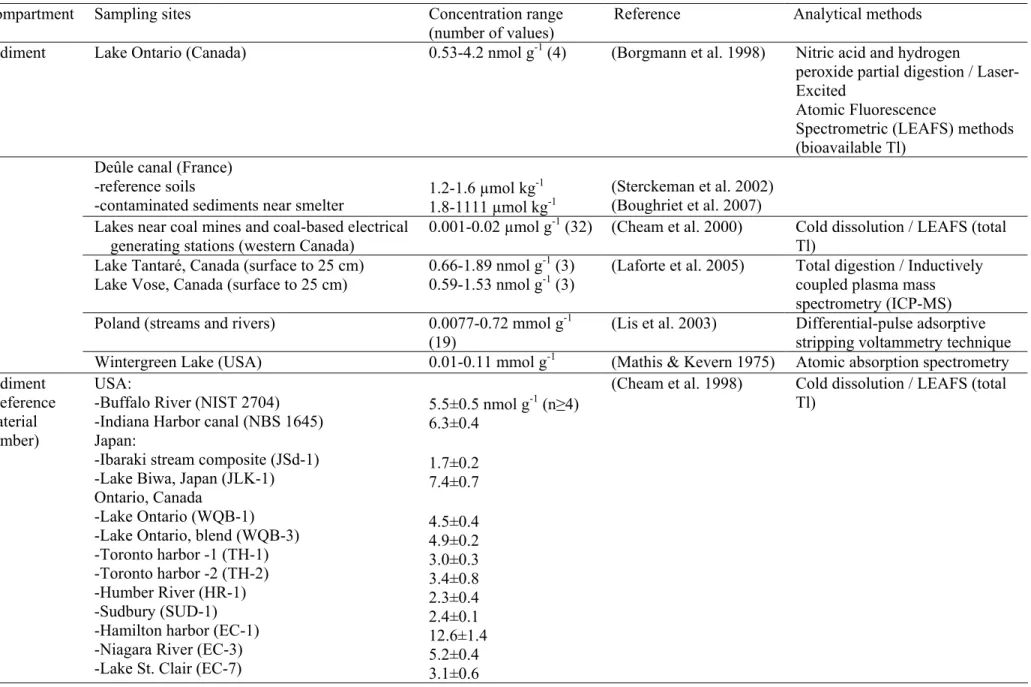
Thallium concentrations reported for various abiotic media are summarized in Table 1. In uncontaminated areas, Tl concentrations in air are usually < 5 pmol m-3, water concentrations are < 5 nmol L-1, and those in sediments < 5 µmol kg-1 (Schaub 1996). In China, high Tl concentrations (up to 171 mmol kg-1; Table 1) have been measured in
bedrock and ores from Guizhou province, whereas Tl concentrations in the bedrock of nearby areas is ≤ 1 µmol kg-1 (Xiao et al. 2004). Likewise, soils in Guizhou province had higher Tl concentrations (up to 600 µmol kg-1) than those in the background area (≤ 2.4 µmol kg-1) (Xiao et al. 2004). Kazantzis (2000) reported a range of 0.5 to 4.9 µmol kg-1 of Tl in soils, with very low levels in garden soils from China (0.05 µmol kg-1) and higher values near metallic ore deposits in Poland (24 µmol kg-1). Values up to 4.9 mmol kg-1 have been measured in shales and coals of the Jurassic period (Smith & Carson 1977).
In sediments from lakes on the Canadian Shield that have been subject to atmospheric deposition from a distant metal smelter, Tl concentrations are ≤ 2 nmol g-1
(Laforte et al. 2005). In sediments collected from harbors in Lake Ontario, Tl concentrations can reach 4.2 nmol g-1 (Borgmann et al. 1998), whereas in sediments from a eutrophic lake in Michigan Tl concentrations up to 100 µmol g-1 have been measured (Mathis & Kevern 1975). In areas in Poland subject to the influence of mining or smelting activities, Tl concentrations as high as 700 µmol g-1 have been reported for river sediments (Lis et al. 2003).
Thallium concentrations of 5.4 µmol L-1 in ground water from Guizhou province in China are the highest aqueous concentrations reported (Xiao et al. 2004). In surface waters (Table 1), Tl concentrations of up to 2.6 µmol L-1 have been measured in a French creek receiving acidic water from a mine (Casiot et al. 2011). Laforte et al. (2005) measured concentrations below 0.04 nmol L-1 of Tl in pristine lake water, whereas in waters near power generating stations in Eastern Canada, Tl concentrations can reach 115 nmol L-1 (Cheam et al. 2000). Compared to temperate regions, polar regions are subject
to few local sources of contamination. Thus, contaminants in the Arctic and the Antarctic are assumed to derive largely from atmospheric deposition. Thallium concentrations are
Siberian high pressure zone that brings air from Eurasia charged with contaminants to the Arctic (Barrie 1986; Barrie et al. 1992). In the Canadian Arctic, the natural background Tl concentration in snow and ice is <0.0001 pmol g-1 (Cheam 2001). However, concentrations up to 0.04 and 0.002 pmol g-1 have been reported for the Arctic and the Antarctic, respectively (Table 1; Baiocchi et al. 1994; Cheam 2001).
3. Thallium speciation
3.1. Thallium speciation in water
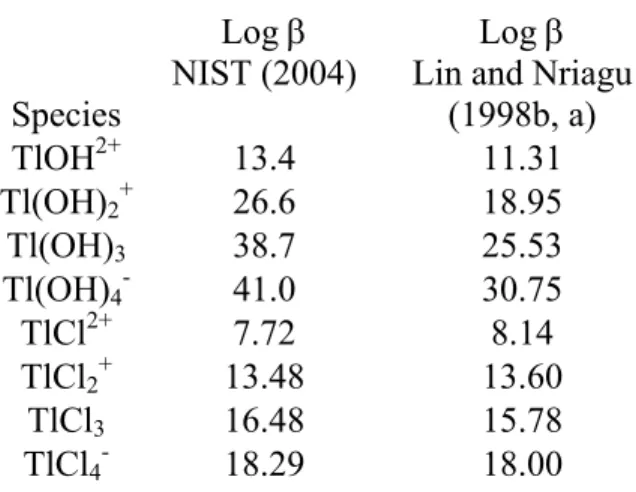
Dissolved thallium can be found in two oxidation states, Tl(l) and Tl(III). Although Tl(I) is predicted to be more thermodynamically stable than Tl(III), photo-oxidation reactions and microbial activity, combined with the formation of stable hydroxo-complexes, contribute to the persistence of Tl(III) in surface waters (Horvath et al. 1999; Twining et al. 2003; Li et al. 2005; Karlsson et al. 2006a). Tl(I) is poorly reactive, as are most monovalent cations. Although it is chemically “soft”, its poor reactivity results in little complexation by the inorganic ligands commonly found in surface freshwaters; this species of Tl also adsorbs weakly to sediments (Turner et al. 2010). It is thus expected that thallous ions (Tl+) will be present in free form in surface freshwaters over a large pH range (5-9; Xiong 2009). In contrast, based on the thermodynamic data recommended by the National Institute of Standards and Technology (Martell et al. 2004), the speciation of Tl(III) in the absence of organic matter would be dominated by the Tl(OH)30 species,
representing >99% of Tl(III) species present in typical freshwaters over a pH range of environmental pertinence (i.e. 5-9). Interestingly, Lin and Nriagu (1998a,b) proposed a set of hydrolysis constants that are very far from these values (Table 2), which, if used as binding constants, suggest a gradual transition from the TlOH2+ to the Tl(OH)
4- species
within a pH range of 5 to 9. Such discrepancies, and the lack of suitable speciation analytical methods for Tl, result in high uncertainties in predicting thallium speciation in freshwaters. Moreover, the extent of Tl(III) complexation by natural organic matter (fulvic and humic acids) is unknown.
Thallium concentrations in aqueous samples can be determined using a variety of techniques (see Chou and Moffat (1998) for a review). The redox state of Tl in natural samples can also be analytically determined (Chou & Moffatt 1998; Lin & Nriagu 1999a; Coetzee et al. 2003; Nolan et al. 2004; Karlsson et al. 2006b; Dadfarnia et al. 2007; Meeravali & Jiang 2008). Such investigations have shown that about 2/3 of the Tl present in the St. Lawrence Great Lakes is present as Tl(III) (Lin & Nriagu 1999b); similar ratios were found by Meeravali and Jiang (2008) in a surface water of Taiwan. However, the work of Karlsson et al. (2006b) has demonstrated the challenges in maintaining sample stability; they reported that Tl(I) was the dominant redox species in the boreal forest Lake Listresjön (Sweden). Similarly, most of the Tl was present as Tl(I) downstream from an abandoned mine in France (Casiot et al. 2011). Since the dynamics of Tl(I) – Tl(III) redox reactions remain to be fully elucidated, it is difficult to predict and to measure Tl partitioning between these two species in natural aquatic systems.
Thallium can also undergo methylation to form (CH3)2Tl+. This Tl form was
measured in the Atlantic Ocean, peaking at a depth interval of 40-200 m and representing up to 48% of the total Tl present (Schedlbauer & Heumann 1999, 2000). Given that there are no known anthropogenic sources of (CH3)2Tl+, the authors suggested that its presence
is most likely of biogenic, probably bacterial, origin.
3.2. Thallium speciation in sediments
There have been very few published studies on the behavior of sedimentary Tl, in part because one has to measure Tl in both sediment and interstitial water. Laforte et al. (2005) used porewater peepers to collect interstitial waters from two Canadian lakes: one with oxic overlying waters (L. Tantaré) and the other with anoxic overlying waters (L. Vose). Results from both lakes indicated that sediments act mainly as a sink for Tl, however, in one of the three profiles from the lake having the oxic hypolimnion, sediments were acting as a source of Tl (Laforte et al. 2005). This latter behavior was also observed in Lake Erie (Cheam et al. 1996; Cheam 2001). The removal mechanism of Tl from the water to the sediments is hypothesized to be by co-precipitation with Fe sulfide solids and/or adsorption onto these solids, whereas remobilization would be due to reduction of Tl(III) to the less reactive Tl(I) that would freely diffuse upward to the water column (Laforte et al. 2005).
Another approach for measuring Tl speciation in sediments is to use diffusive equilibria in thin films where the porewater equilibrates with a gel (instead of water, as in the peepers). This was used by Gao et al. (2007) in the sediments of the Leie river on the France-Belgium border. These provided high resolution profiles (down to 5 mm intervals), all indicating a similar pattern as the one observed in Lake Erie with Tl being remobilized as the sediments become anoxic.
4. Thallium bioaccumulation
4.1. Thallium accumulation by aquatic plants
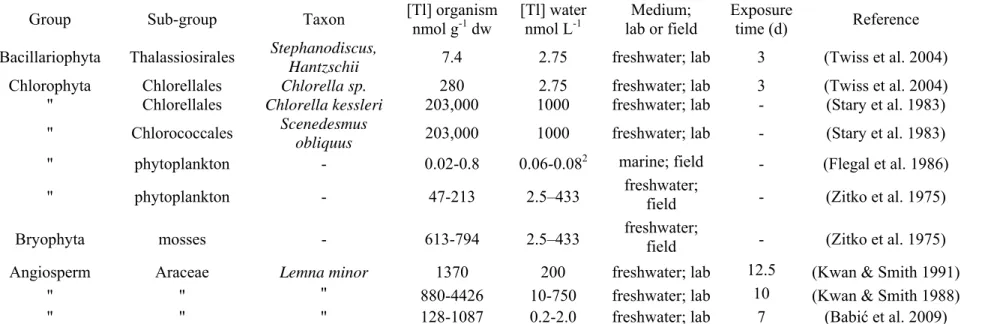
Table 3 summarizes the available information on Tl concentrations in aquatic primary producers, as measured in aqueous media; values are presented in nmol g-1 dry weight (dw), which necessitated the conversion of some data to these units. The reader should refer to the original publications for experimental details. In Table 3 we do not give bioconcentration factors (BCF), which are the ratio between the concentration of metal accumulated inside an organism and the concentration of dissolved metal in the medium. Indeed, BCFs have been developed for organic contaminants for which the uptake responds to a simple concentration gradient (outside Æ inside), but when applied to inorganic elements, they are often inconsistent with toxicological data due to possible saturation of transport systems, uptake inhibition by other ions and metal speciation in solution (McGeer et al. 2003).
Thallium concentrations in phytoplankton and macrophytes have been reported for very few species and most such values were obtained in the laboratory. The only published field study dates back over 35 years and reports high Tl values in primary producers from rivers contaminated by mining activities (Zitko et al. 1975). In most of the laboratory studies, Tl exposure concentrations and Tl speciation were not measured (e.g. the EDTA added to some exposure media would likely influence Tl(III) speciation). Depletion effects due to Tl uptake over time may in some studies have led to underestimates of Tl bioaccumulation. Overall, data on Tl accumulation by primary producers are quite sparse, especially for Tl(III) exposures, which limits our ability to understand mechanisms of Tl uptake by such organisms.
Thallium concentrations measured in phytoplankton and macrophytes span a large range of values and depend on the type of organism (Twiss et al. 2004), the exposure duration (Kwan & Smith 1991), the aqueous concentration of Tl (Kwan & Smith 1988) and the concentration of K+ in the exposure medium (Twiss et al. 2004; Hassler et al. 2007), as well as ambient pH. The influence of pH on Tl uptake has been studied in several plant species such as Lemna minor, Chlorella kessleri and Scenedesmus obliquus (Stary et al. 1983; Kwan & Smith 1991) and results suggest that Tl uptake is reduced at low pH, but is unaffected by changes in pH between 6 and 10. Under acidic conditions, reduced Tl uptake may be due to reduced metabolic activity and/or uptake inhibition by protons. However, since Tl(I) only hydrolyses under strongly alkaline conditions, Tl(I) speciation remains largely unchanged at higher, environmentally-relevant, pHs.
Thallium accumulation by primary producers has been shown to be carrier-mediated. Thus, when Kwan and Smith (1991) exposed Lemna minor to Tl(I) concentrations ranging from 0.1 to 100 μmol L-1, they noticed that Tl uptake was saturable, suggesting that Tl(I) transmembrane transport is by facilitated diffusion. When they compared Tl(I) uptake by Lemna minor in the light and the dark, uptake was reduced by 91% in the dark, which suggests that Tl(I) uptake is not by passive diffusion. Similarly, Twiss et al. (2004) measured the uptake of Tl(I) and dimethylthallium (DMT; Tl(CH3)2+) by the green alga Chlorella and the diatom Stephanodiscus hantzschii under
standard conditions (16°C, 14:10h light:dark cycle). The uptake of Tl(I) by these algae was greater than or equal to the uptake of DMT. Under conditions of reduced metabolic activity (1°C, darkness), the uptake of both forms of Tl was reduced. Although the lower temperature itself may have reduced influx, these results suggest that the uptake of both Tl(I) and DMT requires an active metabolism.
In an attempt to better understand the transport mechanisms responsible for Tl(I) uptake, some investigators have tested the idea that Tl uptake occurs via K+ transport systems. Thus Kwan and Smith (1991) exposed Lemna minor to Tl(I) and various concentrations of K+ ranging from 0.93 to 50 mmol L-1 and found Tl(I) uptake to be
inversely proportional to the concentration of K+. Similar results were obtained with the freshwater chlorophyte Chlorella and the diatom Stephanodiscus hantzschii (Twiss et al. 2004; Hassler et al. 2007). The opposite is also true since Tl+ is reported to inhibit K+ uptake in the cyanobacterium Synechocystis (Avery et al. 1991). Interactions between these elements can be explained by the fact that Tl(I) and K+ have similar atomic radii,
reactivity and mobility, which would allow Tl(I) to use K+-transport channels in the cell membrane. In fact, it has been verified that as much as 90% of Tl(I) uptake is via K+ transport systems (Na+/K+ ATPase-dependent, and Na+/K+/Cl- co-transport systems) (Brismar 1998). Tl(I) efflux from plant cells is reported to be rapid (Kwan & Smith 1991; Hassler et al. 2007), and this high turnover of Tl(I) inside Chlorella and L. minor is consistent with the use of K+ membrane transporters or channels. Moreover, because of the analogous behavior of Tl(I) and K+, it has been suggested that a great proportion of Tl may enter and accumulate within the cell vacuole using K+ active transport systems
(Kwan & Smith 1991).
Even though DMT uptake was found to be carrier-mediated, this organic form of Tl was not affected by the concentration of K+. It has been suggested that DMT may be too large to mimic K+ ions (Twiss et al. 2004), but the mechanism by which DMT enters cells is unknown.
To investigate the influence of calcium on Tl(I) accumulation, Kwan and Smith (1991) exposed L. minor to 1 μmol L-1 Tl(I) and various concentrations of Ca2+ (0.3-10 mmol L-1). After a 48-h exposure, Tl uptake was reduced by 40-45% in the high Ca
compared to low Ca medium. In contrast, Hassler et al. (2007) reported that a 1000 fold decrease in Ca2+ concentration from 0.25 mmol L-1 to 0.25 μmol L-1 did not have a significant effect on Tl(I) accumulation by Chlorella sp. Thus, even though an increase in Ca2+ can reduce Tl bioaccumulation in some taxa, it does not do so to the extent that K+
does. Furthermore, we do not know through what mechanism Ca2+might inhibit Tl uptake.
4.2. Thallium accumulation by aquatic animals
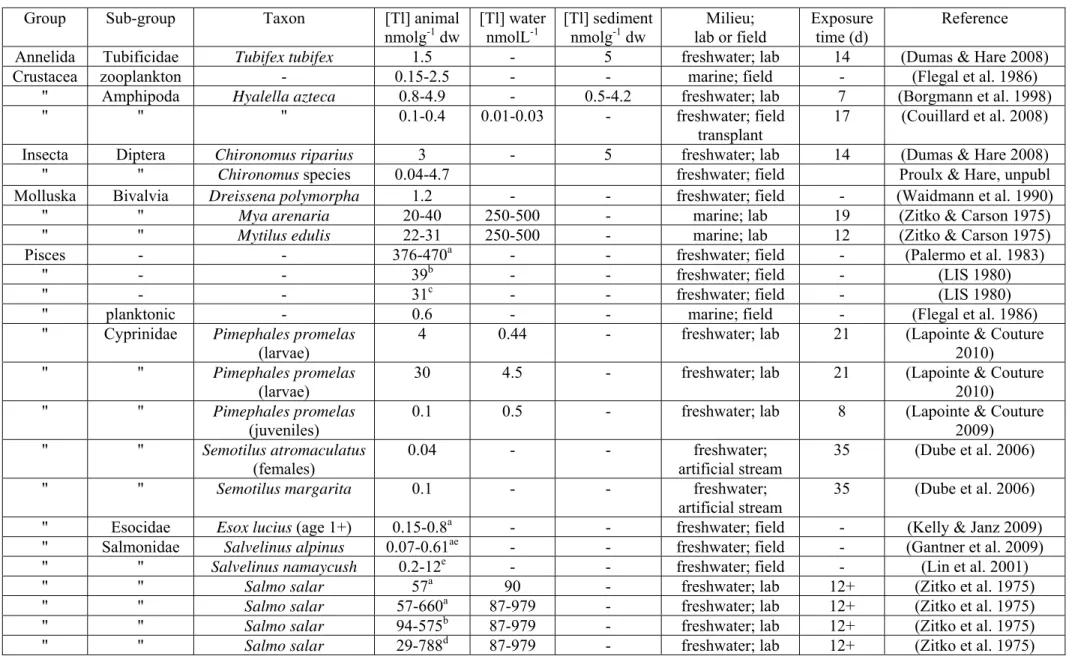
Table 4 summarizes the limited information available on Tl concentrations in aquatic animals. Of the large numbers of planktonic and benthic animals that live in fresh and marine waters, Tl concentrations have been measured in only about half a dozen types of invertebrates and in an equal number of fish species. Half of the reported values were measured following exposure to Tl in the laboratory. Although laboratory exposures can be of great value for understanding Tl bioaccumulation and trophic transfer, artificial Tl exposures run the risk of generating values that are not environmentally pertinent. First, whereas field values of Tl in water are reported to be in the tens of picomolar range (0.01-0.03 nmol L-1) (Couillard et al. 2008) some laboratory exposures have involved Tl
concentrations in the hundreds of nanomoles (e.g., Zitko & Carson 1975; Zitko et al. 1975). Exceptionally, dissolved Tl concentrations of tens of nanomoles can be measured in lakes directly downstream from metal smelters (40 nmol L-1; Ponton and Hare, INRS-ETE, unpublished), but these are not the rule. Second, animals in the laboratory are not always fed, or are fed uncontaminated food, and in such cases the contribution of dietary Tl is ignored. A noteworthy exception is the research of Lapointe and Couture (2009; 2010), who measured Tl uptake from both water and food and showed that prey can be an important source of Tl for some fish. Furthermore, Tl is reported to be efficiently transferred from prey to their predators (see following section), which suggests that
disregarding food as a Tl source for predators could underestimate Tl accumulation by and effects on these aquatic animals.
The only whole body Tl concentrations reported for wild fish are for an assemblage of marine planktonic fish (0.6 nmol g-1) (Flegal et al. 1986) from the central Pacific Ocean and for lake trout (Salvelinus namaycush; 0.2-12 nmol g-1) (Lin et al. 2001) from Lake Michigan (Table 4). In this lake, Tl concentrations in lake trout were correlated with their weight to age ratio (Lin et al. 2001). Arctic char (Salvelinus alpinus) collected from Lake Hazen (Ellesmere Island, Nunavut, Canada), an area supposedly little impacted by human activities, showed a wide range of muscle Tl concentrations (0.07 to 0.61 nmol g
-1) (Gantner et al. 2009). Muscle Tl concentrations in Northern pike (Esox lucius)
collected from lakes receiving uranium milling effluents were 4- to 5-fold higher than the concentrations measured in fish collected from uncontaminated lakes in the same area (Kelly & Janz 2009), but in the same range as values measured in Arctic char from a clean environment (Gantner et al. 2009), which suggests that atmospheric deposition in the Arctic may represent an important source of Tl to wild fishes. The highest Tl concentrations reported for fish muscle (470 nmol g-1) were for animals collected from a contaminated area (Table 4; Palermo et al. 1983). Unfortunately, most of the above-mentioned studies do not report Tl concentrations in either water or animal stomach contents (Table 4) and thus we cannot explore relationships between Tl concentrations in animals and those in water and their prey, nor can we elaborate on the principal route of exposure for animals.
In an artificial stream, creek chub (Semotilus atromaculatus) and pearl dace (Semotilus margarita) exposed to dilutions of metal mine effluents discharged from mining operations in Sudbury (Ontario, Canada) had Tl concentrations that were correlated to those of aqueous Tl; Tl concentrations were up to 9- and 19-fold higher in females and males, respectively, that had been exposed to metal mine effluents compared to those from the reference treatment (Table 4; Dube et al. 2006). However, the highest Tl concentrations measured in these two species (0.04-0.1 nmol g-1) were similar to those at the lower end of the range of concentrations reported for lake trout and Arctic char (Table 4). Thallium accumulation in muscle and liver of juvenile Atlantic salmon (Salmo
salar) exposed to aqueous Tl tended to increase with increasing dissolved Tl
concentration whereas accumulation in the gills remained constant regardless of exposure concentration (Zitko et al. 1975). For a given water Tl concentration, accumulation was greater in the gills, followed by the liver and the muscle (Zitko et al. 1975). Fathead minnow (Pimephales promelas) larvae exposed to aqueous Tl for up to 21 days readily accumulated Tl and reached body Tl concentrations up to 30 nmol g-1, whereas dietary Tl exposure did not significantly contribute to Tl accumulation (Table 4; Lapointe & Couture 2010). In contrast to larvae, juvenile fathead minnows significantly accumulated Tl from both aqueous and dietary sources (Lapointe & Couture 2009). Interestingly, juveniles had Tl concentrations 40-fold lower than those measured in larvae even though they were exposed to similar levels of aqueous Tl (Table 4).
Considering only data from field studies and realistic laboratory exposures (Table 4) suggests that Tl concentrations in whole animals can range from 0.1 to 30 nmol g-1 dry weight depending on: the type of animal (Dumas & Hare 2008), its age (Lapointe &
Couture 2009; Lapointe & Couture 2010), the Tl source (water, sediment, or food), the Tl exposure duration (Couillard et al. 2008), and the Tl and K concentrations in the exposure media (Borgmann et al. 1998).
We suggest that to better understand Tl exposure in nature, more Tl measurements are needed in a variety of aquatic animals from various types of lakes and rivers situated in different geographical regions. That Tl concentrations can vary by orders of magnitude in a given type of animal is exemplified by data for larvae of sediment-dwelling
Chironomus; Tl concentrations in this insect varied from 4.7 to 0.04 nmol g-1 in 14 lakes
located along a Tl gradient downstream from a metals smelter in western Quebec, Canada (Proulx and Hare, INRS-ETE, unpublished). Measurement of Tl in animals should ideally be accompanied by Tl measurements in water, sediments and gut contents so that relationships can be established between Tl exposure and Tl bioaccumulation, and so that prospective sentinels of Tl exposure can be tested. Estimates of metal exposure are a key part of ecological risk assessments, and measurements of metals in aquatic animals to be used as sentinels are effective for this purpose (e.g. Hare et al. 2008).
5. Thallium transfer along aquatic food chains
The ease with which elements such as Tl are transferred from one trophic level to the next is represented by their assimilation efficiency. This variable is a key component of biodynamic models, which have been used to describe changes over time in an animal’s trace element concentrations (Thomann 1981; Munger et al. 1999; Luoma & Rainbow 2005). Other food-related components of biodynamic models include the trace element concentration in an animal’s food and the animal’s ingestion rate. Trace elements vary widely in the efficiency with which they are assimilated, ranging from values close to 0% for americium to values approaching 100% for selenium (Reinfelder & Fisher 1994; Wang & Fisher 1999). For a given trace element, its assimilation efficiency depends on several factors including the availability of the element in the food particles and the digestive physiology of the consumer.
The few published studies describing Tl movements along aquatic food chains suggest that fresh water invertebrates and fish assimilate from one-fifth to three-quarters of the Tl present in their food (Figure 1). Efforts to understand these generally high assimilation efficiencies, as well as to explain differences among predators eating the same type of prey and for the same predator consuming different prey types, have centered on the use of fractionation techniques to measure the distribution of Tl among prey cell fractions. From these measurements one can deduce the likelihood that Tl will be available for uptake in a predator’s gut, and subsequent measurements of Tl assimilation by the predator can be used to validate these predictions.
Results using such fractionation techniques suggest that Tl is generally found in the cytosol of prey, as opposed to being associated with cell membranes from which Tl is less readily assimilated in the gut of a consumer having a rapid gut passage time. For example, fully 85% of the Tl in the floating aquatic plant Lemna minor is in the cytosol
(Smith & Kwan 1989), and comparable values for animal cells range from 64% in the insect Chironomus riparius (Dumas & Hare 2008), 45% in the crustacean Daphnia
magna, 29% in the oligochaete Tubifex tubifex (Dumas & Hare 2008), to 25-35% in the
minnow Pimephales promelas (Lapointe et al. 2009). Wallace and Luoma (2003) reported that consumers having a somewhat slower gut passage time could also assimilate metals associated with the cell organelles of their prey. Thus, they proposed that the sum of the trace metals in the cytosol and organelle fractions be referred to as trophically available metal (TAM). Reported values for trophically available Tl in aquatic animals range from 50% in T. tubifex and D. magna to 75% in C. riparius (Dumas & Hare 2008; Lapointe et al. 2009).
In P. promelas larvae younger than 21 days, prey did not constitute a significant source of Tl (Lapointe & Couture 2010). In contrast, dietary Tl assimilation in juveniles of this species was significant, with assimilation efficiencies varying from 17 to 70%, likely due to the wide range in their prey Tl concentrations (Figure 1, Lapointe & Couture 2009; Lapointe et al. 2009). Subcellular Tl partitioning in invertebrate prey did not influence Tl uptake by older fish (Lapointe et al. 2009).
Figure 2 compares, for three prey types (the oligochaete T. tubifex, the crustacean
D. magna, and the dipteran insect C. riparius), the proportions of Tl that are potentially
available for assimilation by a predator (TAM), to actual assimilation efficiencies measured for two aquatic predators, the alderfly Sialis velata (Megaloptera) and the minnow P. promelas. The values in Figure 2 are aligned along the one-to-one regression line, which suggests that measurements of prey Tl availability can be useful for predicting Tl assimilation by predators. However, a closer look at the data reveals that for a given predator there is no relationship between Tl assimilation efficiency and TAM. Thus, whereas the insect assimilated Tl with equal efficiency from two prey types, the values of TAM for C. riparius were 50% higher than those for T. tubifex (Dumas & Hare 2008). In contrast, prey consumed by the fish had the same %TAM, whereas the fish assimilated Tl much more readily from the crustacean D. magna (Lapointe et al. 2009). The authors of these studies provide possible explanations for these deviations from theoretical expectations. For example, Lapointe et al. (2009) report that differences in prey Tl concentrations can influence Tl assimilation efficiencies in fish. Furthermore, in both of the studies cited above, the authors note that a large proportion of prey Tl was found in a poorly-defined “debris” fraction, the availability of which is unknown. Thus, a better definition of what constitutes trophically available metal (TAM; Wallace & Luoma 2003) and characterization of the debris fraction that probably includes some TAM could improve prediction of trophic transfer from TAM (Dumas & Hare 2008).
The only metal source for aquatic birds is their diet. Thallium accumulation was examined in the liver and kidney of five species of dabbling ducks and three species of diving ducks in Japan (Mochizuki et al. 2005). Organ concentrations ranged between 0.0049 and 0.14 µmol g-1 dry weight and were about four times higher in dabbling compared to diving ducks. This difference in Tl concentrations could be due to differences in Tl concentrations in their prey (invertebrates and small fish) since dabbling
ducks feeding in shallow areas whereas diving ducks collect food in deeper parts of the same water bodies.
We conclude that the few available measurements of Tl transfer along aquatic food chains need to be supplemented with measurements of Tl trophic transfer for a greater variety of predators and their prey as well as measurements of Tl assimilation by consumers feeding on suspended (algae) and deposited particles. Lastly, Tl entry and loss rates from animals should be measured so that this information can be used in biodynamic models that would permit predictions of changes in Tl concentrations in animals over time and among animals living in a variety of aquatic systems.
6. Thallium toxicity to aquatic organisms
6.1. Thallium speciation and thallium toxicity
As suggested by the Biotic Ligand Model (BLM), toxicity will vary according to the concentration of the free metal ion in solution (Campbell 1995; Di Toro et al. 2001; Campbell et al. 2002). If the applicability of the BLM to divalent cations is well accepted in the scientific community, its applicability to trivalent metals is less well documented. Trivalent metals in natural systems are usually present predominantly as hydroxo-complexes and the proportion of the total metal present as the free metal ion is often extremely low. When Tl toxicity is expressed as a function of the free metal ion (Tl+ and Tl3+), Tl(III) is observed to be more toxic than Tl(I). Indeed, Ralph and Twiss (2002) found that Tl3+ was 50,000 times more toxic to the alga Chlorella than was Tl+. However, based on the total concentration, much more Tl(III) than Tl(I) is required to induce the same growth inhibition. This is due to strong Tl(III) complexation on the one hand, and weak Tl(I) complexation on the other hand. For these reasons, the redox species present in water must be taken into account when assessing Tl toxicity.
As mentioned earlier, in most of the laboratory studies, Tl exposure concentrations and Tl speciation are not measured. Complex growth and exposure media are frequently used and these often contain organic ligands such as EDTA. However, the speciation of Tl(III) in the presence of these simple monomeric organic ligands is uncertain due to the scarcity of thermodynamic data (e.g., log K values for Tl-EDTA+ range from 1024 to 1038) (Powell 2001). But as explained above (cf. section 3), Tl(I) has a relatively poor binding affinity to ligands such as EDTA (log K Tl-EDTA3- = 7.3) compared to other metals (e.g.
log K Cu-EDTA2- = 20.5). Indeed, in their experiment with the marine diatom Ditylum
brightwellii, Canterford and Canterford (1980) found that changes in EDTA
concentrations from 0.67 to 10 µM had a marginal effect on Tl(I) toxicity. Similar results were obtained by Lustigman et al. (2000). We did not, however, find any study that tested the influence of EDTA concentration on Tl(III) toxicity but it can be expected that Tl(III) speciation would be much more sensitive to the presence of carboxylic acids than Tl(I).
6.2. Thallium toxicity to bacteria, fungi and primary producers
Table 5 summarizes the available information on the toxicity of Tl to bacteria, diatoms, phytoplankton and macrophytes. The limited information available suggests that, in general, bacteria and acidophilic algae, closely followed by cyanobacteria, are more tolerant to Tl than are green algae and macrophytes. For example, the chlorophyte
Chlamydomonas reinhardtii was found to be more sensitive to Tl than the
cyanobacterium Anacystis nidulans (Lustigman et al. 2000). This difference in sensitivity may be due to differences in the physiology of prokaryotic versus eukaryotic microorganisms. These organisms may also differ in their ability to exclude, detoxify or acclimate to the presence of Tl (Lustigman et al. 2000).
As mentioned earlier, K+ and Tl+ ions are biogeochemical analogues and the presence of K+ ions will influence not only the uptake, but also the toxicity of Tl. For
example, Avery et al. (1991) showed that the concentration of intracellular K+ in the cyanobacterium Synechocystis was significantly reduced following exposure to Tl(I). They proposed that the replacement of K+ ions by Tl+ ions at the activation site of the enzyme (Na+/K+) ATPase prevents Na+ from leaving and K+ from entering the cell. In fact, the loss of cellular K+, an essential element involved in photosynthesis, was identified as one of the main mechanisms responsible for Tl(I) toxicity.
Similarly, K+ ions can alleviate Tl+ toxicity. For example, Hassler et al. (2007) showed that, when Chlorella was exposed to a fixed Tl(I) concentration, its specific growth rate was inhibited at a K+ concentration of 0.5 μmol L-1, whereas it was not or
only little affected in treatments with more than 10 μmol L-1 K+. In this study, ECX values
increased linearly as a function of the [K+] in solution confirming the existence of a protective effect of K+ by decreasing Tl+ access to sensitive biological sites. Similar results were obtained by Tuovinen and Kelly (1974) with acidophilic Thiobacillus
ferrooxidans. They showed that Tl inhibited growth at a concentration of 0.1 mmol L-1 in
a "potassium-free" medium, while it was not toxic at 1 mmol L-1 in a potassium-rich medium (4.6 mmol L-1 K+). In fact, Tl toxicity can be expressed using the [K] to [Tl] ratio. No growth inhibition of Chlorella was observed at log [K]:[Tl] > 1.8 (Hassler et al. 2007) when most of the biotic ligands were occupied by K. The onset of Tl(I) toxicity occurred at log [K]:[Tl] < 1.6, suggesting that [Tl] become sufficiently high to outcompete K for binding at the biotic ligand. These results suggest that the ratio of [K] to [Tl] could be considered in the establishment of water quality guidelines.
In experiments using Chlorella vulgaris, Tl(I) was more toxic to this alga than were Zn, Cd, Al, In, Se and As, as toxic as Cu, and almost as toxic as Hg (den Dooren de Jong 1965). In experiments with the bacteria Azotobacter chroococcum (I and IV) and A.
vinelandii, Tl(I) toxicity exceeded those of most other metals tested including Hg (den
Dooren de Jong 1971). Likewise, Brown and Rattigan (1979) showed that Tl(I) was more toxic to the macrophytes Lemna minor and Elodea canadensis than were Cd, Cu, As, Ag, Ni, Hg, Pb, and Zn. Smith and Kwan (1989) showed that the EC50 value for Tl toxicity to Lemna minor (0.2 μmol L-1) was lower than those of Cr, Ba, Cd, and Cu (75, 59, 1.7, and 1.3 μmol L-1, respectively). In a more recent study, Naumann et al. (2007) used many
endpoints (frond number, fresh weight, dry weight, chlorophyll and carotenoid content) to compare the toxicity of various metals to Lemna minor. All parameters indicated that Tl(I) ranked fourth in toxicity after Ag, Cd and Hg. It should be noted that all of these comparisons were made on the basis of total nominal aqueous trace element concentrations. Growth media used for toxicity tests using bacteria, algae and macrophytes usually contain high concentrations of nutrients such as phosphate, which may lead to metal precipitation, especially at the high metal concentrations needed to inhibit growth. Also, micronutrients such as Fe are buffered with a strong complexing agent (e.g. EDTA or citric acid). These metal buffers bind strongly to divalent and trivalent metals and will thus reduce the bioavailability of most of the tested metals. It follows then that, although the exact speciation of Tl in these experiments is unknown, it can be anticipated that the proportion of free Tl+ ion is high while the proportion of the other free metal ions is low. The relative toxicity of Tl(I) with respect to other metals is thus most likely overestimated in these experiments.
The marine diatom Ditylum brightwellii was also tested for its sensitivity to various metals including thallium (Canterford & Canterford 1980). In these experiments, the free metal ion concentrations were estimated using a thermodynamic model. Based on these calculated free metal ion concentrations, Tl(I) was the least toxic metal (i.e. Hg2+> Ag+> Cu2+> Pb2+> Cd2+> Zn2+> Tl+). Interestingly, similar results were obtained with the marine algae Vibrio fisheri (Hsieh et al. 2004). In this study, thallium was also concluded to be the least toxic compared to the 13 other trace elements tested (Be, Cu, Ag, Cr(VI), Hg, Cd, Zn, Se, Cr(III), Ni, Sb, Pb, As). However, it was not indicated whether the exposure medium used, consisting of commercial Microtox® chronic test reagent, contained EDTA or not. Based on these few experiments in which Tl(I) speciation was estimated, it seems that this thallium redox state is not very toxic. For an equivalent aqueous concentration, the trivalent Tl3+ ion seems much more toxic than the monovalent Tl+ but the trivalent ion represents an extremely low proportion of the total dissolved Tl such that actual [Tl3+] are expected to be much lower than [Tl+] in aquatic ecosystems. Indeed, redox speciation measurements (see section 3.1 above) have indicated that Tl(I) is either the dominant Tl species or may represent a significant proportion of total Tl, which suggests that toxicity due to Tl(I) is of greater concern than that due to Tl(III).
6.3. Thallium toxicity to aquatic invertebrates
Thallium toxicity to aquatic invertebrates has only been tested on rotifers and crustaceans. In a 4-day test using the rotifer Brachionus calyciflorus cultured in water from Lake Erie, Hassler et al. (2007) showed that K effectively inhibited Tl toxicity at K to Tl molar ratios above ~250, regardless of the Tl concentration used. Likewise, Borgmann et al. (1998) reported that Tl was less toxic in the presence of K, as measured by either the survival or growth of the amphipod crustacean Hyalella azteca. In artificial medium lacking K, the LC25 for survival (over 4 weeks) and the EC25 value for growth
(over 6 weeks) of H. azteca were 12 and 9 nmol L-1, respectively. Values for these parameters were higher in Lake Ontario tap water containing K (Table 6). These authors also ranked six trace metals with respect to their toxicity to this amphipod and found that
in water Tl was less toxic than Cd or Hg, was as toxic as Pb, and was more toxic than Cu, Ni or Zn. Thallium toxicity to planktonic crustaceans exposed to this metal in water is reported in Table 4. In these studies, the values of K in exposure water are not given and the feeding regime used is not always specified. Lin et al. (2005) compared the acute (48 hour) toxicities of Tl and other trace elements to the cladocerans Daphnia magna and
Ceriodaphnia dubia. They found that Tl was more toxic than Cd, Ni and Pb but less toxic
than Cu, Hg and Zn, which differs somewhat from the results obtained for the benthic crustacean H. azteca (Borgmann et al. 1998). Furthermore, they reported that C. dubia was 2.5 times more sensitive to Tl than was D. magna. Lan and Lin (2005) suggest that the toxicity of Tl to D. magna depends on its redox state; thus they found Tl(III) was more acutely toxic to this crustacean than was Tl(I). This result underlines the importance of considering Tl redox speciation in toxicity tests, which is rarely done. Overall, the results of this small number of laboratory studies suggest that Tl toxicity in water is likely to vary with K concentration, Tl redox state, and the type of invertebrate being tested. There have been no published studies comparing Tl toxicity when this metal is in water or in an invertebrate’s food or in both of these Tl sources.
6.4. Thallium toxicity to fish
Early life stages of fish have been identified as the most susceptible to the toxic effects of many contaminants (Macek and Sleight 1977; McKim 1977). The lowest dissolved Tl concentration for which toxic effects have been reported is 0.15 µmol L-1 for juvenile Atlantic salmon (Table 6; Zitko et al. 1975). Results of this study also suggested that Tl is as acutely toxic as copper, and that the toxicities of Tl-copper or Tl-zinc mixtures were not additive. At a similar level of exposure (0.2 µmol L-1), LeBlanc and Dean (1984) observed a decreased survival (60%) in fathead minnow larvae (Table 6). However, embryos showed a lower sensitivity to Tl as they were not affected when exposed to dissolved Tl concentrations as high as 0.98 µmol L-1 (Table 6; LeBlanc & Dean 1984). In contrast, lethal Tl concentrations for 50% mortality ranging from 20.9 to 294 µmol L-1 were reported for fish species such as roach, perch and rainbow trout (Table 6; Nehring 1962; Pickard et al. 2001).
Although fathead minnow embryos and larvae readily accumulated Tl from the aqueous phase, Tl concentrations up to 4.4 nmol L-1 had no effect on time to hatch, embryo survival, larvae routine metabolic rate and the activity of three enzymes (cytochrome c oxidase, lactate dehydrogenase, nucleoside diphosphate kinase; Lapointe & Couture 2010). However, juvenile fathead minnows fed Tl-contaminated Daphnia
magna showed lower glutathione s transferase (GST) and nucleoside diphosphate kinase
(NDPK) activity levels compared to fish fed uncontaminated prey (Lapointe et al. 2009). Although Tl can inhibit the glutathione-dependent antioxidant defense system in the rat brain (Hanzel et al. 2005), this was the first report of such an effect on fish. The effect of Tl on NDPK, an indicator of biosynthetic capacities, suggests that Tl might impair the growth of juvenile fathead minnows fed Tl-contaminated D. magna. These reported effects of Tl on indicators of metabolic capacities highlight the importance of considering dietary exposure to Tl in fish.
There have been no published studies of Tl toxicity to piscivorous fish, birds or mammals. Lin et al. (2001) estimated that the concentrations of Tl measured in lake trout from Lake Michigan (Table 4) could be toxic to humans who consume large quantities of this popular sport fish.
6.5. Mechanisms of thallium toxicity
Little is known about the toxic modes of action of Tl in living cells, although several mechanisms have been proposed based on experimental evidence mostly from the mammalian literature. Toxicity appears in good part due to the chemical similarity between Tl and K and the inability of cells to differentiate between these two metals (Galvan-Arzate & Santamaria 1998). As a result, Tl competes for uptake through the Na/K ATPase port. Given the high capacity of this membrane transporter to accumulate elevated concentrations of K, there is a strong potential for cells to accumulate Tl, which can then competitively interfere with any K-dependent physiological processes. For instance, Tl can replace K as an activating cofactor of enzymes such as pyruvate kinase and aldehyde dehydrogenase. Thallium can also replace the K used for ribosome stabilization and muscle contraction (Douglas et al. 1990, cited by Galvan-Arzate and Santamaria 1998). At high concentrations, Tl has been shown to cause swelling of mitochondria in mammalian axons. Thallium is preferentially accumulated by some organelles such as mitochondria. The little evidence available (reviewed in Galvan-Arzate & Santamaria 1998) suggests that toxic modes of action could involve membrane damage through phospholipid oxidation of mitochondria and of the endoplasmic reticulum, which would in turn affect membrane-bound physiological processes, such as ATPase activity. Furthermore, Tl may also affect membrane function through modifications of bilayer fluidity and phospholipid hydration, leading to increased permeabilization (Villaverde & Verstraeten 2003). The high affinity of Tl for sulfhydryl groups in enzymes and other molecules has also been invoked as a cause of toxicity (Aoyama et al. 1988; cited in Galvan-Arzate & Santamaria 1998). In mammals, Tl oxidizes the antioxidant GSH and inhibits glutathione peroxidase; inhibition of the antioxidant system may be one important mode of toxic action for Tl (Hanzel et al. 2005). This mechanism has also been observed in fish (Lapointe et al. 2009).
7. Knowledge gaps concerning thallium in aquatic ecosystems
a. Thallium redox speciation: No data are available on the kinetics of redox reactions of (Tl(I)/Tl(III)) in natural waters or the role that organic matter does or does not play in these reactions. The applicability of the Tl(I)/(III) separation technique remains to be demonstrated at environmentally realistic Tl concentrations.
b. Thallium-calcium interactions: Although Ca2+ has been reported to decrease Tl toxicity to some organisms, the mechanism for this phenomenon has not been identified. Given the wide variations in aqueous Ca concentrations in natural waters, the protective role of Ca from Tl toxicity should be investigated further. c. Thallium complexation: There is currently no known analytical method to
determine the free Tl concentrations in aqueous media. Also, thermodynamic data for Tl(III) are scarce and incoherent. Speciation calculations in the presence of simple monomeric organic ligands such as EDTA (commonly used in toxicity tests to buffer micronutrients in solution) are not possible. The extent of Tl complexation by natural organic matter also requires investigation. Incorporation of Tl(I and III) data into metal speciation models such as WHAM or NICA-DONNAN is necessary.
d. Thallium concentrations in field organisms: There are few published measurements of Tl in aquatic organisms living along Tl gradients in the field (e.g., in lakes downwind from coal-fired power plants or metal smelters). Such data would permit comparisons among organisms living in different kinds of habitats (plankton, nekton, benthos) and from different taxonomic groups (e.g., oligochaetes, crustaceans, insects, fish), as well as helping to identify those that would be useful candidates as sentinels of Tl exposure for use in ecological risk assessments.
e. Thallium in the cells of organisms: Nothing is known about the subcellular distribution of Tl in wild aquatic organisms. Methods to study subcellular metal distributions need refining so that the potential for toxicity and trophic transfer can be better predicted.
f. Thallium uptake and loss rates by aquatic plants and animals: Such information is lacking but is important for use in dynamic bioaccumulation models. Likewise, the relative importance of water and food as Tl sources for aquatic animals is poorly understood yet is necessary for modeling Tl exchange between the animal and its surroundings. If food is indeed an important Tl source for animals, then measurements of Tl transfer along food chains would be useful for explaining Tl concentrations in top consumers.
g. Thallium toxicity: Although there is a fair amount of data available on the toxicity of Tl(I) in the laboratory, many are anecdotal and almost all are based on nominal concentrations with no monitoring of actual [Tl] in exposure media. Measurements of sublethal endpoints are particularly scarce. Field measurements of Tl toxicity are lacking.
Table 1. Thallium concentrations reported in various abiotic environmental compartments.
Compartment Sampling sites Concentration range (number of values)
Reference Analytical methods Sediment Lake Ontario (Canada) 0.53-4.2 nmol g-1 (4) (Borgmann et al. 1998) Nitric acid and hydrogen
peroxide partial digestion / Laser-Excited
Atomic Fluorescence
Spectrometric (LEAFS) methods (bioavailable Tl)
Deûle canal (France) -reference soils
-contaminated sediments near smelter 1.2-1.6 µmol kg
-1
1.8-1111 µmol kg-1
(Sterckeman et al. 2002) (Boughriet et al. 2007) Lakes near coal mines and coal-based electrical
generating stations (western Canada)
0.001-0.02 µmol g-1 (32) (Cheam et al. 2000) Cold dissolution / LEAFS (total
Tl) Lake Tantaré, Canada (surface to 25 cm)
Lake Vose, Canada (surface to 25 cm)
0.66-1.89 nmol g-1 (3)
0.59-1.53 nmol g-1 (3) (Laforte et al. 2005) Total digestion / Inductivelycoupled plasma mass
spectrometry (ICP-MS) Poland (streams and rivers) 0.0077-0.72 mmol g-1
(19)
(Lis et al. 2003) Differential-pulse adsorptive stripping voltammetry technique Wintergreen Lake (USA) 0.01-0.11 mmol g-1 (Mathis & Kevern 1975) Atomic absorption spectrometry
Sediment (Reference material number)
USA:
-Buffalo River (NIST 2704) -Indiana Harbor canal (NBS 1645) Japan:
-Ibaraki stream composite (JSd-1) -Lake Biwa, Japan (JLK-1) Ontario, Canada
-Lake Ontario (WQB-1) -Lake Ontario, blend (WQB-3) -Toronto harbor -1 (TH-1) -Toronto harbor -2 (TH-2) -Humber River (HR-1) -Sudbury (SUD-1) -Hamilton harbor (EC-1) -Niagara River (EC-3) -Lake St. Clair (EC-7)
5.5±0.5 nmol g-1 (n≥4) 6.3±0.4 1.7±0.2 7.4±0.7 4.5±0.4 4.9±0.2 3.0±0.3 3.4±0.8 2.3±0.4 2.4±0.1 12.6±1.4 5.2±0.4 3.1±0.6
(Cheam et al. 1998) Cold dissolution / LEAFS (total Tl)
Pore waters Great lakes and other sampling sites 0.5-1043 pmol L-1 (432) (Cheam 2001) LEAFS (dissolved Tl)
Lake Vose 5.5±0.4 pmol L-1 (3) (Laforte et al. 2005) ICP-MS (dissolved Tl)
Overlying
water Lake TantaréLake Vose 38 ± 0.3 pmol L
-1 (3)
19 ± 4 pmol L-1 (3) (Laforte et al. 2005) ICP-MS (dissolved Tl)
Water Lake Superior Lake Erie Lake Ontario Hamilton Harbour Lake Erie Lake Ontario Hamilton Harbour 4.4-6.8 pmol L-1 (26) 0.03-0.06 nmol L-1 (18) 0.02-0.04 nmol L-1 (47) 0.11-0.18 nmol L-1 (8) 0.03-0.07 nmol L-1 (18) 0.025-0.043 nmol L-1 (18) 0.12-0.24 nmol L-1 (8)
(Cheam et al. 1995) LEAFS (dissolved Tl)
LEAFS (total Tl)
Lake Ontario 0.024-0.034 nmol L-1 (18)
0.026-0.040 nmol L-1 (18) (Cheam et al. 1996) LEAFS (dissolved Tl)LEAFS (total Tl)
Lake Erie Lake Michigan Lake Huron Lake Michigan Lake Huron 0.014-0.053 nmol L-1 (24) 0.04-0.09 nmol L-1 (22) 0.013-0.088 nmol L-1 (19) 0.047-0.094 nmol L-1 (22) 0.015-0.090 nmol L-1 (19)
(Lin & Nriagu 1999b) Graphite furnace atomic absorption spectrometer (GFAAS) (dissolved Tl) GFAAS (total Tl)
Lake Superior 0.007±0.001 nmol L-1 (1) (Field & Sherrell 2003) Desolvating micronebulization
and HR-ICP-MS Western Canadian coal mine waters
Western Canadian generating station (GS) waters
Eastern Canadian coal mine waters Eastern and central Ontario GS waters
0.001-6.5 nmol L-1 (97)
0.05-740 pmol L-1 (80)
0.0007-3.5 nmol L-1 (26) 0.002-116 nmol L-1 (43)
(Cheam et al. 2000) LEAFS
Miscellaneous sites across Canada 0-21.5 nmol L-1 (253) (Cheam 2001) LEAFS
Lake Övre Skärsjön (Sweden) Lake Stensjön Lake Tväringen Lake Remmarsjön 36-44 pmol L-1 (3) 22-39 pmol L-1 (6) 24-31 pmol L-1 (3) 32-39 pmol L-1 (3)
(Grahn et al. 2006a; Grahn et al. 2006b)
ICP-MS
Lake Listresjön 59 pmol L-1 (1) (Karlsson et al. 2006b) ICP-MS
Surface water from Taiwan 117±1 pmol L-1 (1) (Meeravali & Jiang 2008) Sequential mixed-micelle cloud
point extraction with ICP-MS China, Guizhou province
Lanmuchang area
Deep groundwater
Shallow groundwater 0.064-5.382 µmol L
-1 (5)
0.024-3.67 pmol L-1 (15)
Well water
Background groundwater Stream water (base regime) Stream water (flood regime)
Yanshang area Groundwater 0.049-1.859 pmol L-1 (5) <0.0024 pmol L-1 (2) 0.4-151.7 nmol L-1 (12) 0.3-22.0 nmol L-1 (12) 0.03-0.47 pmol L-1 (7) France, rivers influenced by acid mine
drainage: -Reigous Creek
-Arnous River (upstream) -Arnous River (downstream) -Reigous Creek
-Arnous River (upstream) -Arnous River (downstream) -Gardon River 20-235 nmol L-1 (46) 0.05-0.78 nmol L-1 (18) 1-10 nmol L-1 (45) 0.0001-2.6 µmol L-1 (203) 0.05-0.83 nmol L-1 (23) 0.2-26.6 nmol L-1 (113) 0.15-0.63 nmol L-1 (9) (Casiot et al. 2009) (Casiot et al. 2011) ICP-MS ICP-MS
Snow and ice Canadian Arctic (Agassiz ice cap) -fresh snow
-surface samples -subsurface samples * Snow and ice
0.0015-0.0044 pmol g-1 0.0015-0.0055 pmol g-1 0.0001-0.0045 pmol g-1 * up to 0.04 pmol g-1 (Cheam et al. 1998) * Unpublished data reported in Cheam (2001) LEAFS (total Tl)
Canadian Arctic (Ellesmere Island) 0.0064-0.0108 pmol g-1 (6) (Sturgeon et al. 1993) ETV-ICPMS
Antarctica (Terra Nova) 0.0009-0.0022 pmol g-1
(sample contamination)
(Baiocchi et al. 1994) Seawater Pacific
Atlantic
58-77 pmol kg-1 (18)
59-80 pmol kg-1 (6) (Flegal & Patterson 1985) Thermal ionization isotope-dilution mass spectrometry
(dithizone-chloroform extraction) (total Tl)
Ross Sea (Antartica) 22-25 pmol L-1 (Turetta et al. 2010) HR-ICP-MS
Air (suspended particulate matter) City center -1998 -1999 -2000 Residential sector -1998 -1999 -2000 0-0.09 nmol m-3 (156) 0-0.01 nmol m-3 (192) 0-0.01 nmol m-3 (185) 0-0.02 nmol m-3 (194) 0-0.03 nmol m-3 (327) 0-0.04 nmol m-3 (363)
(Hrsak et al. 2003) Flame atomic absorption spectrometry
Bulk deposition -Erzgebirge
-Kola 0.049-0.587 pmol m
-3 (16)
<0.0001 µmol m-3 (16)
(Matschullat et al. 2000) Particle-induced X-ray emission analysis + atomic absorption spectrometry
Soils Poland: -top soil
-deep soil 0.2-145.8 µmol kg
-1 (59)
0.1-171.7 µmol kg-1 (59)
(Lis et al. 2003) Differential-pulse adsorptive stripping voltammetry technique China, Guizhou province:
Lanmuchang area -Mine area
-Natural slope wash materials -Alluvial deposited soil -Undisturbed natural soil -Background area Yanshang area -Natural soils 0.2-0.6 mmol kg-1 (10) 0.11-0.14 mmol kg-1 (2) 0.07-0.30 mmol kg-1 (12) 7-34 µmol kg-1 (5) <0.98-2.45 µmol kg-1 (3) 4.4-6.8 µmol kg-1 (6)
(Xiao et al. 2004) ICP-MS
Ores / Rock China, Guizhou province: Bedrock in background area Lanmuchang area
-Sulfide ores -Coals
-Secondary minerals -Mine wastes -Altered host rocks -Outcropping rocks Yanshang area -Gold ores -Coals 0.29-0.98 µmol kg-1 (3) 0.5-171.2 mmol kg-1 (9) 0.06-0.22 mmol kg-1 (2) 0.12-5.38 mmol kg-1 (3) 0.16-12.72 mmol kg-1 (3) 0.19-2.40 mmol kg-1 (6) 0.03-1.62 mmol kg-1 (6) 1-78 µmol kg-1 (7) 1.5-41.1 µmol kg-1 (4)
Table 2. Formation constants of Tl(III) with hydroxide and chloride ions.
Species
Log β NIST (2004)
Log β Lin and Nriagu
(1998b, a) TlOH2+ 13.4 11.31 Tl(OH)2+ 26.6 18.95 Tl(OH)3 38.7 25.53 Tl(OH)4- 41.0 30.75 TlCl2+ 7.72 8.14 TlCl2+ 13.48 13.60 TlCl3 16.48 15.78 TlCl4- 18.29 18.00
Table 3. Thallium (I) concentrations reported in aquatic plants.
Group Sub-group Taxon [Tl] organism nmol g-1 dw [Tl] water nmol L-1 lab or field Medium; Exposure time (d) Reference
Bacillariophyta Thalassiosirales Stephanodiscus,
Hantzschii 7.4 2.75 freshwater; lab 3 (Twiss et al. 2004)
Chlorophyta Chlorellales Chlorella sp. 280 2.75 freshwater; lab 3 (Twiss et al. 2004) " Chlorellales Chlorella kessleri 203,000 1000 freshwater; lab - (Stary et al. 1983)
" Chlorococcales Scenedesmus
obliquus 203,000 1000 freshwater; lab - (Stary et al. 1983)
" phytoplankton - 0.02-0.8 0.06-0.082 marine; field - (Flegal et al. 1986)
" phytoplankton - 47-213 2.5–433 freshwater; field - (Zitko et al. 1975) Bryophyta mosses - 613-794 2.5–433 freshwater; field - (Zitko et al. 1975) Angiosperm Araceae Lemna minor 1370 200 freshwater; lab 12.5 (Kwan & Smith 1991)
" " " 880-4426 10-750 freshwater; lab 10 (Kwan & Smith 1988) " " " 128-1087 0.2-2.0 freshwater; lab 7 (Babić et al. 2009)
1 The following dry weights were used for unit conversions: 5.1 µg/106 cells Chlorella sp.; 12 µg/106 cells Chlorella kessleri; 18 µg/106 cells
Scenedesmus; 155 µg/106 cells Stephanodiscus (Swale 1963; Nalewajko 1966).
Table 4. Thallium concentrations reported in aquatic animals and in the water or sediment to which they have been exposed in either the laboratory or in the field. Values of [Tl] animal are for whole animals, except for some fish where values are for muscle (superscript a), liver (superscript b), kidneys (superscript c) or gills (superscript d) only. Where fish concentrations are given in wet weights (superscript e) they have been converted to dry weights by assuming a ratio of 5:1, respectively (CRESP 2006).
Group Sub-group Taxon [Tl] animal
nmolg-1 dw [Tl] waternmolL-1 [Tl] sedimentnmolg-1 dw lab or fieldMilieu; Exposuretime (d) Reference
Annelida Tubificidae Tubifex tubifex 1.5 - 5 freshwater; lab 14 (Dumas & Hare 2008)
Crustacea zooplankton - 0.15-2.5 - - marine; field - (Flegal et al. 1986) " Amphipoda Hyalella azteca 0.8-4.9 - 0.5-4.2 freshwater; lab 7 (Borgmann et al. 1998)
" " " 0.1-0.4 0.01-0.03 - freshwater; field transplant
17 (Couillard et al. 2008) Insecta Diptera Chironomus riparius 3 - 5 freshwater; lab 14 (Dumas & Hare 2008)
" " Chironomus species 0.04-4.7 freshwater; field Proulx & Hare, unpubl
Molluska Bivalvia Dreissena polymorpha 1.2 - - freshwater; field - (Waidmann et al. 1990)
" " Mya arenaria 20-40 250-500 - marine; lab 19 (Zitko & Carson 1975)
" " Mytilus edulis 22-31 250-500 - marine; lab 12 (Zitko & Carson 1975)
Pisces - - 376-470a - - freshwater; field - (Palermo et al. 1983)
" - - 39b - - freshwater; field - (LIS 1980)
" - - 31c - - freshwater; field - (LIS 1980)
" planktonic - 0.6 - - marine; field - (Flegal et al. 1986) " Cyprinidae Pimephales promelas
(larvae)
4 0.44 - freshwater; lab 21 (Lapointe & Couture 2010)
" " Pimephales promelas
(larvae)
30 4.5 - freshwater; lab 21 (Lapointe & Couture 2010)
" " Pimephales promelas
(juveniles)
0.1 0.5 - freshwater; lab 8 (Lapointe & Couture 2009) " " Semotilus atromaculatus (females) 0.04 - - freshwater; artificial stream 35 (Dube et al. 2006) " " Semotilus margarita 0.1 - - freshwater;
artificial stream
35 (Dube et al. 2006) " Esocidae Esox lucius (age 1+) 0.15-0.8a - - freshwater; field - (Kelly & Janz 2009)
" Salmonidae Salvelinus alpinus 0.07-0.61ae - - freshwater; field - (Gantner et al. 2009)
" " Salvelinus namaycush 0.2-12e - - freshwater; field - (Lin et al. 2001)
" " Salmo salar 57a 90 - freshwater; lab 12+ (Zitko et al. 1975)
" " Salmo salar 57-660a 87-979 - freshwater; lab 12+ (Zitko et al. 1975)
Table 5. Toxicity of Tl(I) to aquatic bacteria, fungi, and primary producers.
Group Sub group Taxon Endpoint
Aqueous [Tl]
(μmol L-1) Reference
Bacteria Gammaproteobacteria Pseudomonas aeruginosa MIC 470 (Kunze 1972; cited in Wilson & Dean 1977)
" Bacilli Bacillus subtilis MIC 940 (Kunze 1972; cited in Wilson & Dean 1977)
" Bacilli Bacillus megaterium EC50 (24 h) Growth 15 (Norris et al. 1976)
" Betaproteobacteria Thiobacillus ferrooxidans Growth inhibition (K+ free medium) 100 (Tuovinen & Kelly 1974)
" Gammaproteobacteria Vibrio fisheri (marine) EC50 (22 h) Growth 30.6 (Hsieh et al. 2004)
Fungi Ascomycota Saccharomyees cerevisiae EC50 (24 h) Growth 750 (Norris et al. 1976)
Cyanobacteria Chroococcales Anacystis nidulans
EC50 EC100 Growth (22 d)
~25
~50 (Lustigman et al. 2000)
" Chroococcales Anacystis nidulans Reduced growth Growth inhibition 24.534.3 (Di Gaudio & Hirshfield 1975)
Bacillariophyta Lithodesmidales Ditylum brightwellii (marine) EC50 (5 d) EC50 (5 d) 0.76-0.83* 1.6-1.7 (Canterford & Canterford 1980)
Chlorophyta Chlorellales Chlorella sp.
EC20 (without K+) EC20 (20 μmol L-1 K+) EC50 (without K+) EC50 (20 μmol L-1 K+) Growth (72h) 0.01 0.4 0.01 0.8 (Hassler et al. 2007)
" Chlorellales Chlorella vulgaris
Highest [ ] tolerated Lowest inhibitory [ ] 3-4 months
0.1
0.2 (den Dooren de Jong 1965)
" Volvocales Chlamydomonas reinhardtii
EC50 EC100 Chl a (22 d)
~1
~3 (Lustigman et al. 2000)
" Volvocales Chlamydomonas reinhardtii EC50 Light-induced O
2 evolution ~15 (Overnell 1975b)
" Sphaeropleales Pseudokirchneriella
subcapitata
EC25 (72 h)
Growth 0.44 (Pickard et al. 2001)
" Chlamydomonadales Dunaliella tertiolecta (marine) EC50 Light-induced O
Heterokontophyta Naviculales Phaeodactylum tricornutum (marine) EC20 Light-induced O
2 evolution ~150 (Overnell 1975a)
Rhodophyta Cyanidiales Cyanidium caldarium EC50(20 d) Growth ≈ 422 (Albertano & Pinto 1986)
" " Cyanidioschyzon merolae EC50 (20 d) Growth ≈ 1585 (Albertano & Pinto 1986)
" " Galdieria sulphuraria EC50 (20 d) Growth ≈ 1445 (Albertano & Pinto 1986)
Angiosperm Hydrocharitaceae Elodea canadensis
EC50 (24 h) EC90 (24 h)
Light-induced O2 evolution
7.0
13.5 (Brown & Rattigan 1979)
" Araceae Lemna minor EC50 (14 d) Growth inhibition 0.79 (Babić et al. 2009)
" " Lemna minor EC50 (10 d) Frond area Fresh weight Frond number 0.16 0.20 0.23
(Kwan & Smith 1988)
" " Lemna minor EC50 (10 d) Frond number 0.2 (Smith & Kwan 1989)
" " Lemna minor EC10 (7 d) EC20 (7 d) EC50 (7 d) Growth 0.54-0.74 0.74-0.98 1.23-1.96 (Naumann et al. 2007) " " Lemna minor EC20 (24 h) EC50 (24 h) Frond abscission 2.17 4.29 (Henke et al. 2011)
" " Lemna minor EC50 (14 d) Visual rating 0.04 (Brown & Rattigan 1979)
MIC: Minimal inhibitory concentration. *Based on calculated free metal concentration.