HAL Id: hal-00984319
https://hal.archives-ouvertes.fr/hal-00984319
Submitted on 27 May 2020
HAL is a multi-disciplinary open access
archive for the deposit and dissemination of
sci-entific research documents, whether they are
pub-lished or not. The documents may come from
teaching and research institutions in France or
abroad, or from public or private research centers.
L’archive ouverte pluridisciplinaire HAL, est
destinée au dépôt et à la diffusion de documents
scientifiques de niveau recherche, publiés ou non,
émanant des établissements d’enseignement et de
recherche français ou étrangers, des laboratoires
publics ou privés.
Distributed under a Creative Commons Attribution - NonCommercial - ShareAlike| 4.0
The availability of filament ends modulates actin
stochastic dynamics in live plant cells.
Jiejie Li, Benjamin H Staiger, Jessica L Henty-Ridilla, Mohamad Abu-Abied,
Einat Sadot, Laurent Blanchoin, Christopher J Staiger
To cite this version:
Jiejie Li, Benjamin H Staiger, Jessica L Henty-Ridilla, Mohamad Abu-Abied, Einat Sadot, et al.. The
availability of filament ends modulates actin stochastic dynamics in live plant cells.. Molecular Biology
of the Cell, American Society for Cell Biology, 2014, 25 (8), pp.1263-75. �10.1091/mbc.E13-07-0378�.
�hal-00984319�
MBoC |
ARTICLE
The availability of filament ends modulates actin
stochastic dynamics in live plant cells
Jiejie Lia, Benjamin H. Staigera, Jessica L. Henty-Ridillaa, Mohamad Abu-Abiedb, Einat Sadotb, Laurent Blanchoinc, and Christopher J. Staigera,d
aDepartment of Biological Sciences, Purdue University, West Lafayette, IN 47907-2064; bInstitute of Plant Sciences,
Volcani Center, Bet-Dagan 50250, Israel; cInstitut de Recherches en Technologie et Sciences pour le Vivant,
Labora-toire de Physiologie Cellulaire et Végétale, Comissariat a l’Energie Atomique/Centre National de la Recherche Scientifique/Institute de la Recherche Agronomique/Université Joseph Fourier, F38054 Grenoble, France; dBindley
Bioscience Center, Purdue University, West Lafayette, IN 47907
ABSTRACT A network of individual filaments that undergoes incessant remodeling through a process known as stochastic dynamics comprises the cortical actin cytoskeleton in plant epidermal cells. From images at high spatial and temporal resolution, it has been inferred that the regulation of filament barbed ends plays a central role in choreographing actin orga-nization and turnover. How this occurs at a molecular level, whether different populations of ends exist in the array, and how individual filament behavior correlates with the overall archi-tecture of the array are unknown. Here we develop an experimental system to modulate the levels of heterodimeric capping protein (CP) and examine the consequences for actin dynam-ics, architecture, and cell expansion. Significantly, we find that all phenotypes are the oppo-site for CP-overexpression (OX) cells compared with a previously characterized cp-knockdown line. Specifically, CP OX lines have fewer filament–filament annealing events, as well as re-duced filament lengths and lifetimes. Further, cp-knockdown and OX lines demonstrate the existence of a subpopulation of filament ends sensitive to CP concentration. Finally, CP levels correlate with the biological process of axial cell expansion; for example, epidermal cells from hypocotyls with reduced CP are longer than wild-type cells, whereas CP OX lines have short-er cells. On the basis of these and othshort-er genetic studies in this model system, we hypothesize that filament length and lifetime positively correlate with the extent of axial cell expansion in dark-grown hypocotyls.
INTRODUCTION
The rapid turnover of actin filaments and remodeling of actin arrays are precisely regulated in eukaryotic cells. However, the molecular mechanisms underlying the construction of specific actin arrays in vivo remain under active investigation. Illuminating actin organiza-tion with molecular precision requires fast and high-resoluorganiza-tion imag-ing systems. Variable-angle epifluorescence microscopy (VAEM)
permits imaging at excellent signal to noise ratio of the cortical cy-toplasm (Konopka and Bednarek, 2008) and has been used to gen-erate analyses at high spatial and temporal resolution of individual actin filaments in living plant cells (Staiger et al., 2009). Epidermal cells from Arabidopsis thaliana seedlings expressing the green fluo-rescent protein (GFP)–fABD2 reporter provide a facile model system to explore the mechanism of cytoskeletal turnover. In the dark-grown hypocotyl, which expands predominantly by cell elongation (Gendreau et al., 1997), extent of bundling and abundance of actin filaments in the cortical array correlate with a gradient of axial cell expansion (Henty et al., 2011; Li et al., 2012). Specifically, cortical actin arrays exhibit decreased actin filament abundance and en-hanced extent of bundling as one moves from fast-elongating cells at the apex of the hypocotyl toward the root, where cell expansion has ceased (Henty et al., 2011; Li et al., 2012). It is believed that actin arrays coordinate vesicle and organelle trafficking and thereby modulate delivery of cell wall materials and cellulose synthesis
Monitoring Editor Thomas D. Pollard Yale University Received: Jul 10, 2013 Revised: Jan 31, 2014 Accepted: Feb 4, 2014
This article was published online ahead of print in MBoC in Press (http://www .molbiolcell.org/cgi/doi/10.1091/mbc.E13-07-0378) on February 12, 2014. Address correspondence to: Christopher J. Staiger ([email protected]).
© 2014 Li et al. This article is distributed by The American Society for Cell Biology under license from the author(s). Two months after publication it is available to the public under an Attribution–Noncommercial–Share Alike 3.0 Unported Cre-ative Commons License (http://creCre-ativecommons.org/licenses/by-nc-sa/3.0). “ASCB®,” “The American Society for Cell Biology®,” and “Molecular Biology of
the Cell®” are registered trademarks of The American Society of Cell Biology.
Abbreviations used: CP, capping protein; GFP, green fluorescence protein; MS, Murashige and Skoog; OX, overexpression; VAEM, variable angle epifluores-cence microscopy.
(PPIs) in vitro (Schafer et al., 1996; Kim et al., 2007; Kuhn and Pollard, 2007). Beside PPIs, CP from Arabidopsis also binds to the signaling lipid phosphatidic acid (PA; Huang et al., 2006; Pleskot et al., 2012, 2013). It was suggested that the interaction between CP and PA occurs in vivo and leads to filament uncapping (Li et al., 2012; Pleskot et al., 2013). Genetic evidence shows that loss-of-function or null mutants for CP cause defects in the generation of specific actin-based structures in various organisms. In budding yeast, for example, actin cables and patch formation are perturbed (Amatruda et al., 1990, 1992; Kim et al., 2004), whereas in crawling cells the distribution between lamellipodial and filopodial actin at the leading edge is altered (Hug et al., 1995; Rogers et al., 2003; Mejillano et al., 2004). It has been speculated that these defects are due to enhanced actin assembly on free barbed ends (Hug et al., 1995; Hopmann et al., 1996; Hopmann and Miller, 2003; Kim et al., 2004; Kovar et al., 2005). However, increasing CP level does not necessarily have the opposite effect on actin organization and de-velopmental phenotype. The exception is budding yeast, in which overexpression of CP slightly inhibits actin polymerization from barbed ends and leads to loss of actin cables and abnormal cell morphogenesis (Amatruda et al., 1992; Kim et al., 2004). In fission yeast, mild CP overexpression specifically affects contractile ring as-sembly during cytokinesis; however, the actin patches and cables appear normal, whereas these structures are perturbed in a cp-knockout mutant (Kovar et al., 2005). Finally, the number of free barbed ends decreases in Dictyostelium cells with enhanced CP ex-pression, but the amount of filamentous actin and cell growth are similar to those in wild-type cells (Hug et al., 1995). These data sug-gest that precise control of the availability of barbed ends by CP is essential to build diverse actin networks during various biological processes. However, the extent to which this mechanism is driven by interaction between CP and barbed ends differs between cell types and organisms.
In this study, we combine advanced live-cell imaging with quan-titative image analyses to characterize the changes in dynamic be-havior of filament ends caused by altering CP levels in Arabidopsis epidermal cells. Our data provide a broader and deeper under-standing of how barbed-end regulation contributes to actin filament turnover and actin array dynamics. Significantly, enhancing and in-hibiting actin dynamic turnover has opposite effects on axial cell expansion in plants.
RESULTS
Organ and cell expansions are influenced by CP levels We showed previously that reducing CP levels resulted in excess elongation of hypocotyls and epidermal cells (Li et al., 2012). Here we hypothesize that overexpressing CP will cause the opposite ef-fect on organ growth and axial cell expansion. To test this predic-tion, we generated plants with enhanced CP expression levels by stable integration of both CPA and CPB under the control of the CaMV-35S promoter. A homozygous knockdown mutant, cpb-1, characterized in a previous study (Li et al., 2012) was used as a con-trol for phenotypic analyses. In 20 CP-overexpression (OX) lines ex-amined, the transcript levels for CPA and CPB were considerably increased (unpublished data). Thus we selected three independent lines (CP OX1–3) with increased transcript levels for further experi-ments (Figure 1A). In the cpb-1 mutant, CP transcript levels for both subunits were decreased approximately twofold compared with wild-type seedlings, which was consistent with previous results (Figure 1A; Li et al., 2012). To further verify these results, we deter-mined CP protein levels by semiquantitative immunoblotting. As shown in Figure 1C, protein levels for both CP α- and β-subunits machinery to plasma membrane (Crowell et al., 2009; Gutierrez
et al., 2009; Szymanski and Cosgrove, 2009; Sampathkumar et al., 2013).
Previous studies demonstrated that individual actin filament turnover in Arabidopsis epidermal cells occurs through a combina-tion of rapid filament elongacombina-tion at barbed ends and filament disas-sembly through prolific severing activity (Staiger et al., 2009; Smertenko et al., 2010; Henty et al., 2011; Li et al., 2012; Tóth et al., 2012). Metrics have been developed to quantify key parameters of dynamic actin filaments, including elongation rate, severing fre-quency, filament–filament annealing, filament origin, and maximum filament length and lifetimes. The overall mechanism observed in living cells has been termed stochastic actin dynamics (Staiger et al., 2009; Henty-Ridilla et al., 2013). Actin filament turnover and genera-tion of macromolecular structures are modulated by hundreds of actin-binding proteins (Pollard et al., 2000; Pollard and Cooper, 2009). In plants, dozens of actin-binding proteins have been identi-fied and their in vitro properties characterized extensively (Hussey et al., 2006; Staiger et al., 2009; Blanchoin et al., 2010). Combining reverse-genetic approaches with quantitative image analysis of the cortical actin array provides a powerful platform to dissect the role of key actin-binding proteins in specific steps of actin turnover in vivo (Henty-Ridilla et al., 2013). For example, high-spatiotemporal-resolution imaging of plant cells provided the first direct evidence for severing of actin filaments in vivo by ADF/cofilin family members and revealed the synergistic activity between ADF and AIP1 at the level of individual actin filament dynamics (Augustine et al., 2011; Henty et al., 2011).
The creation and availability of actin filament barbed ends have been suggested to play critical roles in the control of actin assembly in vivo. The ability to visualize the dynamic behavior of individual filament ends allows us to dissect the role of barbed-end regulation genetically. In Arabidopsis epidermal cells, new growing ends origi-nate from three locations: de novo in the cytoplasm, from the side of existing filaments, or at the ends of preexisting fragments (Staiger et al., 2009; Henty et al., 2011; Li et al., 2012). After initiation, actin filaments elongate from the putative barbed end at rates of ∼2 μm/s (Staiger et al., 2009; Smertenko et al., 2010; Henty et al., 2011; Li et al., 2012; Tóth et al., 2012). The opposite end, presumably the pointed end of a growing filament, is observed to shrink only occa-sionally and at rates of ∼0.3 μm/s (Staiger et al., 2009; Henty et al., 2011). Filament extension can also be generated by filament–fila-ment annealing, which allows for bursts of actin assembly (Smertenko et al., 2010; Li et al., 2012). Filament–filament annealing occurs in-frequently—on the order of ∼2% of available filament ends in wild-type cells (Li et al., 2012). In addition, most newly created ends gen-erated by severing activity fail to regrow, with only ∼3% elongating after a break (Staiger et al., 2009; Smertenko et al., 2010; Li et al., 2012). These data suggest that the majority of the barbed ends are capped at or soon after their creation and that capping factors dis-sociate slowly (Staiger et al., 2009). Little is known, however, about the molecular mechanism(s) by which the dynamic behavior of actin filament barbed ends is regulated in plant cells.
To address these questions, we developed a system to experi-mentally modulate the behavior of actin filaments by altering the abundance of the ubiquitous barbed-end capping protein (CP) in live epidermal cells. CP is a heterodimer of structurally related α- and β-subunits (Cooper and Sept, 2008). In vitro, CP binds to fila-ment barbed ends with high affinity, preventing addition and loss of monomers, and it inhibits filament–filament annealing (Cooper and Sept, 2008; Huang et al., 2003, 2006). Moreover, its barbed end– capping activity is negatively regulated by phosphoinositide lipids
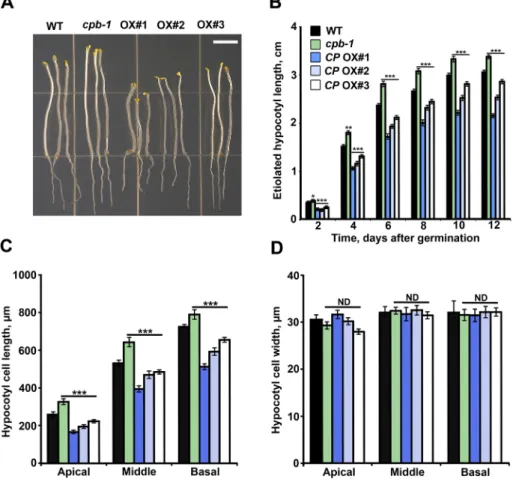
type. To examine whether the differences in hypocotyl length re-sulted from defects in cell expansion, we measured epidermal cell length and width for all genotypes. The cpb-1 mutant had signifi-cantly longer cells in all regions of dark-grown hypocotyls compared with wild-type hypocotyls (Figure 2C; Li et al., 2012). By contrast, the CP OX lines showed severe reduction in cell length (Figure 2C). However, there were no differences in cell width between wild-type, cpb-1, and CP OX lines (Figure 2D).
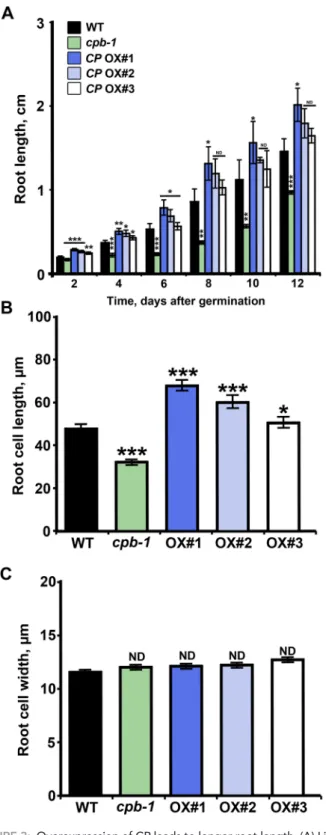
Given that reduction of CP leads to shorter roots under light-grown conditions (Li et al., 2012), we predicted that enhanced CP expression would affect root growth as well. As shown in Figure 3A, CP OX lines had significantly increased root length compared with wild type. Moreover, epidermal cells from the root elongation zone were significantly longer in CP OX lines than with wild-type cells and had the opposite phenotype to cpb-1 mutant (Figure 3B). No sig-nificant difference in cell width was observed when wild-type, cpb-1, and CP OX lines were compared (Figure 3C). Under continuous dark-growth conditions, however, root lengths from either cpb-1 mutant or CP OX lines did not have any significant difference when compared with wild type (unpublished data). One has to interpret such results from roots with a degree of caution, however, as organ length depends on both cell expansion and cell division, and the actin cytoskeleton is a target for proteasome-mediated destruction under dark-grown conditions (Dyachok et al., 2011)
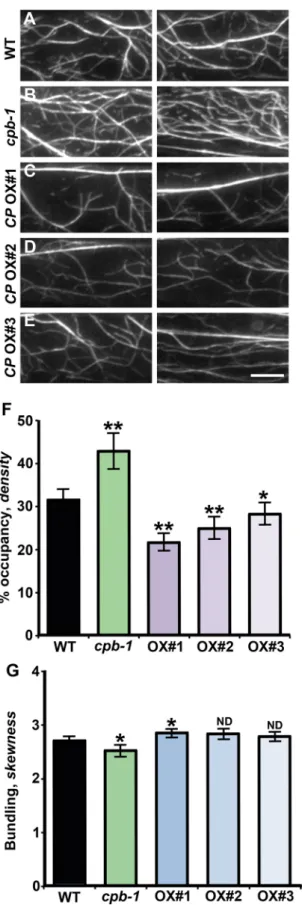
Collectively our results suggest that alteration of CP level affects organ and cell growth, specifically axial cell expansion. In addition, CP plays different roles or has varying levels of importance, depend-ing on tissue type or developmental condition of the tissue. CP levels affect cortical actin organization in epidermal cells Biochemical studies demonstrate that At CP binds to actin fila-ment barbed ends with high affinity and inhibits monomer addi-tion and loss (Huang et al., 2003, 2006). On the basis of these in vitro studies, we predict that the amount of functional CP in cells will inversely correlate with the availability of barbed ends for ac-tin assembly, which thereby modulates F-acac-tin levels. Specifically, we predict that an excess of CP will bind to all available barbed ends, regulating actin polymerization from the profilin-actin pool and thereby reducing overall filament levels (Huang et al., 2006). To test this hypothesis, we observed the organization of cortical actin arrays in hypocotyl epidermal cells from wild-type, cpb-1 mutant, and CP OX–line seedlings expressing the actin reporter gene GFP-fABD2 (Sheahan et al., 2004; Staiger et al., 2009). In cells with reduced CP levels, actin arrays appeared to be denser than in wild-type cells (Figure 4, A and B; Li et al., 2012), whereas the actin network in CP OX cells was sparser than in wild-type cells (Figure 4, C–E).
To compare these differences quantitatively, we measured the organization of actin arrays in epidermal cells with a set of tools de-scribed previously (Higaki et al., 2010; Khurana et al., 2010; Henty et al., 2011; Li et al., 2012). Two parameters, skewness and density, were applied to measure the extent of filament bundling and the percentage occupancy of actin filaments, respectively. As shown in Figure 4, F and G, and in a previous study (Li et al., 2012), the per-centage occupancy of actin filaments, or density of the actin array, in cpb-1 mutant cells was significantly increased compared with wild-type cells; however, the actin arrays were moderately less bundled. In contrast, the abundance of actin filaments was reduced by 5–10% in CP OX cells relative to wild-type cells. The extent of bundling in CP OX1 cells was also slightly elevated; however, no significant dif-ferences in skewness values were detected between the other two CP OX lines and wild-type cells (Figure 4G).
were increased up to fivefold in the CP OX lines. Moreover, the ob-servation that individual lines had increasing amounts of transcript, with OX1 > OX2 > OX3, also held true at the protein level. In con-trast, the cpb-1–knockdown line had ∼20% of the CP α-subunit and ∼50% of the β-subunit compared with wild type.
When grown under continuous dark conditions, cpb-1 mutant seedlings exhibited longer hypocotyls than wild-type seedlings (Figure 2A; Li et al., 2012). By contrast, all three CP OX lines showed strongly reduced hypocotyl lengths compared with wild-type and cpb-1 mutant seedlings (Figure 2A). The differences between geno-types were significant throughout the developmental time period (Figure 2B). Of note, the extent of phenotypic defects in hypocotyl elongation correlated with CP level; specifically, the more transcript and protein present, the stronger was the growth-inhibition
pheno-FiguRE 1: Transcript and protein levels for CPα and CPβ subunits are altered in cpb-1 mutant and CP-overexpression lines. (A) qRT-PCR analysis of CPA and CPB transcript levels in 10-d-old, dark-grown seedlings from homozygous cpb-1 mutant seedlings and three independent CP-overexpression lines (CP OX1–3). Col-0 wild-type (WT) seedlings were used as a control. (B) Western blot analysis of CP protein levels in WT, cpb-1 mutant, and CP OX1–3 lines using anti-CPA and -CPB antibodies (Huang et al., 2003). CP levels were considerably enhanced in three overexpression lines, whereas the cpb-1 mutant had less CP protein expression than did WT. Blots are from one representative experiment. Recombinant CP (rCP) was included as a positive control and anti-PEPC antibody used as a loading control. (C) Protein levels in each genotype were measured quantitatively by densitometric analysis and plotted as fold induction compared with wild-type samples. Values are means ± SE from five biological replicates.
Cortical actin array dynamics is altered by changes in CP levels
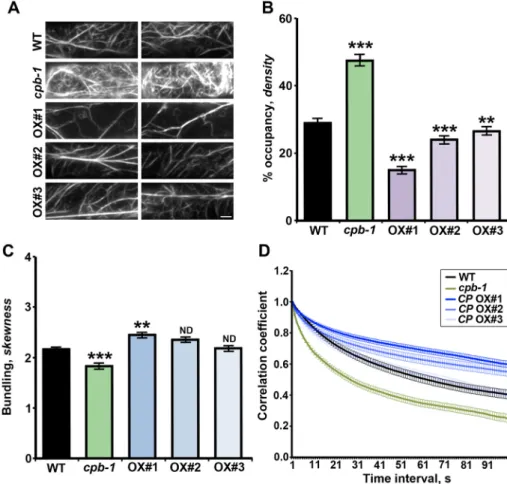
The cortical actin array in Arabidopsis hypo-cotyl epidermal cells undergoes incessant rearrangement and remodeling, with fila-ment turnover occurring on time scales of tens of seconds (Figure 6A; Staiger et al., 2009; Henty-Ridilla et al., 2013). To investi-gate whether CP contributes to the overall dynamic behavior of actin networks, we monitored changes in actin arrays by time-lapse imaging of live epidermal cells in cpb-1 mutant and CP OX lines. When compared with wild-type cells, the actin arrays in cpb-1 mutant cells appeared more dynamic (Figure 6B), whereas the remodeling of actin filaments appeared less active in CP OX– line cells (Figure 6C). To quantify these changes in actin organization, we used a correlation coefficient analysis (Vidali et al., 2010). This algorithm calculates the correla-tion coefficient for the intensity of each pixel at all possible temporal intervals. The extent of actin rearrangements over time was re-flected by decay in the correlation coeffi-cient as the temporal interval increased (Figure 6, D–G). The cpb-1 mutant cells had a significantly faster decay than wild-type cells (Figure 6D), suggesting that the actin array rearrangements were more active due to reduction of CP. However, CP OX–line cells showed a slower decay in correlation coefficient values (Figure 6, E–G), which in-dicates that enhanced CP expression leads to decreased actin array dynamics. To con-firm these results in another tissue, we ap-plied the correlation coefficient analysis to time-lapse images of the cortical actin arrays in epidermal cells from the root elongation zone. The results were consistent with those in hypocotyl epidermal cells, with CP OX lines exhibiting less dynamic rearrange-ments and cpb-1 having more dynamic ar-rays than wild-type root epidermal cells (Figure 5D). Collectively these data suggest that CP is involved in regulation of overall actin array dynamics.
The dynamic behavior of filament ends and actin filament turnover is affected by changes in CP levels
The dynamic properties of actin filament ends are precisely regu-lated in Arabidopsis epidermal cells (Henty-Ridilla et al., 2013; Pleskot et al., 2013). Previous observations suggest that a majority of the filament barbed ends are capped (Staiger et al., 2009; Li et al., 2012). However, uncapped barbed ends are available for fast elon-gation from a large pool of profilin–actin monomers, and some (∼2%) ends can join together to elongate structures via filament– filament annealing (Staiger et al., 2009; Smertenko et al., 2010; Li et al., 2012). Creating more uncapped ends in cells by reducing CP levels or inhibiting its activity leads to increased dynamic activities at filament ends, with significantly enhanced filament–filament anneal-ing and an increased population of actin filaments originatanneal-ing from preexisting ends (Li et al., 2012). Given that CP prevents barbed-end In previous work, we demonstrated that reduced CP levels, or CP
activity, led to altered organization of actin arrays in epidermal cells from the root elongation zone of light-grown seedlings (Li et al., 2012; Pleskot et al., 2013). To test whether overexpressing CP causes the opposite effect on actin organization in this organ, we quantified the changes in cortical actin architecture for all genotypes (Figure 5). Cells with enhanced CP levels showed significant decreases in actin filament abundance compared with wild-type cells (Figure 5, A and B). In cpb-1 cells, the actin arrays were denser and less bundled, which is consistent with previous results (Figure 5, A–C; Li et al., 2012). Moreover, the extent of actin filament bundling was modestly increased in CP OX1 cells (Figure 5C). Actin arrays in the other two CP OX lines showed no measurable differences in actin filament bundling compared with wild-type roots (Figure 5C). These results demonstrate that CP levels affect the density of actin filament arrays in plant epidermal cells. Reduced CP levels result in increased den-sity of cortical actin arrays, whereas enhanced CP levels significantly decrease actin filament abundance.
FiguRE 2: The extent of epidermal cell elongation correlates with CP levels in dark-grown hypocotyls. (A) Representative images of dark-grown hypocotyls from 5-d-old WT, cpb-1, and CP OX1–3. The hypocotyl–root junction from each seedling was aligned along a straight line for clarity. Bar, 0.5 cm. (B) Hypocotyl lengths were strongly reduced in CP-overexpression lines, whereas the cpb-1 mutant had significantly longer hypocotyls than did WT (*p < 0.05; **p < 0.01; ***p < 0.001; t test). More than 50 seedlings/genotype were measured between 2 and 12 d after germination. Values are means ± SE. (C) Epidermal cell lengths were significantly shorter in CP OX1–3 than in WT cells. By contrast, cell lengths were significantly increased in cpb-1 mutant, as shown previously (Li et al., 2012). Measurements were performed on 5-d-old, dark-grown hypocotyls, and cells in the apical, middle, and basal one-third of the hypocotyl were binned into groups. Values represent means ± SE (n > 300 cells/genotype; ***p < 0.001; t test). (D) Measurements of cell width were performed on epidermal cells from 5-d-old, dark-grown hypocotyls, as described for C. No significant differences (ND) were observed among genotypes (t test).
elongation of actin filaments and filament–filament annealing by blocking ends in vitro, we predict that increased CP levels could alter the properties of filament ends in cells. To address this, we monitored the dynamic behavior of filament ends by VAEM and quantified these behaviors in wild-type and CP OX line cells. The cpb-1–knockdown mutant was used as a control (Li et al., 2012).
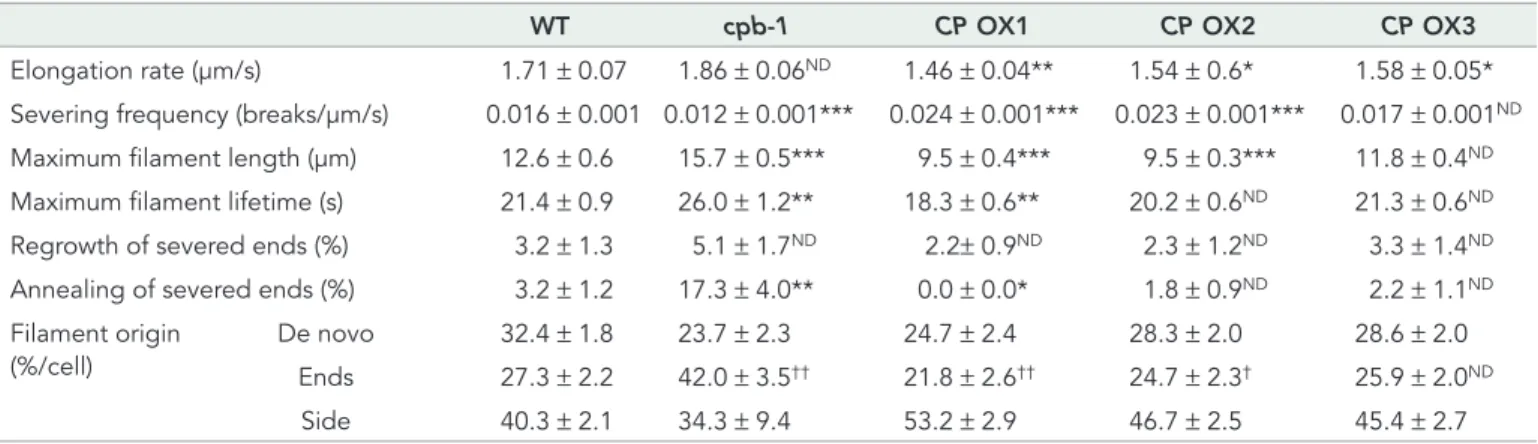
As shown in Table 1, CP overexpression prevents annealing of severed ends, with filament–filament annealing reduced to as little as 0% in CP OX1 when compared with wild-type cells (3.2%). In contrast, the frequency of filament–filament annealing in cpb-1 cells increased more than fivefold compared with wild-type cells (Table 1). Further, the proportion of elongating filaments originating from dif-ferent locations was altered by increasing CP levels, with a signifi-cant reduction in the filament population initiating from ends (21.8% in CP OX1 cells, 27.3% in wild-type cells; Table 1). By contrast, more filaments originated from the side of existing filaments or bundles in CP-overexpressing cells (∼50%) compared with wild-type cells (40%; Table 1). In cpb-1 cells, the percentage of filaments originating from ends was significantly increased by almost twofold compared with wild-type cells (Table 1) and is consistent with the previous study (Li et al., 2012). Of note, there were still no significant differences in the frequency of filament regrowth from newly severed ends between any of the genotypes (Table 1; Li et al., 2012).
In addition, CP OX cells had an effect on actin filament turnover. The filament lengths in CP OX lines decreased by as much as ∼25% compared with wild type, whereas when the level of CP was re-duced, filaments attained considerably longer maximum lengths, as shown previously (Li et al., 2012). In addition, overexpressing CP leads to a significant reduction in filament lifetimes, as well as en-hanced severing frequency, when compared with wild-type cells (Figure 7, A and C, Table 1, and Supplemental Videos S1 and S3). Reduced CP levels caused the opposite defects in these parameters when compared with overexpression lines, as shown previously (Table 1, Figure 7B, and Supplemental Video S2; Li et al., 2012). These data confirm that CP is involved in the regulation of actin as-sembly by precise control of the availability of dynamic filament ends through overlapping mechanisms: CP inhibits annealing of severed fragments and terminates growth at a subset of the elon-gating barbed ends. Altering CP levels did not affect the regrowth frequency of newly severed ends, suggesting that CP is not required for this process.
Alteration of CP levels influences the proportion of filament ends with different elongation rates
In wild-type Arabidopsis epidermal cells, overall filament elongation rates averaged ∼1.7 μm/s (Figures 7A and 8A). Changes in CP levels impaired this mean elongation rate (Table 1). In cpb-1 mutant cells, the average actin filament elongation rate was moderately faster, as shown previously (Figure 8A; Li et al., 2012). Overexpressing CP, however, shifted the population to slower rates (Figure 8A), with a significantly reduced average elongation rate of 1.46 μm/s in CP OX1 (Figure 8A and Table 1). In budding yeast, detailed analyses of the distribution of distinct populations of actin cables reveal differ-ent molecular mechanisms by which barbed-end elongation is coor-dinated (Chesarone-Cataldo et al., 2011; Yu et al., 2011). Specifi-cally, actin cables with slow extension rates (<2 μm/s) are associated with different formins, whereas elongation rates >2 μm/s are due to filament translocations driven by the type V myosin, Myo2p (Chesarone-Cataldo et al., 2011; Yu et al., 2011).
We hypothesize that different populations of growing filament ends also exist in plant cells. To address this, we categorized the barbed-end elongation rates into three velocity populations and
FiguRE 3: Overexpression of CP leads to longer root length. (A) Light-grown roots from the cpb-1 mutant were significantly shorter than WT roots, as shown previously (Li et al., 2012). By contrast, the root lengths in CP OX1 seedlings were significantly increased. Values are means ± SE from at least 50 seedlings/genotype measured 2–12 d after germination (*p < 0.05; **p <0.01; ***p < 0.001; ND, no significant difference; t test). (B, C) Epidermal cells from the root elongation zone were significantly longer in CP OX1–3 seedlings, whereas cell lengths in cpb-1 mutant were significantly reduced, when compared with WT (B). However, epidermal cell widths were not perturbed by altering CP levels in cells (C). Measurements were performed on 7-d-old, light-grown roots. Values are means ± SE (n > 300 cells/genotype; *p < 0.05; ***p < 0.001; ND, no significant difference; t test).
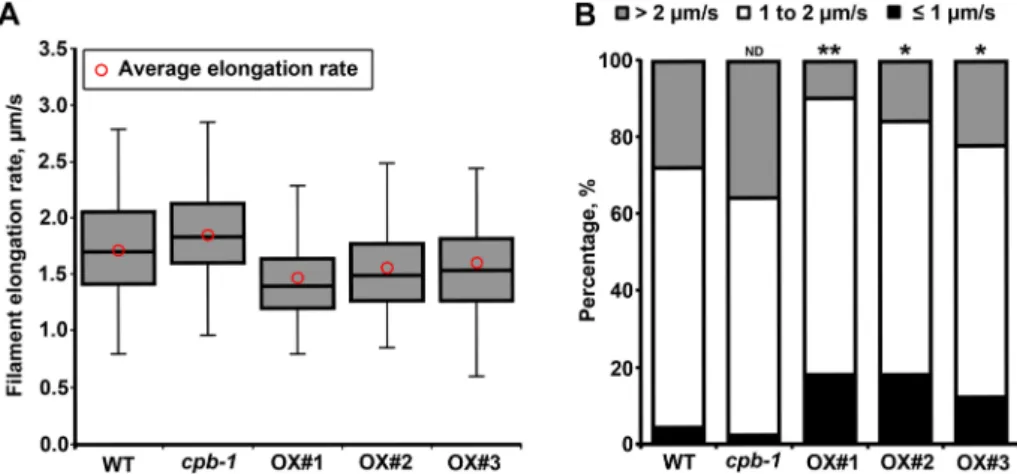
calculated the percentage of each population, as described for bud-ding yeast (Yu et al., 2011). As shown in Figure 8B, the majority of filament barbed ends elongated at rates between 1 and 2 μm/s in wild-type cells. Only 4% grew at a rate <1 μm/s, and 28% elongated at rates >2 μm/s. In cpb-1 mutant cells, the fast population of barbed ends increased by ∼8% compared with wild-type cells (Figure 8B, gray bars). CP overexpression resulted in a reduced percentage of filaments with fast elongation rate; this population was lowered to ∼10% in CP OX1 (Figure 8B, gray bars). Moreover, the population of barbed ends with slow rates increased to 18% in CP OX1 cells (Figure 8B, black bars). Among all of the genotypes, the proportion of filaments growing between 1 and 2 μm/s seemed to be unaf-fected (Figure 8B, white bars). These results suggested that, similar to budding yeast, there might be mechanistically distinct types of elongating barbed ends in Arabidopsis epidermal cells. We infer that CP prefers to associate with the fast-elongating barbed ends in cells. The precise interaction between CP and barbed ends is re-quired for maintaining the normal distribution between populations of filament ends with different elongation rates.
DISCUSSION
To investigate the importance of filament barbed-end availability, we manipulated the levels of heterodimeric CP and evaluated the consequences for axial cell expansion, actin array architecture, and individual filament dynamics in living hypocotyl and root epidermal cells of Arabidopsis. Overexpression of CP led to shorter-than-nor-mal hypocotyl epidershorter-than-nor-mal cells, whereas CP knockdown resulted in increased axial cell expansion (Li et al., 2012). CP levels also led to predictable changes in the density of actin filament arrays and over-all actin array dynamics. More capped ends correlated with less-crowded cortical actin arrays and a reduction in overall actin dynam-ics. In contrast, cells with more free barbed ends had a greater density of filaments in the cortical array and increased dynamics (Li et al., 2012). By examining directly the behavior of filament ends and individual actin filament turnover, we also found that CP overex-pression reduces the number of filaments elongating at rates >2 μm/s and inhibits filament–filament annealing. Moreover, CP lev-els or activity contribute to actin filament turnover by modulating filament lengths and lifetimes. These data provide strong genetic and cytological evidence that regulation of filament end availability is a key cellular mechanism used to choreograph actin dynamics, organization of the cortical cytoskeletal array, and cell growth.
The barbed end of actin filaments is the favored site for actin polymerization in vitro (Pollard et al., 2000). One can speculate that the extent of actin assembly is governed in part by the number and availability of barbed ends in cells. Based on its biochemical proper-ties and cellular abundance, CP is considered to be a major filament end capper and regulator of actin assembly in vivo (Cooper and
FiguRE 4: CP levels affect cortical actin organization in hypocotyl epidermal cells. (A–E) Representative images of epidermal cells expressing GFP-fABD2 from 5-d-old etiolated hypocotyls for WT (A), cpb-1 (B), and CP OX1–3 lines (C–E). Images were collected by VAEM from the basal one-third of the hypocotyl. Bar, 10 μm. (F) Average filament density, or percentage of occupancy
measurements, were determined on images collected from epidermal
cells in the basal one-third of hypocotyls. The actin filament density was significantly decreased in CP OX1–3 lines. However, cortical actin arrays in the cpb-1 mutant were denser than with respective wild-type controls, as shown previously (Li et al., 2012). Values are means ± SE (n ≥ 500 images from 10 hypocotyls/genotype; *p < 0.05; **p < 0.01; t test). (G) The extent of bundling (skewness) was measured on the same images used in F. The actin arrays in cpb-1 mutant were modestly but significantly less bundled; in contrast, the extent of bundling was only slightly increased in CP OX1. Bundling analysis on the other two overexpression lines showed no significant difference from the respective wild-type controls (*p < 0.05; ND, no significant difference; t test).
that the total actin pool in Arabidopsis is es-timated to be >50 μM, this is theoretically high enough to support robust actin assem-bly from free barbed ends (Staiger et al., 2009; Henty-Ridilla et al., 2013). Thus, to generate and maintain a relatively low den-sity network, as found in the cortical array of hypocotyl epidermal cells, the precise regu-lation of CP to funnel subunits onto a limited number of free barbed ends becomes even more critical.
Here quantitative differences in the be-havior of filament ends and the density of the cortical array caused by altered CP ex-pression confirm this prediction. Cells in the cpb-1 mutant had more dynamic ends, with a significantly increased population of elongating filaments that initiated from ends, and a fivefold increase in filament– filament annealing, as reported previously (Li et al., 2012). Moreover, enhanced actin assembly onto ends of filaments correlated with denser actin arrays in the cortical cyto-plasm of hypocotyl and root epidermal cells (Li et al., 2012; Pleskot et al., 2013). In con-trast, increasing the abundance of CP caused the opposite effects on dynamic properties of filament ends and actin orga-nization. For example, no annealing events were observed among the hundreds of ends we monitored in the CP OX1 line, and actin filament abundance was reduced sig-nificantly. This contrasts with results from other organisms, in which overexpression of CP does not necessarily lead to reduc-tion in F-actin levels (Hug et al., 1995; Kovar et al., 2005), indicating that other mechanisms of actin assembly are required to maintain a constant ratio of G- to F-actin and can compensate for the effect of CP overexpression.
At the leading edge of migrating animal cells, the dynamics of lamellipodial actin is often measured by tracking GFP-actin speckles and extrapolating actin turnover rates from the average translocation rate of speckles in the network (Ponti et al., 2004; Iwasa and Mullins, 2007). Depletion of CP impairs lamellipodial actin dynamics (Iwasa and Mullins, 2007), indicating that CP facili-tates actin turnover in cells. Benefiting from the ability to visualize single-actin-filament dynamics in vivo (Staiger et al., 2009; Henty et al., 2011; Li et al., 2012), we dissected the ef-fects of CP on filament turnover in great detail. When compared with wild-type cells, elongating actin filaments in the cpb-1 mutant extended for longer periods before suffering the first severing events (Figure 7B), which might result from less frequent capping events at the growing ends in the presence of reduced CP levels. By contrast, cessation of growth occurs much quicker in CP OX cells. We further quantified the turnover of single actin filaments by mea-suring key parameters such as maximum filament length and life-time, as well as severing frequency. As shown in Table 1, cells with Sept, 2008; Pleskot et al., 2013). Genetic evidence from various
or-ganisms supports this assertion. In Dictyostelium and budding yeast, the number of free barbed ends inversely correlates with CP levels (Hug et al., 1995; Kim et al., 2004). Loss of CP results in an increase in the amount of filamentous actin, presumably due to more barbed ends being available for actin polymerization (Hug et al., 1995; Hop-mann et al., 1996; Kim et al., 2004; Kovar et al., 2005). In contrast to other organisms, in which the majority of the total actin is present in polymer (Karpova et al., 1995; Pollard et al., 2000; Kim et al., 2004), <5% of the G-actin pool is polymerized into filamentous actin in some plant cells (Gibbon et al., 1999; Snowman et al., 2002). Given
FiguRE 5: Cortical actin array organization and dynamics in epidermal cells from the root elongation zone are altered by changes in CP levels. (A) VAEM micrographs of the cortical actin array in epidermal cells from WT, cpb-1, and CP OX1–3 lines. Images were obtained from cells in the elongation zone of light-grown roots. Bar, 5 μm. (B) Average filament density, or percentage of occupancy measurements, were determined on images taken from epidermal cells in the root elongation zone of 7-d-old, light-grown seedlings. The percentage of occupancy (density) of actin filaments in the cortical array was significantly increased in cpb-1 mutant, as shown previously (Li et al., 2012; Pleskot et al., 2013). By contrast, actin filament density in CP OX1–3 lines was significantly decreased compared with WT cells. (C) The extent of bundling (skewness) was measured on the same images used in A. The actin array in CP OX1 cells was slightly more bundled. By contrast, the extent of bundling in cpb-1 mutant cells was modestly reduced when compared with WT cells. No significant differences from wild-type cells were shown in the other two overexpression lines by bundling analysis. Values in B and C are means ± SE (n > 300 images from 25 seedlings/genotype; **p < 0.01; ***p < 0.001; ND, no significant difference; t test). (D) Cortical actin array dynamics was measured by correlation coefficient analyses on time-lapse VAEM series from WT, cpb-1, and three CP OX lines. The actin arrays in cpb-1 mutant cells were significantly more dynamic. However, cells from CP OX lines had less dynamic actin arrays than did WT cells. Time-lapse series were recorded from epidermal cells in the root elongation zone of 7-d-old, light-grown seedlings. Values represent means ± SE (n > 50 time-lapse series/ genotype; p < 0.001 for WT vs. cpb-1 or CP OX1/2; p > 0.05 for WT vs. CP OX3; analysis of variance [ANOVA]).
influence the apparent frequency of events. In other words, reduc-tion in maximum filament length in CP OX lines results in lower sev-ering frequency, even though the number of breaks per unit time has not changed.
In addition to single-filament turnover, we explored how CP con-tributes to actin array dynamics on a macro scale. Using a correla-tion coefficient analysis that reports the extent of actin array enhanced CP levels have significantly decreased filament lengths.
Moreover, actin filaments in CP OX cells persist for a shorter period of time (Table 1 and Figure 7C). These behaviors of actin filaments are the opposite in cpb-1 mutant cells (Table 1 and Figure 7B). Al-though severing frequency increases in CP OX plants, we do not believe that this reflects enhanced breakage activity. Because length is in the denominator of the calculation, altered filament length can
FiguRE 6: Cortical actin array dynamics is altered by changes in CP levels. (A–C) Representative images from time-lapse VAEM series taken at 10-s intervals from WT (A), cpb-1 (B), and CP OX1 (C) hypocotyl epidermal cells. Images from three consecutive time points are colored red, green, and blue and merged in the right column. White indicates less-active actin structures during this time period. Bar, 10 μm. (D–G) Cortical actin array dynamics was measured by correlation coefficient analyses on time-lapse VAEM series from WT, cpb-1 (D), and CP OX1–3 cells (E–G). The extent of actin rearrangement during a given time period was determined by decay in correlation as the temporal interval increased. The cpb-1 mutant (D) showed much faster decay in the correlation coefficient values than did WT (p < 0.0001; ANOVA), whereas the CP OX1 line (E) showed slower decay than WT (p < 0.0001; ANOVA). The average correlation coefficient values at the indicated intervals were calculated from >40 time-lapse series taken from 10 hypocotyls for each genotype. Time-lapse series were recorded from epidermal cells in the basal one-third of 5-d-old, dark-grown hypocotyls. Error bars represent SE.
WT cpb-1 CP OX1 CP OX2 CP OX3
Elongation rate (μm/s) 1.71 ± 0.07 1.86 ± 0.06ND 1.46 ± 0.04** 1.54 ± 0.6* 1.58 ± 0.05* Severing frequency (breaks/μm/s) 0.016 ± 0.001 0.012 ± 0.001*** 0.024 ± 0.001*** 0.023 ± 0.001*** 0.017 ± 0.001ND Maximum filament length (μm) 12.6 ± 0.6 15.7 ± 0.5*** 9.5 ± 0.4*** 9.5 ± 0.3*** 11.8 ± 0.4ND Maximum filament lifetime (s) 21.4 ± 0.9 26.0 ± 1.2** 18.3 ± 0.6** 20.2 ± 0.6ND 21.3 ± 0.6ND Regrowth of severed ends (%) 3.2 ± 1.3 5.1 ± 1.7ND 2.2± 0.9ND 2.3 ± 1.2ND 3.3 ± 1.4ND Annealing of severed ends (%) 3.2 ± 1.2 17.3 ± 4.0** 0.0 ± 0.0* 1.8 ± 0.9ND 2.2 ± 1.1ND Filament origin
(%/cell)
De novo 32.4 ± 1.8 23.7 ± 2.3 24.7 ± 2.4 28.3 ± 2.0 28.6 ± 2.0 Ends 27.3 ± 2.2 42.0 ± 3.5†† 21.8 ± 2.6†† 24.7 ± 2.3† 25.9 ± 2.0ND Side 40.3 ± 2.1 34.3 ± 9.4 53.2 ± 2.9 46.7 ± 2.5 45.4 ± 2.7 Measurements taken from epidermal cells in the bottom one-third of 5-d-old hypocotyls from wild-type, cpb-1, and CP OX1–3 plants. Values are means ± SE, with n > 50 filaments from n > 10 epidermal cells and at least 10 hypocotyls/genotype. For filament origin: n > 30 cells from at least 10 hypocotyls/genotype. ND, Not significantly different from wild-type control value by t test; p > 0.05.
*Significantly different from wild-type control value by t test; p ≤ 0.05. **Significantly different from wild-type control value by t test; p ≤ 0.01. ***Significantly different from wild-type control value by t test; p ≤ 0.001.
†Significantly different from wild-type control group value by ANOVA; p < 0.05 ††Significantly different from wild-type control group value by ANOVA; p < 0.0001.
contribute to the cortical actin array dynam-ics. 2) Actin polymerization at barbed ends indirectly affects the abundance of filamen-tous actin that can be translocated in the cytoplasm.
It has been reported that CP regulates actin filament length by binding with high affinity and inhibiting monomer addition or loss from the barbed end in vitro (Cooper and Sept, 2008). Huang et al. (2003) showed that Arabidopsis CP causes a dose-dependent reduction in mean actin filament lengths in vitro. The regulation of filament length is suggested to be critical for cells to generate specific actin-based structures (Podolski and Steck, 1990; Pollard and Borisy, 2003; Pollard and Coo-per, 2009). For example, at the leading edge of crawling cells, the lamellipodial actin is a dense actin meshwork composed of short actin filaments with high branching frequency (Pollard and Borisy, 2003). Com-putational simulation reveals that, during self-organization of a dendritic network, most filaments are capped before growing >0.5 μm (Schaus et al., 2007). Several stud-ies suggest that CP is required to maintain this dendritic meshwork, presumably by keeping filaments short (Hug et al., 1995; Rogers et al., 2003; Mejillano et al., 2004; Iwasa and Mullins, 2007). Our data confirm the hypothesis that CP is necessary to reg-ulate actin filament length in vivo. Specifi-cally, actin filament length inversely corre-lates with the abundance of cellular CP. Elongating actin filaments in wild-type cells grow to ∼13 μm before assembly ceases (Staiger et al., 2009; Henty et al., 2011; Li et al., 2012). When the level of CP is re-duced, filaments can attain considerably longer maximum lengths, as shown previ-ously (Li et al., 2012). By contrast, cells with enhanced CP expression had ∼25% shorter filament lengths. Unlike mammalian cells (Mejillano et al., 2004), long actin filaments in cp mutant do not lead to an increase in the extent of filament bundling in Arabidopsis epidermal cells (Li et al., 2012), which indicates that the dendritic nucleation model may not explain the mechanism of cortical actin array organization in plant cells.
Individual actin filaments elongate rapidly in Arabidopsis epider-mal cells, with an average rate of ∼1.7 μm/s (Staiger et al., 2009; Henty et al., 2011; Li et al., 2012), which means that ∼630 monomers are assembled onto the barbed end per second (Staiger et al., 2009). As pointed out earlier, a huge pool of assembly-competent actin monomers could drive this rapid elongation from free barbed ends (Henty-Ridilla et al., 2013). In addition, processive elongation factors, such as formins, could enhance the growth rate even further. Formins are conserved proteins capable of both nucleating new fila-ments and facilitating processive subunit addition by persistent as-sociation with barbed ends (Goode and Eck, 2007). Only a few stud-ies have demonstrated the latter property for formins from plants. A class II formin from the moss Physcomitrella patens, For2A, can rearrangements over an entire temporal series (Vidali et al., 2010),
we showed that actin remodeling was much faster in cells with re-duced CP levels than with wild-type cells. By contrast, the actin ar-ray in CP OX cells was less dynamic overall. It is noteworthy that the fast turnover of individual actin filaments does not necessarily lead to enhanced overall actin array rearrangements. The correlation co-efficient analysis reveals the global changes in actin organization over time, which are influenced by a variety of events, including fila-ment and bundle translocation, filafila-ment growth, and disassembly. By contrast, analysis of single-filament dynamics provides more de-tailed information about how the properties of a subpopulation of actin structures—individual actin filaments—are regulated. Thus one may not be able to directly correlate the changes in dynamic behaviors of individual actin filament with the causes of overall actin array rearrangements. Instead of actin filament turnover, the altered cortical array dynamics resulting from changes in CP levels may de-pend on the availability of dynamic ends, possibly via two potential mechanisms: 1) The availability of filament barbed ends is critical for regulating the extent of actin assembly in vivo, which can directly
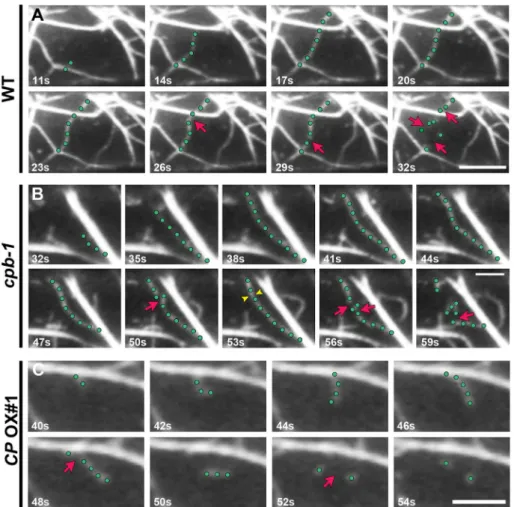
FiguRE 7: Changes in CP levels alter the dynamic behavior of single actin filaments in hypocotyl epidermal cells. (A) A representative actin filament from a WT epidermal cell (green dots) elongated rapidly and was subsequently dissembled by severing events (red arrows). Also see Supplemental Video S1. Bar, 10 μm. (B) A representative actin filament from a cpb-1 mutant epidermal cell (green dots) elongated rapidly but persisted longer before severing events occurred (red arrows). Newly created ends sometimes joined together by filament–filament annealing (yellow arrowheads). Also see Supplemental Video S2. Bar, 5 μm. (C) A representative actin filament from a CP OX1–line epidermal cell (green dots) elongated slowly and was severed (red arrows) within 2 s after elongation ceased. Also see Supplemental Video S3. Bar, 5 μm. Images were collected by time-lapse VAEM from epidermal cells in the basal one-third of 5-d-old, dark-grown hypocotyls.
Michelot et al., 2013). CP and Aip1 have overlapping functions but prefer different types of barbed ends (Michelot et al., 2013). Loss of Aip1 in moss leads to a decrease in severing frequency, presumably due to re-duced ADF/cofilin activity in aip1 mutant (Augustine et al., 2011). Collectively these data indicate the existence of distinct mole-cular mechanisms to regulate dynamic prop-erties of filament ends, and these should be addressed in the future.
How actin array dynamics and organiza-tion regulate anisotropic cell expansion is a long-standing and unresolved issue in plant biology (Smith and Oppenheimer, 2005; Hussey et al., 2006; Szymanski and Cos-grove, 2009). Studies on actin and actin-binding protein mutants demonstrate that disrupting actin array formation often results in cell expansion defects. However, the molecular mechanisms underlying these processes remain largely unknown. It has been suggested that the overall organiza-tion of cortical actin arrays does not neces-sarily correlate with cell expansion (Dyachok et al., 2008; Henty et al., 2011; Li et al., 2012). For example, an Arabidopsis adf4 mutant exhibits exces-sively bundled cortical actin arrays and enhanced axial cell expan-sion in dark-grown hypocotyls (Henty et al., 2011). However, hypo-cotyl cells with reduced CP levels have denser and less-bundled actin arrays but still show enhanced cell elongation in this tissue (Li et al., 2012). On the basis of the observation that maximum filament lengths and lifetimes are significantly increased in hypocotyl cells from both adf4 and cp mutants (Henty et al., 2011; Li et al., 2012), we hypothesize that these properties are critical for actin-coordinat-ing axial cell expansion, at least in dark-grown epidermal cells. Indi-vidual actin filaments could serve as tracks for positioning, retaining, and/or delivering Golgi-derived vesicles, which contain cell wall ma-trix polysaccharides or key enzymes such as the cellulose synthase complex (Gutierrez et al., 2009; Sampathkumar et al., 2013). In-deed, Ketelaar and coworkers showed that the Golgi apparatus made long excursions on actin filament bundles but much shorter translocations on dense actin meshworks (Akkerman et al., 2011). Constructing arrays of filaments with increased lengths and lifetimes could provide longer and more stable tracks for enhanced vesicle delivery to the plasma membrane, where exocytosis occurs, which consequently would lead to enhanced axial cell expansion (cpb-1). If this model is correct, decreasing these two parameters of actin turnover should result in the opposite phenotype. Our new data confirm this hypothesis; CP overexpression caused a significant re-duction in filament lengths and lifetimes. As a result, CP OX lines show decreased axial cell expansion of dark-grown hypocotyls. Al-though not tested directly, act2act7 double mutants and latrunculin B treatments are predicted to result in shorter filament lengths and lifetimes, and these conditions also result in reduced axial cell ex-pansion of hypocotyls (Baluska et al., 2001; Kandasamy et al., 2009; Sampathkumar et al., 2013). In support of this model, it was demon-strated recently that chimeric myosins capable of transporting or-ganelles at higher velocities than endogenous myosin XI correlate with enhanced cell expansion in Arabidopsis, whereas low-speed myosins have shorter cells (Tominaga et al., 2013). However, addi-tional studies on single-filament dynamics in other actin-binding promote the barbed-end elongation of actin filaments at rates that
are 19 times faster than actin alone in vitro (Vidali et al., 2009). More-over, the For2A-associated filament ends elongate at 1.8 μm/s in moss cells (van Gisbergen et al., 2012). Arabidopsis has >20 formin isoforms (Blanchoin and Staiger, 2010), but their characterization is incomplete. To gain further insights about the mechanisms of fila-ment elongation in epidermal cells, we performed a more detailed analysis of barbed-end growth rates. Elongating filaments were cat-egorized into three populations: fast (>2 μm/s), intermediate (be-tween 2 and 1 μm/s), or slow (<1 μm/s) growing. We hypothesize that barbed ends elongating at different growth rates are either free barbed ends or associated with distinct formin isoforms. This hy-pothesis is supported by similar studies from yeast, where it has been shown that a subpopulation of actin cable elongation is regu-lated by specific formins (Chesarone-Cataldo et al., 2011; Yu et al., 2011). Combined with a state-of-art imaging system, similar reverse-genetics experiments could be applied to plant formin mutants (Rosero et al., 2013), providing an unparalleled opportunity to dis-sect the function of plant formins in actin filament nucleation and assembly.
Altering the cellular abundance of CP in Arabidopsis influenced the proportion of actin filaments with different elongation rates. Only the populations of fast- and slow-growing filaments were af-fected by changes in CP level; the percentage of filaments growing at intermediate rates was similar between genotypes. These results suggest that CP terminates the growth of only the fast-growing (>2 μm/s) filament ends in cells. Moreover, we found that neither increasing nor decreasing CP expression impaired the regrowth fre-quency of newly severed ends, suggesting that there are multiple filament-end regulators in plants. Besides formins and CP, several classes of actin-binding proteins are known to control filament ends (Cooper and Schafer, 2000). Little is known about how the filament ends are controlled by these various end-binding proteins in cells and whether they are mechanistically different. Several studies dem-onstrate that actin-interacting protein1 (Aip1) interacts with actin filament barbed ends in budding yeast (Okreglak and Drubin, 2010;
FiguRE 8: Proportion of filament ends with different elongation rates is altered in cpb-1 mutant and CP OX lines. (A) Box plots show the elongation rates of filament ends measured in
wild-type, cpb-1 mutant, and CP OX–line cells. The box spans the first quartile to the third quartile. The line inside the box shows the median. The bars above and below the box show the minimum and maximum values. Red circles indicate the average filament elongation rates (n ≥ 100 filaments/genotype). (B) Filament elongation rates from A were categorized into three velocity populations (Yu et al., 2011): slow, <1 μm/s; intermediate, between 1 and 2 μm/s; and fast, >2 μm/s. Percentages of these populations were calculated. The majority of filaments in WT cells grew at intermediate rates. Cells in cpb-1 mutant had a greater proportion of fast-growing ends than did WT cells, whereas the population of slow-fast-growing ends significantly increased in CP OX1–3 cells (n ≥ 100 filaments/genotype; *p < 0.05; **p < 0.01; t test).
pMLBART:GFP-fABD2, and selected on Basta plates. All experi-ments were performed with T4 lines.
RNA extraction and qRT-PCR
Ten-day-old, dark-grown seedlings were collected for total RNA iso-lation with TRIzol reagent (Invitrogen) according to the manufactur-er’s instructions. The isolated RNA was further treated with RQ1 DNase (Promega, Madison, WI). cDNA was synthesized using Molo-ney murine leukemia virus reverse transcriptase according to manu-facturer’s instructions (Invitrogen). To quantify gene expression, two-step qRT-PCR was performed using 2× SYBR Green master mix (Qiagen, Valencia, CA). Gene-specific primers for CPA (At3g05520) and CPB (At1g71790) used in this study were described previously (Li et al., 2012). GAPD was used as an internal control to normalize gene expression across different samples. The fold change in the target gene, normalized to GAPD and relative to the gene expres-sion in the control sample, was calculated as described (Khurana et al., 2010). Three biological and technical replicates were per-formed per genotype.
Semiquantitative immunoblotting
Twenty-day-old, light-grown seedlings of wild-type, cpb-1 mutant, and CP OX lines were used to estimate CP protein levels. About 0.2 g of whole-plant material was ground with liquid nitrogen into a fine powder and suspended with homo genization buffer contain-ing 20 mM 4-(2-hydroxyethyl)-1-piperazineethanesulfonic acid/ KOH, pH 7.2, 50 mM KOAc, 2 mM Mg(OAc)2, 250 mM sorbitol, 1 mM EDTA, 1 mM ethylene glycol tetraacetic acid, 1 mM dithio-threitol, 1 mM phenyl methylsulfonyl fluoride, and 1% protease inhibitor cocktail (2 mM o-phenanthroline, 0.5 mg/ml leupeptin, 2 mg/ml aprotinin, 1 mg/ml pepstatin). This was followed by cen-trifugation at 4°C, 15,000 × g for 5 min, as described previously (Chaudhry et al., 2007). Total protein concentration from superna-tant was determined with the Bradford assay (Protein Assay; Bio-Rad, Hercules, CA) using bovine serum albumin as a standard. For each genotype, 50–75 μg of total protein was loaded on the same SDS–PAGE along with 5 ng of recombinant CP. Proteins sepa-rated by SDS–PAGE were transferred to nitrocellulose membranes and probed with anti-AtCPA and anti-AtCPB antibodies at a dilu-tion of 1:2000, as described previously (Huang et al., 2003). Phos-phoenolpyruvate carboxylase (PEPC; Rockland Immunochemicals, Gilbertville, PA) was used as a loading control. The blots were incu-bated in horseradish peroxidase–coupled secondary antibody (Sigma-Aldrich, St. Louis, MO) at 1:100,000 dilution and developed with SuperSignal Pico West chemiluminescent substrate (Thermo Scientific, Rockford, IL) according to manufacturer’s instructions. Densitometric analysis was performed for quantitative measure-ments of protein levels using ImageJ. Fold change in each CP subunit, normalized to PEPC and relative to protein levels in the control sample, was calculated. Five biological replicates were per-formed per genotype.
Quantitative analyses of the architecture of cortical actin arrays
The extent of actin filament bundling and percentage occupancy were measured using two parameters: skewness, based on the as-sumption that a population of actin filaments exhibits enhanced pixel intensities when bundled; and density, calculated as the percentage of occupancy of GFP-fABD2 signals in an image (Higaki et al., 2010; Khurana et al., 2010; Henty et al., 2011; Li et al., 2012). Epidermal cells in the basal one-third of 5-d-old, dark-grown hypocotyls or from the root elongation zone of 7-d-old, light-grown seedlings were protein mutants with cell expansion defects will be required to
fur-ther support this model. MATERIALS AND METHODS Plant material and growth conditions
All A. thaliana plants in this study were in the Columbia-0 (Col-0) background. The homozygous cpb-1–knockdown mutant (SALK_014783) was identified and characterized previously (Li et al., 2012). The homozygous line was crossed to wild-type Col-0 ex-pressing the GFP-fABD2 reporter (Sheahan et al., 2004; Staiger et al., 2009), and homozygotes were recovered from F2 populations (Li et al., 2012). Seeds were surface sterilized and stratified at 4°C for 3 d on agar plates comprising half-strength Murashige and Skoog (MS) medium supplemented with 1% sucrose. For dark-grown hypocotyl length measurements, we grew stratified seeds in continuous darkness for 2–12 d after exposing the plates to light for 4 h. To analyze root growth, seedlings were grown vertically on 0.5× MS medium with 0% sucrose and 0.6% agar under long-day conditions (16 h light/8 h dark) at 21°C, as described previously (Dyachok et al., 2011; Li et al., 2012). To measure epidermal cell length and width, 5-d-old dark-grown hypocotyls were incubated in 5 μM FM4-64 dye (Invitrogen, Grand Island, NY) for 10 min. Every epidermal cell in a file along the long axis of the hypocotyl was imaged using a 10×/0.25 numerical aperture objective on a Nikon Microphot SA wide-field fluorescence microscope equipped with a charge-coupled device camera (ORCA-ER C4742-95; Hamamatsu Photonics, Middlesex, NJ); raw cell length and width values were binned into thirds based on the position along the hypocotyl. A double-blind experimental design was used for all phenotypic anal-yses. All image measurements were performed with ImageJ (National Institutes of Health, Bethesda, MD).
generation of CP-overexpression lines
Transgenic Arabidopsis lines overexpressing heterodimeric CP were created by cotransforming Col-0 with two different binary vec-tors, each containing the full-length cDNA for CPA or CPB behind the CaMV-35S promoter. The full-length cDNAs for each subunit were amplified from the pET-23a-AB vector described previously (Huang et al., 2003) with PCR and the following primers: CPA, 5′-GGGGTACCATGGCGGACGAAGAAGATGAG-3′ and 5′-CG-GGATCCTCACAAATCCTTGAAAGTGTT-3′; and CPB, 5′-GG-GGTACCATGGAGGCAGCTTTGGGACTT-3′ and 5′-CGGGATCCT-CACAATGTGCAAACCATTTC-3′. The amplified products, with KpnI and BamHI sites introduced (underlined), were restriction digested, cloned into pBluescript II, and sequenced to verify their integrity. The coding sequences were removed from pBlue-script-CPA or -CPB and subcloned into pART7 (Gleave, 1992) that was digested with KpnI and BamHI. The cassettes contain-ing 35S promoter, CPA or CPB, and the ocs terminator were re-moved by restriction with NotI and subcloned into the binary vector pART27 (Gleave, 1992). Alternatively, the expression cas-sette from pART7 was blunt ended and ligated into pCAM-BIA1300 prepared with SmaI to generate binary vectors with hygromycin (hyg) resistance. All binary vectors were transformed into Agrobacterium tumefaciens strain GV3101. One plasmid each for CPA and CPB, with reciprocal selection markers (hyg and kan), was introduced into Arabidopsis plants by the floral-dip method (Zhang et al., 2006). Transformants were selected in the T2 generation on plates containing both antibiotics, and lines overexpressing CP identified by quantitative real-time (qRT)-PCR and semiquantitative immunoblots (see later descrip-tion). Suitable T3 lines were transformed with a binary vector,