HAL Id: hal-01266245
https://hal-enpc.archives-ouvertes.fr/hal-01266245
Submitted on 19 Jun 2018
HAL is a multi-disciplinary open access
archive for the deposit and dissemination of
sci-entific research documents, whether they are
pub-lished or not. The documents may come from
teaching and research institutions in France or
abroad, or from public or private research centers.
L’archive ouverte pluridisciplinaire HAL, est
destinée au dépôt et à la diffusion de documents
scientifiques de niveau recherche, publiés ou non,
émanant des établissements d’enseignement et de
recherche français ou étrangers, des laboratoires
publics ou privés.
Removal of emerging micropollutants from wastewater
by activated carbon adsorption: Experimental study of
different activated carbons and factors influencing the
adsorption of micropollutants in wastewater
R. Mailler, J. Gasperi, Y. Coquet, C. Derome, A. Buleté, E. Vulliet, Adèle
Bressy, G. Varrault, G. Chebbo, V. Rocher
To cite this version:
R. Mailler, J. Gasperi, Y. Coquet, C. Derome, A. Buleté, et al.. Removal of emerging micropollutants
from wastewater by activated carbon adsorption: Experimental study of different activated carbons
and factors influencing the adsorption of micropollutants in wastewater. Journal of Environmental
Chemical Engineering, Elsevier, 2016, 4 (1), �10.1016/j.jece.2016.01.018�. �hal-01266245�
Removal of emerging micropollutants from wastewater by activated carbon adsorption:
1
experimental study of different activated carbons and factors influencing the adsorption of
2
micropollutants in wastewater
3
4
R. Mailler1A*, J. Gasperi1*, Y. Coquet2, C. Derome1, A. Buleté3, E. Vulliet3, A. Bressy4, G. Varrault1, G.
5
Chebbo4 and V. Rocher5
6 7
1 LEESU (UMR MA 102, Université Paris-Est, AgroParisTech), Université Paris-Est Créteil, 61 avenue du
8
Général de Gaulle, 94010 Créteil Cedex, France. (E-mail: maillerr@leesu.enpc.fr; gasperi@u-pec.fr) 9
2 SAUR, Direction de la Recherche et du Développement, 1 rue Antoine Lavoisier, 78064 Guyancourt, France.
10
3 Université de Lyon, Institut des Sciences Analytiques, UMR5280 CNRS, Université Lyon 1, ENS-Lyon, 5
11
rue de la Doua, 69100 Villeurbanne, France. 12
4 LEESU (UMR MA 102, Université Paris-Est, AgroParisTech), École des Ponts ParisTech, 6-8 avenue Blaise
13
Pascal, Champs-sur-Marne, 77455 Marne-la-Vallée Cedex 2, France. 14
5 SIAAP, Direction du Développement et de la Prospective, 82 avenue Kléber, 92700 Colombes, France.
15 * Corresponding authors 16 17 HIGHLIGHTS 18
BET surface and bulk density of activated carbons are correlated to micropollutants adsorption, 19
The activated carbon dose and the contact time have a great influence on adsorption, 20
FeCl3 has a positive influence on micropollutants adsorption by activated carbon (+10-15%),
21
Both the quantity and composition of organic matter impact the adsorption, 22
UV-254 removals are correlated to several micropollutants removals. 23
24
A Present adress: SIAAP, Direction du Développement et de la Prospective, 82 avenue Kléber, 92700 Colombes,
ABSTRACT 25
26
Activated carbon processes, initially designed for drinking water production, are tested for wastewater application in order 27
to characterize their efficiency to remove micropollutants from wastewater treatment plants (WWTPs) discharges. In that 28
purpose, a pilot was set up at the Seine Centre WWTP and is studied by the Paris sanitation service (SIAAP) and the 29
Water Environment and Urban Systems laboratory (LEESU). The in-situ study raised several additional questions related 30
to the structural and morphological properties of activated carbons, in order to select the proper material, the influence of 31
operational parameters such as the activated carbon dose and the contact time, the role of organic matter concentration 32
and composition, the presence of a residual concentration of methanol or the impact of ferric chloride addition. Thus, 33
various complementary experiments were carried out at laboratory scale to improve the understanding of the 34
micropollutants adsorption process on activated carbon, in particular on powdered activated carbon (PAC). 35
36
The results have highlighted a strong link between the efficiency of PACs and their specific surface (BET), which can be 37
easily estimated by their bulk density. The study of the sorption process has also confirmed the strong influence of the 38
PAC dose and the rapidity of the sorption kinetic. From an operational point of view, the ferric chloride injection seems 39
to slightly improve most of the detected compounds adsorption, probably thanks to the coagulation of the dissolved 40
organic matter colloidal fraction. In contrary, the presence in the water of a residual concentration of methanol seems to 41
have no impact on the pharmaceuticals fate. The influence of the wastewater matrix where adsorption is performed is 42
strong, with notably lower adsorption in settled water compared to various WWTP discharges. However, the dissolved 43
organic carbon concentration is not always sufficient to explain sorption competitions in wastewater, and the composition 44
and the distribution of the organic matter should be considered too. In particular, the carbon removal from biological 45
treatments is the step that clearly modifies both the quantity and the composition of the organic matter. It has been 46
observed that discharges from WWTPs operating with different biological processes (activated sludge, membrane 47
bioreactor or biofiltration) have similar organic matter concentrations and compositions, and allows comparable removals 48
of organic matter and micropollutants by adsorption. The lower performances on micropollutants observed in the settled 49
water can be explained by the higher quantity of small protein-like molecules (fluorophores δ and γ), which compose the 50
most competitive organic matter fraction for adsorption on activated carbon, compared to the other waters. 51
52 53
KEYWORDS 54
Adsorption; organic matter; pharmaceuticals; activated carbon; wastewater 55 56 INTRODUCTION 57 58
The presence of a large range of emerging micropollutants, particularly pharmaceuticals and hormones, personal care 59
products or pesticides, has been highlighted in wastewater treatment plant (WWTP) discharges (Miège et al. 2009; 60
Verlicchi et al. 2012; Loos et al. 2013; Mailler et al. 2015). Even if several hydrophobic, volatile or biodegradable 61
compounds are strongly removed by conventional wastewater treatments (Ruel et al. 2012; Mailler et al. 2014b), most of 62
micropollutants are not removed. Thus, various strategies of contamination reduction are assessed by the scientific 63
community and water treatment engineers. Among them, the implementation of tertiary treatments dedicated to 64
micropollutants elimination represents a relevant solution. In particular, adsorption on activated carbon appears to be 65
efficient, very flexible and relatively cheap (Abegglen & Siegrist 2012), together with not producing oxidation by-66
products. 67
68
In this context, the Parisian public sanitation service (SIAAP) and the Water Environment and Urban Systems laboratory 69
(LEESU) study, in collaboration with SAUR teams, the CarboPlus® process. This process is based on a fluidized bed of 70
activated carbon (powder - PAC - or micro-grain - µGAC) to remove micropollutants by adsorption. A large-scale pilot 71
based on this technology was set up at the Seine Centre WWTP (240 000 m3/days) to characterize the efficiency of
72
activated carbon to remove a wide range of pollutants from WWTP discharges. The in-situ results are presented in (Mailler 73
et al. 2015) for PAC. 74
In parallel to the in situ study, complementary laboratory scale experiments were conducted to i) better understand the 75
relationships between activated carbon properties and the adsorption in wastewater and ii) to improve the understanding 76
of the micropollutant adsorption mechanisms in wastewater application, in particular with PAC. 77
78
Activated carbon is characterized by different structural and morphological properties that can affect adsorption (Baudu 79
et al. 2001; Li et al. 2002; Yu et al. 2008; Delgado et al. 2012). Thus, the first axis consists in studying the relationships
80
between activated carbon properties and their efficiency to remove micropollutants. In particular, a focus is performed on 81
the specific BET surface and the bulk density. 82
83
The second axis consists in studying the adsorption mechanism in wastewater representing a complex matrix. Indeed, the 84
literature highlighted that the matrix where adsorption is performed plays a crucial role in the fate of molecules (Ebie et 85
al. 2001; Ternes et al. 2002; de Ridder et al. 2010; de Ridder et al. 2011), particularly the organic matter which competes
86
with pollutants for adsorption through direct sites competition or pore blocking. In addition, most of the studies were 87
conducted for drinking water production or in surface waters, and the adsorption mechanisms were poorly assessed in 88
wastewater. Thus, the influences of both the activated carbon dose and the contact time on the performances were 89
assessed, as well as the influence of the organic matter and chemicals that can be injected within the process for 90
operational purposes. 91
92
This article summarizes the results from the laboratory scale experiments conducted within this project. First, the 93
relationships between micropollutants removals and activated carbon properties are assessed. Then, the influence of the 94
dose of carbon, the contact time, the organic matter quantity and quality, the presence of a residual concentration of 95
methanol and the injection of FeCl3 were studied.
96 97 98
MATERIALS AND METHODS 99
100
1. Activated carbon characterization 101
102
11 adsorbents, including micro and mesoporous PACs and µGAC, have been selected based on their technical datasheets 103
provided by the producers. Among them, 3 are commercialized by DaCarb® (PB 170®, PB 170-400® and PC 1000® - 104
France), 3 by Chemviron® (WP 235®, Carbsorb 28® and Cyclecarb 305® - Belgium), 2 by Norit® (W 35® and SA 105
Super® - Netherlands) and 3 by Jacobi® (LP 39®, MP 25® and Hydro XP 17® - Sweden). These activated carbons are 106
recognized for their high organic pollutants affinity, but their use in wastewater was poorly studied in the literature. 107
108
Several structural properties such as the specific BET surface (m2/g), the porous volume (mL/g), the pore size distribution
109
and the bulk density (g/cm3) have been measured on the 11 activated carbons. In addition, the particle size distribution
110
and the micropollutant elimination have been determined for 4 of them: PB 170®, WP 235®, W 35® and PC 1000®. 111
112
These structural properties have been analyzed at the University of Technology of Compiègne (UTC, France). The 113
specific BET surface and the pore size distribution were measured with an ASAP 2010 Micromeritics analyzer equipped 114
with a degasing station and a gas isotherm adsorption analyses station (nitrogen), according to the conventional methods 115
used to determine these parameters. Fresh activated carbon samples (100 mg) were degased at least 12 h before to be 116
analyzed. Results correspond to the specific surface in m2/g obtained with the BET (Brunauer, Emett and Teller) method.
117
The pore size distribution is determined with the BJH (Barrett, Joyner and Halenda) method, using the desorption curve 118
of the same gas on the same analyzer. This method allows also calculating the microporous and mesoporous pore volumes. 119
The bulk density was measured by weighting, with a high precision balance (0.01 mg), 50 to 100 mL of activated carbon, 120
measured with a 100 mL graduated cylinder. The activated carbon is introduced by small doses (10 mg) and is compacted 121
every 10 mL to minimize the vacuum between particles. 122
The particles size distribution of the 4 PACs was measured with a Mastersizer 2000 Malvern laser particle sizer. Every 123
analysis corresponds to 15 000 light diffraction measures. 3 scans were performed at least per sample. 124
125
2. Pollutants and analytical procedures 126
127
For every sample, several parameters were measured in the dissolved phase: UV absorbance at 254 nm (UV-254), 128
dissolved organic carbon (DOC) and concentrations of 16 pharmaceuticals and 2 pesticides (list and limit of quantification 129
in supporting material - Table S1). Organic micropollutants were analyzed by the Institute of Analytical Sciences (ISA - 130
Villeurbanne, France), while UV-254 and DOC were measured by the SIAAP laboratory (French accreditation - 131
Colombes, France). Analytical protocols are validated and are given in (Mailler et al. 2015). 132
133
3D fluorescence spectrometry analyses were also performed by the LEESU. They allow generating a tridimensional 134
matrix and to plot it on a 3D spectrum containing all excitation and emission spectra of the dissolved organic matter 135
(DOM) present in a sample. This method gives the distribution of the different components of the DOM as they don’t 136
fluoresce in the same zones of the spectrum. The detailed description of 3D fluorescence spectrometry is given in (Hudson 137
et al. 2007). Analyses have been performed with a Jasco FP-8300 spectrofluorometer equipped with a 1 cm quartz cell.
138 139
3. Laboratory experiments protocols 140
141
The laboratory experiments have been performed in the Seine Centre WWTP (Colombes, France) between April 2013 142
and May 2015. Wastewater was punctually sampled from the WWTP discharges with 10 L glass bottles, properly rinsed 143
and grilled, and used the same day for experiments. Then, samples were filtered on glass fibers filters (GF/F 0.7 µm) after 144
experiments, before to be sent to laboratories for analyses. 145
146
3.1. Efficiency comparison of 4 PACs 147
148
The efficiency of 4 PACs (PB 170®, WP 235®, W 35® and PC 1000® - Table 1) to remove micropollutants was assessed, 149
by contacting individually 10 mg/L of each PAC with 1 L of Seine Centre WWTP (SEC) discharges during 45 min under 150
strong mixing. After filtering, samples were conditioned and sent to ISA laboratory to analyze pharmaceuticals and 151
pesticides. 152
153
3.2. PAC dose and adsorption kinetic 154
155
Regarding its performances, PB 170® was selected to characterize the relationship between PAC dose, contact time and 156
micropollutant removal. First, 10 mg/L of this PAC were contacted with 1 L of SEC discharges under strong mixing 157
during different contact times (5 - 10 - 30 - 45 - 60 min), which are close from the pilot contact time range. Then, 3 PAC 158
doses (5 - 10 - 20 mg/L) were tested with 1 L of SEC discharges and during 45 min. 159
160
3.3. DOM and adsorption 161
162
The DOM has been identified to play a crucial role in the adsorption process because it induces a competition with the 163
organic micropollutants for adsorption (Matsui et al. 2003; de Ridder et al. 2011; Delgado et al. 2012). These phenomena 164
have been principally observed with surface water and natural organic matter, but some recent studies also studied it in 165
wastewater (Margot et al. 2013; Altmann et al. 2014). In this context, it is necessary to determine the role of both the 166
quantity and the quality of the DOM in the adsorption process. To this end, 7 types of wastewater featuring by different 167
levels of organic matter (Table 1) have been contacted under strong mixing with PAC (10 mg/L of PB 170® during- 45 168
min). Among the tested waters, 4 were WWTP discharges, from Seine Centre (SEC), Seine Aval (SAV), Seine Morée 169
(SEM) and Seine Amont (SAM) WWTPs. The 3 other tested waters were outlet waters from the physico-chemical 170
lamellar settling unit (SEC settled water) and the carbon biofiltration effluent (carbon removal) of SEC, as well as SEC 171
settled water diluted with distilled water to reach a DOC level comparable to the WWTP discharges. The layouts of the 172
different studied WWTPs are given in supporting material - Table S1, as well as the sampling points (red circles). The 173
organic matter characteristics of these waters are different and given in Table 1. Among the 7 wastewaters, the 174
micropollutants adsorption has been assessed with SEC settled water, SEC carbon biofiltration effluent, SEC and SAV 175
discharges. 176
177
A 3D fluorescence spectrometry characterization has also been performed on these 7 waters, before and after contact with 178
PAC. The spectra interpretation follows the fluorophores defined in (Parlanti et al. 2002), as indicated for SEC settled 179
water and discharges in supporting material - Figure S2. α, α’ and β correspond to humic-like substances, γ and δ 180
respectively represents tyrosine-like and tryptophan-like proteins. Then, I1, I2, I3 and I4 indexes, respectively 181
corresponding to the ratios α’/α, β/α, γ/α and δ/α, were calculated to evaluate the distribution. Finally, the humification 182
index (HIX) and the biological activity index (BIX) were also evaluated (Zsolnay et al. 1999; Parlanti et al. 2002). The 183
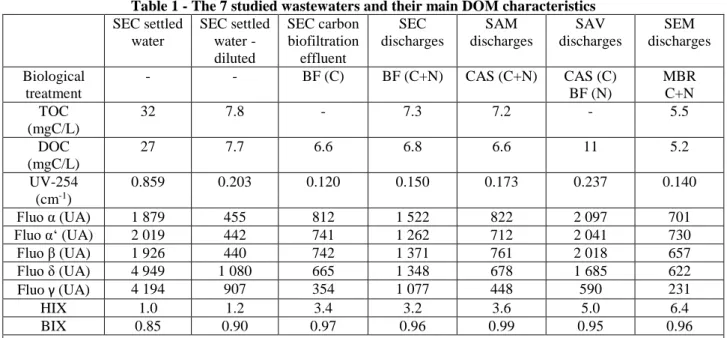
different fluorophores, HIX and BIX are given in Table 1 for the 7 tested wastewaters. 184
185
Table 1 - The 7 studied wastewaters and their main DOM characteristics
186 SEC settled water SEC settled water - diluted SEC carbon biofiltration effluent SEC discharges SAM discharges SAV discharges SEM discharges Biological treatment - - BF (C) BF (C+N) CAS (C+N) CAS (C) BF (N) MBR C+N TOC (mgC/L) 32 7.8 - 7.3 7.2 - 5.5 DOC (mgC/L) 27 7.7 6.6 6.8 6.6 11 5.2 UV-254 (cm-1) 0.859 0.203 0.120 0.150 0.173 0.237 0.140 Fluo α (UA) 1 879 455 812 1 522 822 2 097 701 Fluo α‘ (UA) 2 019 442 741 1 262 712 2 041 730 Fluo β (UA) 1 926 440 742 1 371 761 2 018 657 Fluo δ (UA) 4 949 1 080 665 1 348 678 1 685 622 Fluo γ (UA) 4 194 907 354 1 077 448 590 231 HIX 1.0 1.2 3.4 3.2 3.6 5.0 6.4 BIX 0.85 0.90 0.97 0.96 0.99 0.95 0.96 SEC = Seine Centre WWTP; SAM = Seine Amont WWTP; SAV = Seine Aval; SEM = Seine Morée.
BF = biofiltration; CAS = conventional activated sludge; MBR = membrane bioreactor: C = carbon removal; N = nitrogen removal (nitrification + denitrification).
DOC = dissolved organic carbon, UV-254 = UV absorbance at 254 nm, Fluo = fluorophore, HIX = humification index, BIX = biological activity index.
187 188
3.4. Influence of the residual methanol concentration in the WWTP discharges 189
190
A residual methanol concentration is present in both SEC and SAV discharges because of the post-denitrification stage. 191
Indeed, denitrifying microorganisms needs a carbon source and when the denitrification is performed after the carbon 192
removal and the nitrification, as in both SEC and SAV, the carbon content is too low (Rocher et al. 2012). Methanol is 193
then added during this stage as carbon source, but its consumption by the microorganisms is not complete. Operationally 194
speaking, it is interesting to study the impact of this residual concentration on the micropollutant adsorption by activated 195
carbon. Thus, the performances obtained with the SEC discharges have been compared to performances obtained with 196
the same water spiked with methanol (6 and 12 mgC/L). The adsorbability of methanol has also been studied and 197
preliminary tests demonstrated that no adsorption of methanol occurs when contacting 12 mgC/L of methanol in ultra-198
pure water with 10 mgPAC/L. 199
200
3.5. Influence of the ferric chloride 201
202
The CarboPlus® process operating in PAC configuration requires the injection of FeCl3 to stabilize the PAC bed and
203
prevent any leakage. This substance is known to destabilize particles by neutralization of the surface charges, which could 204
impact the adsorption of micropollutants. To evaluate the impact of FeCl3, 1 L of SEC discharges have been contacted
205
with PAC alone (10 mg/L), FeCl3 alone (2.5 gFeCl3/m3) and both PAC and FeCl3 under strong mixing during 45 min.
206 207 208
RESULTS AND DISCUSSION 209
210
1. Influence of PAC characteristics on its efficiency 211
212
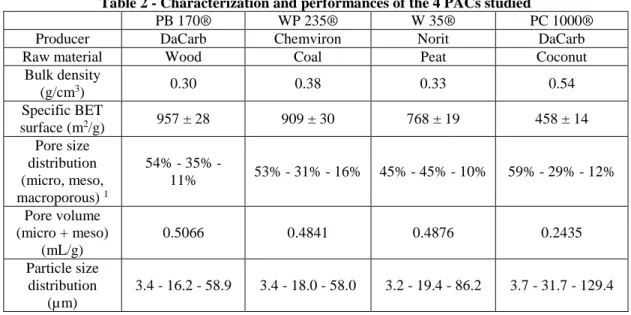
Structural and morphological properties of the 4 tested PACs are given in the Table 2. The removals of the micropollutants 213
with a PAC dose of 10 mg/L during 45 min are also provided. 214
Table 2 - Characterization and performances of the 4 PACs studied
215
PB 170® WP 235® W 35® PC 1000® Producer DaCarb Chemviron Norit DaCarb Raw material Wood Coal Peat Coconut
Bulk density (g/cm3) 0.30 0.38 0.33 0.54 Specific BET surface (m2/g) 957 ± 28 909 ± 30 768 ± 19 458 ± 14 Pore size distribution (micro, meso, macroporous) 1 54% - 35% - 11% 53% - 31% - 16% 45% - 45% - 10% 59% - 29% - 12% Pore volume (micro + meso) (mL/g) 0.5066 0.4841 0.4876 0.2435 Particle size distribution (µm) 3.4 - 16.2 - 58.9 3.4 - 18.0 - 58.0 3.2 - 19.4 - 86.2 3.7 - 31.7 - 129.4
d10 - d50 - d90
Micropollutant removal (%) - (10 mg/L of PAC, 45 min of contact) 16 micro-pollutants 2 61% 53% 51% 32% Atenolol 54% 44% 41% 21% Carbamazepine 63% 44% 48% 16% Ciprofloxacin 77% 63% 62% 49% Diclofenac 32% 22% 28% 5% Diuron 75% 66% 60% 24% Norfloxacin 79% 69% 62% 58% Ofloxacin 79% 71% 68% 46% Propranolol 81% 76% 70% 46% Roxithromycin 43% 38% 40% 21% Trimethoprim 46% 36% 33% 10% 1 Distribution of surface. Micropore = < 2 nm, mesopores = < 50 nm and macropores = > 50 nm. 2 Sum of 16 pharmaceuticals = atenolol, bezafibrate, carbamaepine, ciprofloxacin, diclofenac, erythromycin, ketoprofen, lorazepam, metronidazole, naproxen, norfloxacin, ofloxacin, propranolol, roxithromycin, sulfamethoxazole and trimethoprim.
216
Among the 4 PACs, the PB 170® and WP 235® have a similar mesoporous structure with close pore size distribution 217
and specific BET surface (900-1000 m2/g), while W 35® and especially PC 1000® have different pore surface
218
distributions and lower specific BET surfaces (supporting material - Figure S3; Table 2). W 35® is strongly 219
mesoporous with 45% of the BET surface resulting from mesopores, while PC 1000® is microporous with 59% of the 220
surface resulting from micropores. 3 of the tested PACs have similar bulk densities (0.30-0.40 g/cm3) while PC 1000®
221
is heavier (0.54 g/cm3). Regarding the particle size distribution, PB 170® and WP 235® are comparable while the two
222
other PACs have a larger particle size distribution and a higher median diameter. This is particularly notable for the PC 223
1000® which is characterized by median and d90 values twice higher than those of the PB 170® and WP 235®. 224
225
Even if only 1 punctual experiment was performed, a clear trend can be observed with most of the compounds. For 226
individual compounds, the PB 170® allows the highest removals for 15 of the 18 micropollutants and the PC 1000® is 227
always the worst efficient. The WP 235® and W 35® seem to have similar performances, slightly weaker than PB 170®. 228
Overall, the sum of the 16 pharmaceuticals is removed by 61%, 53%, 51% and 32% respectively by the PB 170®, WP 229
235®, W 35® and PC 1000®. 230
231
The micropollutant removal is well correlated with the specific BET surface (Figure 1): the higher the specific BET 232
surface, the higher the micropollutant removal. In addition, the specific BET surface is also correlated to the bulk 233
density of the PAC, a low bulk density corresponding to a high BET surface. This relationship has been verified with 7 234
other PACs differing by their nature, as the bulk density is very easy to measure and could therefore be a proxy of the 235
BET surface. Considering the 11 PAC, this link is still observed (Figure 1). Thus, the bulk density could be used as an 236
indicator to select activated carbons and estimate their BET surface and efficiency for micropollutants removal from 237
wastewater. 238
239
The link between the efficiency of activated carbons and their specific BET surface (600-1500 m2/g) has already been
240
observed in the literature (Çeçen & Aktas 2012), but the distribution of this surface between the different categories of 241
pores (micro < 2 nm, meso 2-50 nm and macropores > 50 nm) has also to be considered. This is particularly important 242
in presence of organic matter because it competes with micropollutants for adsorption, directly or by pore blocking 243
(Newcombe et al. 2002; Yu et al. 2008). Thus, a mesoporous structure with a large pore size distribution should limit 244
the competition with the DOM (Ebie et al. 2001). 245
246 247
249
Figure 1 - Correlations between the specific BET surface and the micropollutant removals obtained with a PAC,
250
and link with its bulk density
251 252 253
2. Adsorption of micropollutants on PAC 254
255
2.1. Influence of fresh PAC dose and adsorption kinetic 256
257
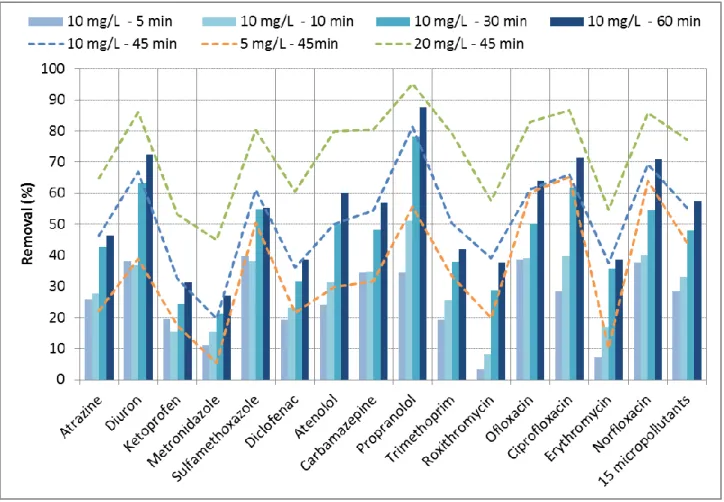
The Figure 2 displays the influence of the contact time and the PAC dose on the removal of micropollutants from Seine 258
Centre discharges by PAC. 259
260
Figure 2 - Micropollutants adsorption kinetic in the Seine Centre discharges and influence of the dose on
261
removals
262 263
According to the results (Figure 2), a higher dose of PAC logically results in higher micropollutant removals, i.e. 264
carbamazepine (32-54-80%; removals at 5-10-20 mgPAC/L), diclofenac (22-36-60%), propranolol (56-81-95%) or 265
sulfamethoxazole (51-61-80%). However, the relationship is not linear as doubling the PAC mass doesn’t result in a 266
doubling of the removals. Actually, the relationship is logarithmic resulting in the reaching of a plateau when increasing 267
the dose, as displayed in supporting material - Figure S4. Thus, the PAC dose in wastewater has a great influence on the 268
removal, as already observed in the literature (Snyder et al. 2007; Boehler et al. 2012; Margot et al. 2013) or at large scale 269
with the CarboPlus® pilot (Mailler et al. 2015).Considering the individual results of the micropollutants, this positive 270
influence of the dose is statistically significant (test of Shapiro-Wilk, Fischer and Student - p-value < 0.05) between 5 and 271
10 mgPAC/L (p-value = 0.016) and between 10 and 20 mgPAC/L (p-value = 0.0005). 272
273
Furthermore, the removals notably increase with the contact time (Figure 2), i.e. ciprofloxacin (29-40-62-66-71%; 274
removals at 5-10-30-45-60 min contact times) or diclofenac (19-23-32-36-39%). However, the PAC is very fine (< 50 275
µm), resulting in a relatively fast adsorption kinetic. As a consequence, although the equilibrium is not reached after 60 276
min, differences of removal between 30, 45 and 60 min contact time for a same PAC dose are limited (< 10%) indicating 277
the proximity of the equilibrium. Thus, the short contact times (30-60 min) employed in PAC tertiary treatments are 278
suitable for an efficient adsorption of micropollutants. For several compounds (8/15), such as atrazine (26-46%; removals 279
after 5 and 60 min), norfloxacin (38-71%), ofloxacin (39-64%) or sulfamethoxazole (40-55%), the removal achieved after 280
5 min represents more than half of the removal after 60 min, confirming the very fast kinetic. In contrary, erythromycin 281
(7-39%) or roxithromycin (3-38%) seem to have slower kinetics, probably because of their high molecular weight. These 282
compounds will then be more sensitive to changes of contact time in adsorption processes. 283
284
2.2. Influence of the matrix 285
2.2.1. Dissolved organic carbon
286 287
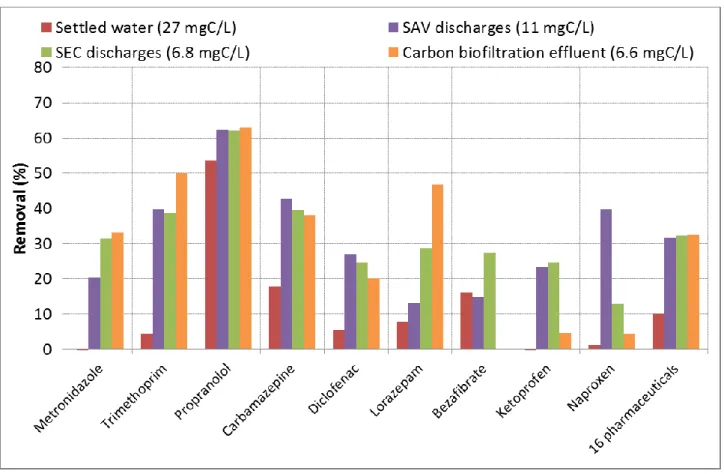
The Figure 3 displays the removals of micropollutants observed with different types of wastewater, sorted from the highest 288
to the lowest DOC value. 289
291
Figure 3 - Pharmaceuticals removals by PAC adsorption from different types of wastewater
292 293
Removals observed with the SEC settled water are overall lower than those from the three other wastewaters. In particular, 294
they are significantly lower (p-value = 0.001) than in the SEC discharges (water from the same WWTP), considering all 295
the compounds displayed on Figure 3. Comparable removals are overall achieved with the 3 other waters, which have 296
undergone an intense biological carbon treatment. For instance, the carbamazepine is removed at 18% in SEC settled 297
water, against 38 to 42% in the other matrixes. Similarly, the trimethoprim removal increases from 5% in settled water to 298
39-50% in the other waters. 299
300
These results indicate that DOC value has a negative impact on micropollutant adsorption, as the removals observed in 301
the SEC settled water, featuring the highest DOC concentration (27 mgC/L), are the lowest compare to the other waters. 302
The negative influence of DOC on micropollutant adsorption from wastewater was also observed in the literature (de 303
Ridder et al. 2011; Margot et al. 2013; Altmann et al. 2014). In contrary, DOC value seems to have a limited impact on 304
propranolol behavior, a compound which is easily adsorbed by activated carbon as positively charged (Mailler et al. 305
2015). 306
307
According to what is previously stated, micropollutant removals should be lower in SAV discharges compared to those 308
in the SEC carbon biofiltration effluent and discharges, regarding the differences of DOC (11 vs. 6.6-6.8 mgC/L). This is 309
observed for bezafibrate, lorazepam and metronidazole. However, removals are similar for the other compounds, in spite 310
of slightly higher influent concentrations in the SAV discharges. Besides, considering the individual removals of 311
compounds from Figure 3, the removals from SEC and SAV discharges are significantly similar (p-value = 0.175). The 312
organic matter of SAV discharges should then be less competitive than organic matter from other discharges, what 313
counterbalances the higher DOC. 314
This result indicates that the sole DOC level isn’t sufficient to explain the variations of removals from water to water, the 315
organic matter composition and nature have also to be considered. Considering that, the DOM nature and adsorption was 316
assessed before and after contact with PAC for these 4 waters, as well as 3 additional wastewater matrixes. 317
318
2.2.2. Composition and adsorption of the organic matter
319 320
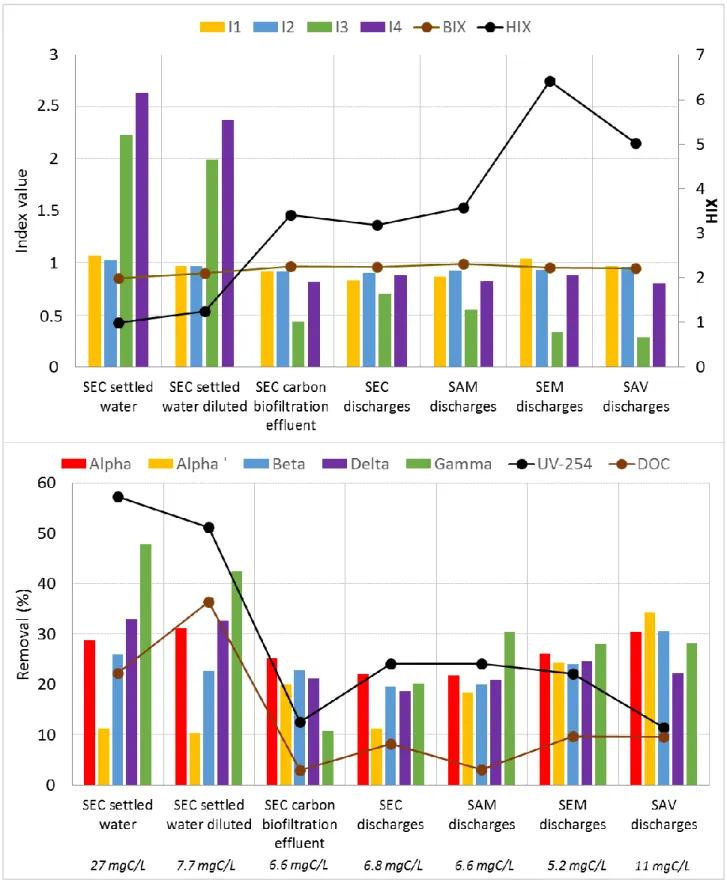
Figure 4 displays the composition (indexes from 3D fluorescence analysis) of the organic matter from 7 wastewater 321
matrixes, as well as the organic matter removal by PAC adsorption (10 mgPAC/L - 45 min). 322
324
Figure 4 - DOM adsorption and distribution using the defined indexes for the different studied wastewaters
325 326
First of all, the 4 WWTP discharges (SEC, SAM, SEM and SAV) and the SEC carbon biofiltration effluent have a similar 327
distribution of DOM with a large fraction of humic-like organic matter (peaks α, α’ and β; indexes I1 and I2), and a 328
smaller fraction of organic matter resulting from bacterial activity (γ and δ; I3 and I4), as shown on Figure 4 and in Table 329
1. In contrary, the DOM distribution is different in the SEC settled water with very high I3 and I4 indexes, characterizing 330
protein molecules, compared to I1 and I2 indexes, characterizing the humic-like substances. This indicates that carbon 331
biological treatments significantly remove DOC and fluorophores δ and γ (see SEC settled water and carbon biofiltration 332
effluent in Table 1), resulting in a significant modification of the DOM distribution (Figure 4). Together with this 333
difference of DOM composition, the SEC settled water has higher DOC (27 mgC/L) and UV-254 (0.859 cm-1) values,
334
highlighting a higher quantity of DOM. 335
In addition, the HIX increases along the different steps of wastewater treatment, as shown by the low HIX in the SEC 336
settled water (1.0) and the higher HIX after the biological treatments (> 3).This suggests that small protein molecules (δ 337
and γ) are transformed into humic-like substances (α, α’ and β) during biological treatments, explaining the HIX increase. 338
The HIX from SAM and SEC discharges, as well as SEC carbon biofiltration effluent, are similar (3.2-3.6), while those 339
from SAV and SEM discharges are higher (5.0-6.4), resulting from higher hydraulic retention times. 340
341
Regarding the removal of DOM by activated carbon, DOC and UV-254 removals are notably higher in the SEC settled 342
water compared to the other ones. This is consistent as DOC and UV-254 are much higher in this water. This suggests 343
that in this water, less sites will be available for micropollutants as more DOM is sorbed, what is consistent with 344
micropollutants results (Figure 3). For the other wastewaters, the DOM removal is rather comparable (10-25% for DOC 345
and 5-10% for UV-254). 346
In addition, fluorophores removals are rather similar in all wastewaters except in the SEC settled water. In the WWTP 347
discharges, all the fluorophores are removed between 10 and 30%. In contrary, in SEC settled water, fluorophores δ and 348
γ are predominant (I3 and I4) and are better removed (35-50%) than the other fluorophores. They are also better removed 349
than in the other water. In consequence, these fluorophores will have the highest impact on the competition with 350
micropollutants for adsorption. This is consistent with the study of (de Ridder et al. 2011) which identified the small size 351
DOM as the most competing ones for adsorption. Moreover, the fluorophores removal pattern is the same in SEC diluted 352
settled water, confirming that the distribution of DOM is as important in the adsorption process as the DOC value. 353
354
In this context, and considering that the carbon biological treatment significantly reduces the DOC and the quantity of 355
fluorophores δ and γ (the most competing DOM), the lower removals of micropollutants by PAC in the SEC settled water 356
compared to the other waters are then consistent. Indeed, the competition is stronger in this water resulting from i) a 357
higher quantity of DOM (DOC and UV-254) and ii) a different DOM distribution, with more small protein-like substances 358
and less humic-like substances. In addition, I3 and I4 are lower in the SAV discharges than in SEC carbon biofiltration 359
effluent and discharges, together with a higher HIX. This means that this water has less very competitive DOM what 360
counterbalances the higher DOC, resulting in similar micropollutants removals. 361
362
It can be concluded that, besides a low DOC, low I3 and I4 indexes, together with a high HIX, are positive for the 363
minimization of DOM competition during the micropollutants adsorption. 364
365
2.2.3. Presence and concentration of methanol
366 367
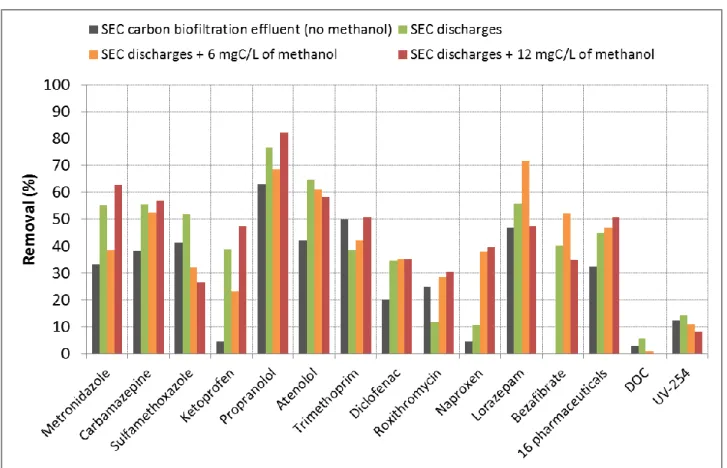
The micropollutant and organic matter removals obtained in presence of a residual concentration of methanol are 368
presented in Figure 5. 369
370
371
Figure 5 - Impact of a residual concentration of methanol in the WWTP discharges on the adsorption of
372
pharmaceuticals by PAC
373 374
The comparison of removals obtained in the carbon biofiltration effluent and in the SEC discharges allows assessing the 375
impact of the methanol presence in the wastewater on the PAC adsorption (Figure 5). Its presence doesn’t decrease the 376
performances as the removals observed in the SEC discharges are similar or higher than those in the carbon biofiltration 377
effluent. The better removals in the SEC discharges could be explained i) by the methanol itself, and ii) by the carbon and 378
nitrogen treatment achieved in the second and third biofiltration stages. but further experiments are needed to bring an 379
answer. 380
Moreover, no clear trend is observed between the increase of the residual concentration of methanol and the 381
micropollutant removals, except for sulfamethoxazole and naproxen for which the removal decrease and increase 382
respectively. However, the results indicate that the increase of the methanol concentration doesn’t lead to a significant 383
degradation of the PAC performances for most compounds. 384
385
Thus, results have shown that the residual concentration of methanol doesn’t affect negatively the removal of 386
micropollutants by activated carbon (Figure 5). In contrary, its presence in biological treatment effluents could favor a 387
biological activity in the tertiary treatments by activated carbon. 388
389
2.2. Influence of the injection of FeCl3
390 391
The ferric chloride influence on the fate of micropollutants in presence of PAC is illustrated on figure 7. 392
393
Figure 6 - Influence of the presence of FeCl3 on the pharmaceuticals removals by PAC adsorption
395 396
Three types of behaviors are observed for micropollutants. For most compounds, such as carbamazepine, beta blockers 397
or diclofenac, and for DOM (DOC and UV-254), a slightly higher removal (+ 5-15%) is obtained by coupling PAC and 398
ferric chloride, probably by coagulation of the colloidal fraction. These differences are not significant taking uncertainties 399
into account, but 10 compounds in 13, as well as DOC and UV-254, have a greater removal in presence of FeCl3. In
400
contrary, no clear influence is observed for lorazepam and bezafibrate. Finally, sulfamethoxazole seems to be the only 401
one with a lower removal (- 30%) in presence of ferric chloride. 402
(Margot et al. 2013) also observed a positive effect of the coagulant on micropollutant removals. However, the mechanism 403
at the origin of this improvement is not identified. Supplementary tests are required to determine if coagulation, 404
complexation or direct decrease of the competition with organic matter are involved. 405 406 407 CONCLUSIONS 408 409
The Parisian public sanitation service (SIAAP) and the Water Environment and Urban Systems laboratory (LEESU) study 410
the CarboPlus® process at large scale, in collaboration with the SAUR teams. In parallel to the study of the large scale 411
pilot, complementary laboratory scale experiments were carried out to improve the understanding of the micropollutants 412
adsorption on activated carbon, in particular PAC. 413
414
These experiments allowed displaying the links between structural properties of activated carbons and their efficiency to 415
remove micropollutants. In particular, it has been shown that the PAC performances are closely related to the specific 416
BET surface, which can easily be estimated through the bulk density measure. 417
418
The strong influence of the PAC dose has also been confirmed, as well as the suitability of the adsorption kinetic (less 419
than one hour) for WWTP application (operational requirements). In an operational point of view, the injection of FeCl3
420
doesn’t disrupt the adsorption process. A slight improvement is even observed for most compounds (+ 10-15%), except 421
for sulfamethoxazole, probably through coagulation of the colloidal fraction of the DOM. In contrary, the residual 422
concentration of methanol present in the WWTP discharges due to the post denitrification process seems to have no 423
impact on the fate of most pharmaceuticals. 424
Then, this study highlighted the differences of micropollutants adsorption in the various wastewater matrixes. The DOC 426
concentration is important considering the competition of adsorption but it isn’t always sufficient to explain the 427
performances reductions from water to water. It has been shown that the distribution of the different molecular 428
components of the DOM should be considered in addition to the quantity of DOM. Indeed, small protein-like fluorophores 429
have been identified as the most problematic for adsorption competition in wastewater, while a high HIX, highlighting 430
the humification of the DOM, is favorable to micropollutants adsorption. The reduction of protein-like substances in 431
wastewater is then a way to maximize the adsorption of micropollutants by activated carbon. 432 433 434 ACKNOWLEDGEMENT 435 436
This study has been performed within the framework of the OPUR research program. The authors would like to thank 437
Benjamin Cassier and Mélanie Gobin, as well as the SIAAP (Céline Briand), the SAUR (Séverine Bareilles), the ISA 438
(Antoine Vauchez, Mikaël Tournier, Florent Lafay and Loic Spinner), the LEESU and UTC teams for their technical 439
support and their active participation to the sampling campaigns and analyses. 440
REFERENCES 441
442
Abegglen C. and Siegrist H. (2012). Micropolluants dans les eaux résiduaires 443
urbaines. Etapes de traitement supplémentaire dans les stations
444
d'épuration. (in French).
445
Altmann J., Ruhl A. S., Zietzschmann F. and Jekel M. (2014). Direct comparison 446
of ozonation and adsorption onto powdered activated carbon for 447
micropollutant removal in advanced wastewater treatment. Water Research 448
55(0), 185-93.
449
Baudu M., Guibaud G., Raveau D. and Lafrance P. (2001). Prediction of Adsorption 450
from Aqueous Phase of Organic Molecules as a Function of Some 451
Physicochemical Characteristics of Activated Carbons. Water Quality 452
Research 36(4), 631-57.
453
Boehler M., Zwickenpflug B., Hollender J., Ternes T., Joss A. and Siegrist H. 454
(2012). Removal of micropollutants in municipal wastewater treatment 455
plants by powder-activated carbon. International Water Association,
456
London, Royaume-Uni. 457
Çeçen F. and Aktas Ö. (2012). Activated carbon for water and wastewater 458
treatment integration of adsorption and biological treatment. Wiley-VCH,
459
Weinheim, Germany. 460
de Ridder D. J., Verliefde A. R., Heijman S. G., Verberk J. Q., Rietveld L. C., 461
van der Aa L. T., Amy G. L. and van Dijk J. C. (2011). Influence of 462
natural organic matter on equilibrium adsorption of neutral and charged 463
pharmaceuticals onto activated carbon. Water Sci Technol 63(3), 416-23. 464
de Ridder D. J., Villacorte L., Verliefde A. R. D., Verberk J. Q. J. C., Heijman 465
S. G. J., Amy G. L. and van Dijk J. C. (2010). Modeling equilibrium 466
adsorption of organic micropollutants onto activated carbon. Water 467
Research 44(10), 3077-86.
468
Delgado L. F., Charles P., Glucina K. and Morlay C. (2012). The removal of 469
endocrine disrupting compounds, pharmaceutically activated compounds and 470
cyanobacterial toxins during drinking water preparation using activated 471
carbon----A review. Science of the Total Environment 435--436(0), 509-25.
472
Ebie K., Li F., Azuma Y., Yuasa A. and Hagishita T. (2001). Pore distribution 473
effect of activated carbon in adsorbing organic micropollutants from 474
natural water. Water Research 35(1), 167-79. 475
Hudson N., Baker A. and Reynolds D. (2007). Fluorescence analysis of dissolved 476
organic matter in natural, waste and polluted waters----a review. River 477
Research and Applications 23(6), 631-49.
478
Li L., Quinlivan P. A. and Knappe D. R. U. (2002). Effects of activated carbon 479
surface chemistry and pore structure on the adsorption of organic 480
contaminants from aqueous solution. Carbon 40(12), 2085-100. 481
Loos R., Carvalho R., António D. C., Comero S., Locoro G., Tavazzi S., 482
Paracchini B., Ghiani M., Lettieri T., Blaha L., Jarosova B., Voorspoels 483
S., Servaes K., Haglund P., Fick J., Lindberg R. H., Schwesig D. and 484
Gawlik B. M. (2013). EU-wide monitoring survey on emerging polar organic 485
contaminants in wastewater treatment plant effluents. Water Research 486
47(17), 6475-87.
487
Mailler R., Gasperi J., Coquet Y., Deshayes S., Zedek S., Cren-Olivé C., 488
Cartiser N., Eudes V., Bressy A., Caupos E., Moilleron R., Chebbo G. and 489
Rocher V. (2014a). Study of a large scale powdered activated carbon pilot: 490
Removals of a wide range of emerging and priority micropollutants from 491
wastewater treatment plant effluents. Water Research(0). 492
Mailler R., Gasperi J., Coquet Y., Deshayes S., Zedek S., Cren-Olivé C., 493
Cartiser N., Eudes V., Bressy A., Caupos E., Moilleron R., Chebbo G. and 494
Rocher V. (2015). Study of a large scale powdered activated carbon pilot: 495
Removals of a wide range of emerging and priority micropollutants from 496
wastewater treatment plant effluents. Water Research 72(0), 315-30. 497
Mailler R., Gasperi J., Rocher V., Gilbert-Pawlik S., Geara-Matta D., Moilleron 498
R. and Chebbo G. (2014b). Biofiltration vs conventional activated sludge 499
plants: what about priority and emerging pollutants removal? Environmental 500
Science and Pollution Research 21(8), 5379-90.
501
Margot J., Kienle C., Magnet A., Weil M., Rossi L., de Alencastro L. F., 502
Abegglen C., Thonney D., Chèvre N., Schärer M. and Barry D. A. (2013). 503
Treatment of micropollutants in municipal wastewater: Ozone or powdered 504
activated carbon? Science of the Total Environment 461--462(0), 480-98.
505
Matsui Y., Fukuda Y., Inoue T. and Matsushita T. (2003). Effect of natural 506
organic matter on powdered activated carbon adsorption of trace 507
contaminants: characteristics and mechanism of competitive adsorption. 508
Water Research 37(18), 4413-24.
Miège C., Choubert J. M., Ribeiro L., Eusèbe M. and Coquery M. (2009). Fate of 510
pharmaceuticals and personal care products in wastewater treatment plants 511
-- Conception of a database and first results. Environmental Pollution 512
157(5), 1721-6.
513
Newcombe G., Morrison J., Hepplewhite C. and Knappe D. R. U. (2002). 514
Simultaneous adsorption of MIB and NOM onto activated carbon: II. 515
Competitive effects. Carbon 40(12), 2147-56. 516
Parlanti E., Morin B. and Vacher L. (2002). Combined 3D-spectrofluorometry, high 517
performance liquid chromatography and capillary electrophoresis for the 518
characterization of dissolved organic matter in natural waters. Organic 519
Geochemistry 33(3), 221-36.
520
Rocher V., Paffoni C., Goncalves A., Guerin S., Azimi S., Gasperi J., Moilleron 521
R. and Pauss A. (2012). Municipal wastewater treatment by biofiltration: 522
comparisons of various treatment layouts. Part 1: assessment of carbon and 523
nitrogen removal. Water Science and Technology 65(9), 1705-12. 524
Ruel S. M., Choubert J. M., Budzinski H., Miege C., Esperanza M. and Coquery M. 525
(2012). Occurrence and fate of relevant substances in wastewater treatment 526
plants regarding Water Framework Directive and future legislations. Water 527
Science and Technology 65(7), 1179-89.
528
Snyder S. A., Adham S., Redding A. M., Cannon F. S., DeCarolis J., Oppenheimer 529
J., Wert E. C. and Yoon Y. (2007). Role of membranes and activated carbon 530
in the removal of endocrine disruptors and pharmaceuticals. Desalination 531
202(1--3), 156-81. 532
Ternes T. A., Meisenheimer M., McDowell D., Sacher F., Brauch H.-J., Haist-Gulde 533
B., Preuss G., Wilme U. and Zulei-Seibert N. (2002). Removal of 534
Pharmaceuticals during Drinking Water Treatment. Environmental Science & 535
Technology 36(17), 3855-63.
536
Verlicchi P., Al Aukidy M. and Zambello E. (2012). Occurrence of pharmaceutical 537
compounds in urban wastewater: Removal, mass load and environmental risk 538
after a secondary treatment----A review. Science of the Total Environment 539
429(0), 123-55.
540
Yu Z., Peldszus S. and Huck P. M. (2008). Adsorption characteristics of selected 541
pharmaceuticals and an endocrine disrupting compound----Naproxen, 542
carbamazepine and nonylphenol----on activated carbon. Water Research 42(12), 543
2873-82. 544
Zietzschmann F., Altmann J., Ruhl A. S., Dünnbier U., Dommisch I., Sperlich A., 545
Meinel F. and Jekel M. (2014). Estimating organic micro-pollutant removal 546
potential of activated carbons using UV absorption and carbon 547
characteristics. Water Research 56(0), 48-55. 548
Zsolnay A., Baigar E., Jimenez M., Steinweg B. and Saccomandi F. (1999). 549
Differentiating with fluorescence spectroscopy the sources of dissolved 550
organic matter in soils subjected to drying. Chemosphere 38(1), 45-50. 551
552 553