HAL Id: ird-01224737
https://hal.ird.fr/ird-01224737
Submitted on 5 Nov 2015
HAL is a multi-disciplinary open access archive for the deposit and dissemination of sci-entific research documents, whether they are pub-lished or not. The documents may come from teaching and research institutions in France or abroad, or from public or private research centers.
L’archive ouverte pluridisciplinaire HAL, est destinée au dépôt et à la diffusion de documents scientifiques de niveau recherche, publiés ou non, émanant des établissements d’enseignement et de recherche français ou étrangers, des laboratoires publics ou privés.
Modelling temperature-dependent bionomics of Bemisia
tabaci (Q-biotype)
Olivier Bonato, Amandine Lurette, Claire Vidal, J. Fargues
To cite this version:
Olivier Bonato, Amandine Lurette, Claire Vidal, J. Fargues. Modelling temperature-dependent bio-nomics of Bemisia tabaci (Q-biotype). Physiological Entomology, Wiley, 2007, 32 (1), pp.50-55. �ird-01224737�
Modelling temperature-dependent bionomics of Bemisia tabaci
(Q-1
biotype)
2 3
OLIVIER BONATO1, AMANDINE LURETTE, CLAIRE VIDAL and JACQUES
4
FARGUES 5
IRD-INRA Centre for Biology and Management of Populations (CBGP), Montferrier / 6
Lez cedex, France 7
8
Abstract
9
The influence of temperature (17, 21, 25, 30 and 35°C) on life history traits of a Q-10
biotype Bemisia tabaci population on tomato is studied. Temperature dependent 11
relationships are characterized for immature developmental rate, immature survival, 12
fecundity, longevity and intrinsic rate of increase. Development time vary from 20 13
days at 30°C to 56 days at 17°C and the lowest thermal threshold is estimated at 14
10.2°C. The optimal temperature for immature development is 32.5°C. Total 15
fecundity (eggs per female) ranges from 105.3 (at 21°C) to 41 (at 35°C). The 16
longevity decreases with temperature increase. The intrinsic rate of increase ranges 17
from 0.0450 (at 17°C) to 0.123 (at 30°C). The functional relationships between 18
temperature and life-history parameters are used to evaluate the effect of temperature 19
on the population dynamics. Such mathematical relationships could provide a basis 20
for future development of population models. 21
22
Key words
23
Temperature, bionomics, Bemisia tabaci, Q biotype, modelling 24 25 Introduction 26 27
The sweetpotato whitefly, Bemisia tabaci (Gennadius) (Hemiptera: Aleyrodidae) is 28
one of the most serious agricultural pest on tomato Lycopersicum esculentum (Mill) 29
and other horticultural crops in tropical and subtropical temperature regions world-30
wide. Damage may be caused directly by feeding on phloem or deposition of 31
honeydew, or indirectly by transmitting different types of plant viruses, such as the 32
tomato yellow leaf curl virus (Oliveira et al., 2001), to a wide range of vegetable 33
crops. The potential of B. tabaci to develop resistance in response to intensive use of 34
pesticides has led to studies on integrated pest management strategies in which 35
biological control plays a central role, and significant advances have been made in 36
developing and implementing management systems (Gerling & Mayer, 1996; 37
Naranjo, 2001). As a general rule, any pest management programme should be based 38
on adequate knowledge of the main factors responsible for changes in population 39
dynamics. Life history parameters estimated under different biotic or abiotic 40
conditions provide the basic tools for among others, understanding changes in the 41
status of pest species (Poole, 1974; Dempster, 1975; Krebs, 1978; Southwood, 1978). 42
Because B. tabaci is a poikilothermic organism i.e. temperature influences the life 43
table components, it is important to take this factor into consideration in explaining 44
population ecology. A review by Drost et al. (1998) reported that biological 45
parameters of B. tabaci have been characterized for different temperatures, host 46
plants and biotypes. Among this vast amount of literature, the most complete work is 47
probably that of Wang & Tsai (1996) concerning B-biotype reared on aubergine. 48
The Q-biotype of B. tabaci was first characterized in samples collected in the south 49
of Spain and Portugal (Guiro et al., 1997). Successive surveys showed that this 50
biotype is also present in Tunisia (Chermitti et al., 1997), Morocco (Monci et al., 51
2000), Egypt (De Barro et al., 2000), Israel (Horowitz et al. 2003) and southern Italy 52
(Demichelis et al., 2000; Simón et al., 2003). Because of its high degree of 53
polyphagy and its ability to transmit a relatively wide range of plant viruses, the Q-54
biotype is considered as a particularly dangerous biotype (Muñiz, 2000; Navas-55
Castillo et al., 2000). In spite of the wide distribution of the Q-biotype in the 56
Mediterranean basin, no complete published work is available currently on its life-57
history parameters in relation to temperature when reared on tomato. The aim of the 58
present study was to characterize and analyze functional relationships between 59
temperature and life-history parameters and to evaluate the effect of temperature on 60
the dynamics of Q-biotype populations. 61
62
Materials and methods
63 64
Whitefly source and host plant production 65
66
In 2002, founders of Bemisia tabaci of the Q biotype were collected from a 67
greenhouse of tomato crop located in Alenya in the South of France (42°38’N; 68
2°58’E). The stock colony was reared and maintained on tomato plants of the cv 69
Hilario® (Royal Sluis, Enkhuizen, The Netherlands) in plastic cages placed in 70
climatic chambers at 25 ± 1°C, and 60 ± 5% RH. Experiments were carried out using 71
progeny after more than 3 generations on Hilario. 72
Development of immatures 74
75
Young adults of B. tabaci (150 pairs: male and female) were placed in cubic 76
screened cages (50 x 50 x 50cm) each containing a young potted tomato plant. The 77
cages containing adults were maintained in a growth chamber at 25 ± 1°C, 60 ± 5% 78
RH in a LD 14:10 h photocycle. Whitefly adults were given 3 h to lay eggs. The 79
adults were then removed, leaves were observed under a stereo-microscope at 36X 80
magnification. Two eggs on the abaxial surface of 5 leaves were kept and excess 81
eggs were killed using an insect pin. Plants were then placed in growth chambers set 82
at 5 constant temperatures: 17, 21, 25, 30 and 35°C with six replicates. Once the eggs 83
hatched and the crawlers fixed on the leaf, young nymphs were identified 84
individually. Each nymph was observed daily until adult emergence, and the 85
transition from one stage to another was noted. Differences between developmental 86
times were tested by one-way ANOVA and means were separated by Newman– 87
Keuls test (α=0.05). Statistical analyses were performed using XlStat 7.1 88
(Addinsoft). The influence of temperature (T) on developmental rate was described 89
by the model proposed by Logan et al. (1976): 90 Tm T p Ti Tm p Ti T p p DR 3 1 2 exp 2 exp 1 91
where DR is the development rate which is the reciprocal of development time, Ti is 92
the lower temperature tested and Tm is the upper threshold derived from the 93
observations. The parameters, p1, p2 and p3 were estimated by regression. The 94
lowest thermal threshold for development (LTT) was calculated by the ratio: LTT = 95
a/b, a and b were determined by linear regression of the equation DR = a +bT, for 96
temperature (T) interval over which the relation was linear. 97
273 6 5 exp 273 4 3 exp 1 273 2 1 exp 273 T p p T p p T p p T SI
Differences between survival rates were tested using 2
test (=0.05). The
98
relationship between temperature (T) and immature survival rate was described by 99
the Curry & Feldman (1987) model: 100 101 102 103 104 105
Where SI is survival of immatures, T is temperature in °C, and p1 to p6 are 106
regression coefficients. 107
108
Reproductive capacity and female longevity 109
110
One newly emerged (<24 h) female and two males were placed in a clip-cage on the 111
abaxial surface of new leaflets. For each temperature tested, 30 clip-cages were kept 112
in growth chambers (60± 1% RH, LD 14:10h photocycle). The clip-cages with 113
insects were moved to new leaves daily and the number of eggs laid per female was 114
counted until death of the female. Differences in fecundity and female longevity 115
were compared with ANOVA followed by a Newman–Keuls tests (α=0.05). 116
Exponential functions were used to describe the influence of temperature on total 117
fecundity and longevity. 118 Fecundity: 119
T p T
p EN 1 ( p2)exp 3 120 121Where EN is total number of eggs laid per female; T is temperature in °C; and p1, 122
p2, p3 are regression coefficients. 123 124 Longevity: 125 p p T L exp 1 2 126 127
Where L is longevity per female in days; T is temperature in °C; and p1, p2: are 128 regression coefficients. 129 130 Demographic parameters 131 132
The net reproductive rate (R0), the mean generation time (G), the intrinsic rate of
133
natural increase (rm) and the finite rate of increase (λ) were determined using the
134
program developed by Hulting et al. (1990) in which the parameters are calculated 135
using the method recommended by Birch (1948). The program, based on Jacknife’s 136
procedures, gives a variance and hence a standard error to each parameter calculated 137
enabling statistical comparison of values (Meyer, 1986). The relationship between rm
138
and temperature was also described using the Logan et al. (1976) model (see above). 139 140 Results 141 142 Development of immatures 143 144
B. tabaci required 56 days at 17°C to complete its development from egg to adult, 145
but only 20 days at 35°C (Table 1). Between 17 and 30°C, the developmental time 146
was negatively correlated with temperature, but no significant difference was found 147
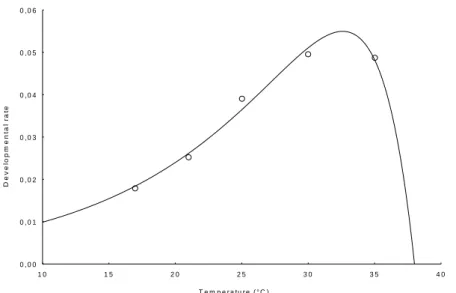
between 30 and 35°C (P>0.05). Values of Logan equation parameters were p1 = 148
0.0115, p2 = 0.0921, p3 = 0.3133 (R²= 0.92, P<0.01). Between 17 and 30°C, the 149
relation was linear and the LTT was estimated at 10.2°C (Fig. 1). The optimal 150
temperature for development, calculated from the derivative Logan equation, was 151
32.5°C. 152
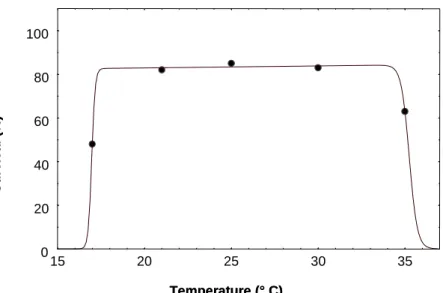
Survival rates at 21, 25 and 30°C (Table 2) were not significantly different 153
(χW²=0.695, P=0.707) even if the highest percentage was measured at 25°C.
154
Temperature of 17°C had the greatest effect on immature development especially in 155
the 4th stadium. The curve obtained by fitting the Curry & Feldman model to the data
156
(p1= -6.55, p2= -200.18, p3= -2986.08, p4= 865870, p5= 1353.19, p6= 6417118, 157
R²=0.99, P <0.01) described the influence of temperature very well and indicated that 158
17 and 35°C were close to the lower and upper thermal limits, respectively (Fig. 2). 159
160
Longevity and reproductive capacity of females 161
162
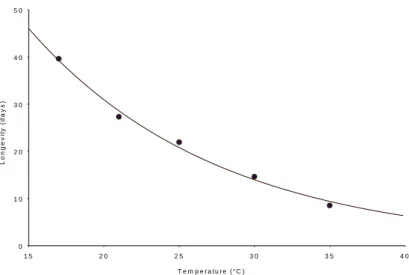
Temperature had a significant effect on the fecundity and longevity of females. 163
Longevity was negatively correlated with temperature. The longest life was recorded 164
at 17°C and the shortest at 35°C (Table 3). The pre-oviposition period was very short 165
(less than 24h) for almost all females tested and oviposition period was close to 166
longevity for the 5 temperatures tested. The relation between temperature and female 167
longevity (Fig. 3) was very well described by the exponential function (p1= 5.02, 168
p2=-0.079, R²=0.99, P <0.01). 169
Except for 17°C, fecundity followed the same trend as longevity, i. e., was negatively 170
correlated with temperature. Figure 4 shows the influence of temperature on 171
fecundity (p1= 9.9e-11, p2=12.8, p3=0.54, R²=0.89, P<0.01). Our results showed 172
that optimal fecundity was obtained from temperatures ranging between 21 and 173
25°C. The sex-ratio calculated for each treatment was not significantly different than 174 50% (P>0.05). 175 176 Demographic parameters 177 178
Parameters were calculated with the sex-ratio of B. tabaci set to 0.5. At the five 179
temperatures tested, the highest rate of increase (rm) was obtained at 30°C and the
180
lowest at 17°C (Table 4). At 25, 30 and 35°C, the rates of increase were not 181
significantly different (P>0.05). The net reproductive rate was lower at 17°C and 182
35°C indicating the proximity of lower and upper thermal thresholds, respectively. 183
The curve (Fig.5) obtained by fitting the Logan model (p1 = 0.019. p2 = 0.099. p3 = 184
0.331. R²= 0.99, P<0.01)) describes the influence of temperature on the rate of 185
natural increase very well. The optimal temperature for population development, 186
calculated from the derivative Logan equation was 31.3°C. 187
Discussion
188
Based on biological and ecological information published in the two last decades, the 189
immature developmental time of B. tabaci (from egg to adult) depends on the host 190
plant (Coudriet et al. 1985; Van Lenteren & Noldus, 1990; Bethke et al., 1991; 191
Zalom et al., 1995; Tsai & Wang, 1996; Muñiz & Nombela, 1997; Nava-Camberos 192
et al., 2001) as well as on the whitefly populations or biotypes (Drost et al., 1998; 193
Muñiz, 2000; Muñiz & Nombela, 2001). The developmental time of B. tabaci 194
recorded at 25°C ranges from 17.3 to 22.8 days when reared on either aubergine, 195
tomato, sweet potato, cucumber, bean or pepper. The present results show that on 196
tomato, the population of Q-biotype B. tabaci newly introduced in southern France 197
require 25.6 days to complete development from egg to adult at 25°C. In contrast, 198
Tsai & Wang (1996) report a shorter developmental time (17.96 days) for a Floridian 199
B. argentifolii population on tomato (cultivar Suny Hybrid) at 25°C. Based on the 200
model of Logan et al. (1976), the optimal temperature for the development of 201
immatures (32.5°C) is higher than that calculated for Florida, Mississipi, and Arizona 202
populations of B. argentifolii (29.9, 28.2, and 30.0°C, respectively) on aubergine 203
(Wang & Tsai, 1996). The optimum for B. tabaci biotypes on all host plants tested 204
ranges from 30 to 33°C (Drost et al., 1998). The developmental threshold for 205
immatures belonging to the population studied here, estimated at 10.2°C, is lower 206
than that reported in the literature, which ranges from 10.8°C (Von Arx et al., 1983) 207
to 12.5°C (Wang & Tsai, 1996). 208
Based on the range of temperatures tested here, survival rates of immature stages of 209
B. tabaci from egg to adult are higher on the tomato cultivar Hilario than those 210
reported on other cultivars of tomato (Tsai & Wang, 1996), Poinsettia (Enkegaard, 211
1993) and cotton (Wagner, 1995). Different responses to extreme temperatures, i.e. 212
in mortality of immatures, suggest that the Q-biotype population on tomato is more 213
tolerant to high temperatures (>33°C) than diverse B. tabaci populations on 214
aubergine (Wang & Tsai, 1996), cotton, and Poinsettia (Drost et al., 1998). 215
Fecundity of B. tabaci is generally highly variable and depends on temperature 216
(Enkegaard, 1993), host-plant species (Liu & Oetting, 1994), and cultivar (Navon et 217
al., 1991). Thus, the total number of eggs laid at 25°C by a Q-biotype female reared 218
on tomato cv Hilario (94.2 eggs) is considerably lower than that reported in the 219
literature for females reared on aubergine (223.67) (Wang & Tsai, 1996) and tomato 220
cv Suny Hybrid (165.55) (Tsai & Wang, 1996). 221
Wang & Tsai (1996) underline the importance of life table parameters to compare B. 222
tabaci populations and biotypes. On aubergine these authors (Wang & Tsai, 1996) 223
find a high intrinsic rate of increase at 25°C (0.192), 27°C (0.191), and 30°C (0.169) 224
compared with that found with the Q-biotype population on tomato at 25°C (0.106) 225
and 30°C (0.123). However, at 35°C, the net rate of increase of the B-biotype (0.073) 226
is lower than that of the French Q-biotype population (0.104). The tolerance to 227
extreme thermal conditions of the population newly introduced in France is also 228
confirmed by its shortest mean generation time recorded at 35°C (24.6 days). 229
The comparison between the results of this work and those from other studies (Wang 230
& Tsai, 1996; Muñiz & Nombela, 1996, 2001; Drost et al., 1998; Nombela et al., 231
2000, Muñiz, 2000) demonstrates clearly that the relationship between life-history 232
parameters and temperature is influenced highly by both insect biotype and host 233
plant species and variety. In spite of this high degree of variability within the Bemisia 234
complex, it is essential to better understand the population dynamics of the newly 235
introduced pest population in relation to temperature to improve control strategies 236
and evaluate its geographical extension capacity. 237
238
References
239 240
Arx, R. von, Baumgärtner, J. & Delucchi, V. (1983) A model to simulate the 241
population dynamics of Bemisia tabaci Genn (Homoptera: Aleyrodidae) on 242
cotton in the Sudan Gezira. Zeitschrift für Angewandte Entomologie, 96, 341-243
363. 244
Bethke J.A., Paine, T.D. & Nuessly, G.S. (1991) Comparative biology, 245
morphometrics, and development of two populations of Bemisia tabaci 246
(Homoptera: Aleyrodidae) on cotton and poinsettia. Annals of Entomological 247
Society of America, 84, 407-411. 248
Chermitti, B., Braham, M., Alonso, C., Beitia, F. & Cenis, J.L. (1997) Sur la 249
présence en Tunisie des biotypes 'B' et 'non-B' de Bemisia tabaci (Homoptera: 250
Aleyrodidae) et de leurs parasitoides associés. IOBC/ WPRS Bulletin, 20, 108-251
113. 252
Claridge, M.F., Dawah, H.A. & Wilson, M.R. (1997) Species in insect herbivores 253
and parasitoids – sibling species, host races and biotypes. Species, the Units of 254
Biodiversity. (ed. by M.F., Claridge, H.A., Dawah, M.R.,Wilson), pp. 247-272. 255
Chapman & Hall, London. 256
Coudriet, D.L., Prabhaker, N., Kishaba, N. & Meyerdirk, D.E. (1985) Variation in 257
development rate on different hosts and overwintering of the sweetpotato 258
whitefly Bemisia tabaci (Homoptera: Aleyrodidae). Environmental
259
Entomology, 14, 516-519. 260
Curry, G.L. & Feldman, R.M. (1987) Mathematical foundations of population 261
dynamics. Texas A& M University Press, College Station, 246 pp. 262
Dalmon, A., Cailly, M., Bouyer, S., Arnold-Gaulhiac, M., Cailly, A. & Goarant, G. 263
(2003) Emergence de virus transmis par aleurodes dans les cultures de tomate en 264
France. Proceedings of the International Symposium on Greenhouse Tomato: 265
Integrated Crop Protection and Organic Production, CTIFL, Paris, 24-29. 266
De Barro, P.J., Driver, F., Trueman, J.W.H. & Curran, J. (2000) Phylogenic 267
relationship of world populations of Bemisia tabaci (Gennadius) using ribosomal 268
ITS1. Molecular Phylogenetics and Evolution, 16, 29-36. 269
Demichelis, S., Bosco, D., Manino, A., Marian, D. & Caciagli, P. (2000) Distribution 270
of Bemisia tabaci (Hemiptera: Aleyrodidae) biotypes in Italy. Canadian 271
Entomologist, 132, 519-527. 272
Drost, Y.C., van Lenteren, J.C. & van Roermund, H.J.W. (1998) Life-history 273
parameters of different biotypes of Bemisia tabaci (Hemiptera: Aleyrodidae) in 274
relation to temperature and host plant: a selective review. Bulletin of 275
Entomological Research, 88, 219-229. 276
Enkegaard, A. (1993) The poinsettia strain of the cotton whitefly, Bemisia tabaci 277
(Homoptera: Aleyrodidae), biological and demographic parameters on 278
poinsettia (Euphorbia pulcherima) in relation to temperature. Bulletin of 279
Entomological Research, 83, 535-546. 280
Guirao, P., Beitia, F. & Cenis, J.C. (1997) Biotype determination of Spanish 281
populations of Bemisia tabaci (Hemiptera: Aleyrodidae). Bulletin of 282
Entomological Research, 87, 587-593. 283
Horowitz, A.R., Denholm, I., Gorman, K., Cenis, J.L., Kontsedalov, S. & Ishaaya, I. 284
(2003) Biotype Q of Bemisia tabaci identified in Israel. Phytoparasitica, 31, 94-285
98. 286
Hulting, F.L., Orr, D.B. & Obrycki, J.J. (1990) A computer program for calculation 287
and statistical comparison of intrinsic rates of increase and associated life table 288
parameters. Florida Entomologist, 73, 601-612. 289
Liu, T.X. & Oetting, R.D. (1994) Oviposition preference of Bemisia tabaci 290
(Gennadius) on eight species of greenhouse-grown plants. Journal of 291
Agricultural Entomology, 11, 177-179. 292
Logan, J.A., Wollkind, D.J., Hoyt, S.C. & Tanigoshi, L.K. (1976) An analytic model 293
for description of temperature dependent rate phenomena in arthropods. 294
Environmental Entomology, 5, 1133-1140. 295
Lopez-Avila, (1986) Natural ennemies. Bemisia tabaci – a literature survey on the 296
cotton withefly with an annoted bibliography, (ed. by M. J. Cock, M.), 121pp. 297
C.A.B. International Institute of Biological Control, Silwood Park, Ascot, 298
Berks. 299
Meyer, J.S., Ingersoll, C.G., McDonald, L.L. & Boyce, M S. (1986) Estimating 300
uncertainly in population growth rates: jacknife vs. bootstrap techniques. 301
Ecology, 67, 1156-1166. 302
Monci, F., Navas-Castillo, J., Cenis, J.L., Lacasa, A., Benazoun, A. & Moriones, E. 303
(2000) Spread of tomato yellow leaf curl virus-Sar from the Mediterranean basin: 304
presence in the Canary Islands and Morocco. Plant Disease, 84, 490 305
Muñiz, M. (2000) Host suitability of two biotypes of Bemisia tabaci on some 306
common weeds. Entomologia Experimentalis et Applicata, 95, 63-70. 307
Muñiz, M. & Nombela, G. (1997) Development, oviposition and female longevity of 308
two biotypes of Bemisia tabaci (Homoptera: Aleyrodidae) on three varieties of 309
Capsicum annuum L. IOBC/ WPRS Bulletin, 20, 143-146. 310
Muñiz, M. & Nombela, G. (2001) Differential variation in development of the B- and 311
Q-biotypes of Bemisia tabaci on sweet pepper Capsicum annnuum L. at 312
constant temperatures. Environmental Entomology, 30, 720-727. 313
Naranjo, S.E. (2001) Conservation and evaluation of natural enemies in IPM systems 314
for Bemisia tabaci. Crop Protection, 20, 835-852. 315
Nava-Camberos, U., Riley, D.G. & Harris, M.K. (2001) Temperature and host plant 316
effects on development, survival, and fecundity of Bemisia argentifolii 317
(Homoptera: Aleyrodidae). Environmental Entomology, 30, 55-63. 318
Navas-Castillo, J., Camero, R., Bueno, M. & Moriones, E. (2000) Severe yellowing 319
outbreaks in tomato in Spain associated with infections of Tomato chlorosis 320
virus. Plant Disease, 84, 835-837. 321
Navon, A., Melamed, M.V., Zur, M. & Ben, M.E. (1991) Effects of cotton cultivars 322
on feeding of Heliothis armigera and Spodoptera littoralis larvae and on 323
oviposition of Bemisia tabaci. Agriculture, Ecosystems and Environment, 35, 324
73-80. 325
Oliviera, M.R.V., Henneberry, T.J. & Anderson, P. (2001) History, current status, 326
and collaborative research projects for Bemisia tabaci. Crop Protection, 20, 709-327
723. 328
Simón, B., Cenis, J.L., Demichelis, S., Rapisarda, C., Caciagli, P. & Bosco, D. 329
(2003) Survey of Bemisia tabaci (Hemiptera: Aleyrodidae) biotypes in Italy with 330
the description of a new biotype (T) from Euphorbia characias. Bulletin of 331
Entomological Research, 93, 259-264. 332
Tsai, J.H. & Wang, K. (1996) Development and reproduction of Bemisia argentifolii 333
on five host plants. Environmental Entomology, 25, 810-816. 334
Van Lenteren, J.C. & Noldus, L.P.J.J. (1990) Whitefly-plant relationships: 335
behavorial and ecological aspects. Whiteflies: their bionomics, pest status and 336
management, (ed. by D Gerling), pp. 47-89. Intercept, Andover, Hampshire, 337
U.K. 338
Wagner, T.L. (1995) Temperature-dependent development, mortality, and adult size 339
of sweetpotato whitefly biotype B (Homoptera: Aleyrodidae) on cotton. 340
Environmental Entomology, 24, 1179-1188. 341
Wang, K. & Tsai, J.H. (1996) Development and reproduction of Bemisia argentifolii 342
(Homoptera: Aleyrodidae) on five host plants. Annals of Entomological Society 343
of America, 89, 375-384. 344
Zalom, F.G., Castañe, C. & Gabarra, R. (1995) Selection of some winter-spring 345
vegetable crop hosts by Bemisia tabaci (Homoptera: Aleyrodidae). Journal of 346
Economic Entomology, 88, 70-76. 347
Table 1. Developmental period (day ± SE) of immature stages of Bemisia tabaci (Q biotype) at 5 constant temperatures.
Temp. (°C)
Stages
n eggs instar 1 instar 2 instar 3 instar 4 From egg to
adult 17 80 21.5±0.09a 9.4±0.35a 7.5±0.93a 8.0±0.42a 9.4±0.33a 55.8±0.47a 21 80 14.0±0.09b 7.1±0.21b 4.1±0.18b 8.8±0.23a 5.6±0.18b 39.6±0.69b 25 80 10.4±0.13c 4.3±0.19c 3.7±0.16bc 3.8±0.15b 3.4±0.12c 25.6±0.26c 30 80 7.7±0.06d 3.2±0.13d 3.3±0.15c 3.5±0.15b 2.5±0.09d 20.2±0.24d 35 38 6.5±0.10e 3.9±0.17cd 3.3±0.21c 3.5±0.29b 3.3±0.22c 20.5±0.33d
Table 2. Survivorship (percentage) of immature stages of Bemisia tabaci (Q biotype) at 5 constant temperatures.
Temp. (°C)
Stages
n
eggs egg instar 1 instar 2 instar 3 instar 4
n adults From egg to adult 17 80 91.3 84.9 96.8 73.3 63.6 38 48c 21 80 98.7 98.7 93.4 93.0 97.0 64 83a 25 80 100 93.8 94.7 98.6 97.1 68 85a 30 80 100 95.0 96.1 93.2 97.1 66 82a 35 38 100 97.4 89.2 78.8 92.3 24 63b
Table 3. Fecundity (number of eggs per female ± SE) and longevity (days ± SE) of Bemisia tabaci (Q biotype) at 5 constant temperatures.
Temp. (°C)
n Total fecundity Longevity
17 30 49.3 ± 6.7b 39.6 ± 3.6a
21 30 105.3 ± 10.4a 27.3 ± 0.8b
25 30 94.2 ± 12.3a 21.9 ± 1.7c
30 30 58.6 ± 10.4b 14.6 ± 1.1d
35 30 41.0 ± 5.6b 8.5 ± 0.7e
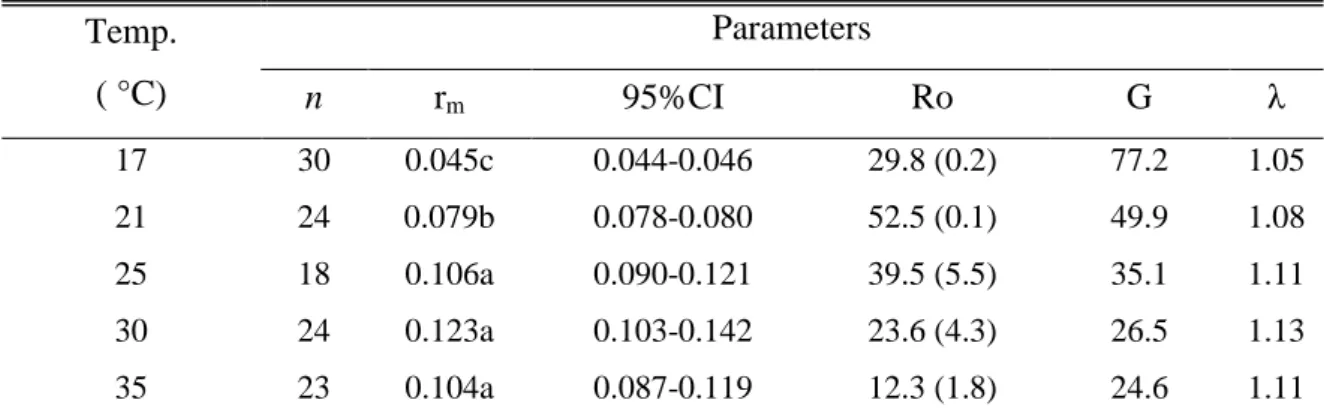
Table 4. Comparison of life table parameters of Bemisia tabaci (Q biotype) at 5 constant
temperatures. n = number of females. rm= Jacknife estimate of the intrinsic rate of increase.
CI= confidence interval estimate of rm. Ro = net reproductive rate (Standar error). G= mean
generation time in day. λ= finite rate of increase = exp(rm).
Temp. ( °C) Parameters n rm 95%CI Ro G λ 17 30 0.045c 0.044-0.046 29.8 (0.2) 77.2 1.05 21 24 0.079b 0.078-0.080 52.5 (0.1) 49.9 1.08 25 18 0.106a 0.090-0.121 39.5 (5.5) 35.1 1.11 30 24 0.123a 0.103-0.142 23.6 (4.3) 26.5 1.13 35 23 0.104a 0.087-0.119 12.3 (1.8) 24.6 1.11
Figure captions
Fig. 1. Influence of temperature on development time of Bemisia tabaci (Q biotype). Points: experimental values. curve simulated by Logan et al. (1976).
Fig. 2. Influence of temperature on survivorship of Bemisia tabaci (Q biotype). Points: experimental values. curve simulated by Curry & Feldman model (1987)
Fig. 3. Influence of temperature on female longevity of Bemisia tabaci (Q biotype). Points: experimental values. curve simulated by exponential model.
Fig. 4. Influence of temperature on fecundity of Bemisia tabaci (Q biotype). Points: experimental values. curve simulated by multiplicative exponential model.
Fig. 5. Influence of temperature on intrinsic rate of increase of Bemisia tabaci (Q biotype). Points: experimental values. curve: simulated by Logan et al. (1976) model.
Fig. 1. T e m p e r a tu r e ( ° C ) D e v e lo p m e n ta l ra te 0 ,0 0 0 ,0 1 0 ,0 2 0 ,0 3 0 ,0 4 0 ,0 5 0 ,0 6 1 0 1 5 2 0 2 5 3 0 3 5 4 0
Fig. 2. Temperature (° C) Surv iv a l (% ) 0 20 40 60 80 100 15 20 25 30 35 Temperature (° C) Surv iv a l (% ) 0 20 40 60 80 100 15 20 25 30 35
Fig. 3 T e m p e r a tu r e ( ° C ) L o n g e v it y ( d a y s ) 0 1 0 2 0 3 0 4 0 5 0 1 5 2 0 2 5 3 0 3 5 4 0
Fig. 4. T e m p e r a tu r e T o ta l n u m b e r o f e g g s / f e m a le 0 2 0 4 0 6 0 8 0 1 0 0 1 2 0 1 0 1 5 2 0 2 5 3 0 3 5 4 0 Temperature (°C)
Fig. 5. T e m p e r a tu r e ( ° C ) In tr in s ic r a te o f in c re a s e 0 ,0 0 0 ,0 2 0 ,0 4 0 ,0 6 0 ,0 8 0 ,1 0 0 ,1 2 0 ,1 4 1 0 1 5 2 0 2 5 3 0 3 5 4 0