NBER WORKING PAPER SERIES
SOCIAL SECURITY AND RETIREMENT PROGRAMS AROUND THE WORLD: THE CAPACITY TO WORK AT OLDER AGES – INTRODUCTION AND SUMMARY
Courtney Coile Kevin S. Milligan
David A. Wise Working Paper 21939
http://www.nber.org/papers/w21939
NATIONAL BUREAU OF ECONOMIC RESEARCH 1050 Massachusetts Avenue
Cambridge, MA 02138 January 2016
This paper is part of the National Bureau of Economic Research’s International Social Security (ISS) Project, which is supported by the National Institute on Aging (grant P01 AG012810). The authors are indebted to Maurice Dalton for expert research assistance. We also thank the members of the other country teams in the ISS project for comments that helped to shape this paper. The views expressed herein are those of the authors and do not necessarily reflect the views of the National Bureau of Economic Research.
At least one co-author has disclosed a financial relationship of potential relevance for this research. Further information is available online at http://www.nber.org/papers/w21939.ack
NBER working papers are circulated for discussion and comment purposes. They have not been peer-reviewed or been subject to the review by the NBER Board of Directors that accompanies official NBER publications.
© 2016 by Courtney Coile, Kevin S. Milligan, and David A. Wise. All rights reserved. Short sections of text, not to exceed two paragraphs, may be quoted without explicit permission provided that full credit, including © notice, is given to the source.
Social Security and Retirement Programs Around the World: The Capacity to Work at Older Ages – Introduction and Summary
Courtney Coile, Kevin S. Milligan, and David A. Wise NBER Working Paper No. 21939
January 2016
JEL No. H31,H55,I19,J14,J26
ABSTRACT
This is the introduction and summary to the seventh phase of an ongoing project on Social Security Programs and Retirement Around the World. The project compares the experiences of a dozen developed countries and uses differences in their retirement program provisions to explore the effect of SS on retirement and related questions. The first three phases of this project document that: 1) incentives for retirement from SS are strongly correlated with labor force participation rates across countries; 2) within countries, workers with stronger incentives to delay retirement are more likely to do so; and 3) changes to SS could have substantial effects on labor force participation and government finances. The fourth volume explores whether higher employment among older persons might increase youth unemployment and finds no link between the two. The fifth and sixth volumes focus on the disability insurance (DI) program, finding that changes in DI participation are more closely linked to DI reforms than to changes in health and that reducing access to DI would raise labor supply.
This seventh phase of the project explores whether older people are healthy enough to work longer. We use two main methods to estimate the health capacity to work, asking how much older individuals today could work if they worked as much as those with the same mortality rate in the past or as younger individuals in similar health. Both methods suggest there is significant additional health capacity to work at older ages.
Courtney Coile Department of Economics Wellesley College 106 Central Street Wellesley, MA 02481 and NBER [email protected] Kevin S. Milligan
Vancouver School of Economics University of British Columbia 6000 Iona Drive Vancouver, BC V6T 1L4 CANADA and NBER [email protected] David A. Wise NBER 1050 Massachusetts Avenue Cambridge, MA 02138 [email protected]
3 Project Overview
Through the coordination of work of a team of analysts in twelve countries for nearly twenty years, the International Social Security (ISS) project has used the vast differences in social security programs across countries as a natural laboratory to study the effects of retirement program provisions on the labor force participation of older persons. This analysis is the seventh phase of the ongoing project, and it is focused on the health capacity to work at older ages.
To summarize the findings of the prior phases: The first phase of the project described the retirement incentives inherent in plan provisions and documented the strong relationship across countries between social security incentives to retire and the proportion of older persons out of the labor force (Gruber and Wise 1999).
The second phase, which was based on microeconomic analysis of the relationship between a person’s decision to retire and the social security and other program incentives faced by that person, documented that incentives are a significant determinant of retirement decisions. We also considered the implications of increasing retirement program eligibility ages and showed that these changes would have large effects on employment at older ages. (Gruber and Wise 2004)
The third phase (Gruber and Wise 2007) demonstrated the consequent fiscal implications that extending labor force participation would have on net program costs— reducing government social security benefit payments and increasing government tax revenues.
In the fourth phase (Gruber and Wise 2010) we focused on the concern that removing incentives to retire from social security might reduce job opportunities for youth and lead to higher youth unemployment. We found no evidence to support the “boxed economy” proposition that higher employment of older persons is associated with lower employment of youth.
The fifth phase (Wise 2012) shifted the focus to disability insurance (DI) and health. We found that changes in DI participation were more closely linked to DI reforms than to changes in health and that DI reforms often had a very large effect on the labor force participation of older workers.
The sixth phase (Wise 2016) extended the methodology used in the second phase to study the effect of DI as well as SS program incentives on retirement. We found that individuals are very responsive to retirement incentives arising from the
4
structure of SS and DI programs and that reducing access to DI benefits would increase labor supply.
As we describe in more detail below, this seventh phase of the project explores the health capacity of individuals to work at older ages. Fiscal challenges facing social security and other government programs may lead to policy changes that incorporate the expectation of longer work lives, such as increases in the social security early or normal retirement ages. In this volume we ask: are individuals healthy enough to increase their labor supply at older ages?
The results of the ongoing project are the product of analyses conducted for each country by analysts in that country. Researchers who have participated in this phase of the project are listed first below; those who have participated in prior phases are listed second in italics.
Belgium Alain Jousten, Mathieu Lefèbvre, Sergio Perelman, Pierre Pestieau, Raphaël Desmet, Arnaud Dellis and Jean-Philippe Stijns
Canada Kevin Milligan, Tammy Schirle, Michael Baker and Jonathan Gruber
Denmark Paul Bingley, Nabanita Datta Gupta, Peder J. Pedersen and Michael Jørgensen
France Didier Blanchet, Eve Caroli, Corinne Prost, Muriel Roger, Luc Behaghel, Melika Ben Salem, Antoine Bozio, Thierry Debrand, Ronan Mahieu, Louis-Paul Pelé, and Emmanuelle Walraet
Germany Axel Börsch-Supan, Hendrik Jürges, Lars Thiel, Tabea Bucher-Koenen, Simone Kohnz, Giovanni Mastrobuoni Johannes Rausch, Reinhold Schnabel and Morten Schuth Italy Agar Brugiavini, Giacomo Pasini, Guglielmo Weber and
Franco Peracchi
Japan Takashi Oshio, Satoshi Shimizutani, Emiko Usui, Mayu Fujii, Akiko Sato Oishi and Naohiro Yashiro
Netherlands Adriaan Kalwij, Arie Kapteyn and Klaas de Vos Spain Pilar García Gómez, Sergi Jiménez-Martín, Judit
Vall-Castelló, Michele Boldrín and Franco Peracchi Sweden Per Johansson, Lisa Laun, Mårten Palme and Ingemar
Svensson
United Kingdom James Banks, Carl Emmerson, Gemma Tetlow, Richard Blundell, Antonio Bozio, Paul Johnson, Costas Meghir and Sarah Smith
5
United States Courtney Coile, Kevin Milligan, David Wise, Jonathan Gruber and Peter Diamond
An important goal of the project has been to present results that are as comparable as possible across countries. Thus the papers for each phase are
prepared according to a detailed template that we develop in consultation with country participants. In this introduction, we summarize the collective results of the country analyses and borrow freely from the country papers. In large part, however, the results presented in the introduction could only be conveyed by combined analysis of the data from each of the countries. The country papers themselves present much more detail for each country and, in addition to the common analyses performed by all countries, often present country-specific analysis relevant to each particular country.
Introduction to the Seventh Phase
Social security normal retirement ages have been raised in many developed countries in recent years, with additional increases in progress or under discussion. In this seventh phase of the International Social Security Project, we consider the capacity to work at older ages. In particular, we consider whether the health of older persons would allow them to work longer. It is important to emphasize at the outset that the “health capacity to work” is not intended to suggest how long people should work or what typical retirement ages should be in various countries. The age at which a person retires is strongly influenced by early and normal legislated retirement ages in his or her country, and also by individual health, employment opportunities, and other
circumstances. The health capacity to work, however, might be considered in
conjunction with potential increases in a country’s statutory retirement age. We will see that the health capacity to work at older ages is typically much greater than actual employment. We begin with background information and then explain the methods that we use to estimate the health capacity to work at older ages.
To help to put the analysis in context, it is useful to have in mind that employment rates in the ISS countries declined very substantially in the decades leading up to the 1990s. As shown in Table 1, a majority of the ISS countries saw the employment rate of men age 60-64 fall by at least one-third, and sometimes far more, between its peak in the 1960s or 1970s and its trough in the 1990s.1 Thus, if peak employment rates of
1 Note that the data series used in Table 1 starts in different years for different countries; because employment is
generally declining during this period, it is likely that the drop in employment would be larger in some countries if earlier data were available. On a related note, employment declines in the ISS countries typically began before the 1960s, so measuring the decline in employment relative to an earlier period would show an even steeper decline.
6
men 60 to 64 are taken as a measure of the capacity to work, then employment in the 1990s was much less than the capacity to work.
Indeed, employment has increased substantially in each country between the 1990s and the present, as can be seen in the bottom row of Table 1. Increases were greatest, in percentage terms, among those countries with the lowest employment rates at the trough. For example, in the four countries with employment rates of 10 to 30 percent at their lowest point – Belgium, France, Germany, and the Netherlands -- employment has more than doubled (or risen by 80 percent, in Belgium’s case). Most other countries have experienced increases of about 40 percent. In Japan, where employment of men 60 to 64 never dipped below 64 percent, employment has risen by about one-sixth; the US has experienced a similar rise. The trends in employment over this period are also shown in Figure 1.
Figure 1: Employment Rates of Men Ages 60 to 64 by Country, 1960-2014
8
The key takeaway is that employment of men 60 to 64 has changed a great deal from the early 1960s and 1970s to 2014, with substantial decline until the mid-1990s and then substantial increases thereafter in many countries.
We use two main approaches to evaluate the health capacity to work in this volume. The first is based on changes in the relationship between mortality and
employment over time and is referred to as the Milligan-Wise (MW) method, building on a previous study (Milligan and Wise, 2015). In this approach, a decrease in mortality may be thought of as an increase in health and thus as an increase in the capacity to work. The second method is based on a comparison of the health and employment of older and slightly younger individuals and is based on the work of Cutler, Meara, and Richards-Shubik (2013); we refer to this the Cutler et al. (or CMR) method. This
approach projects work capacity by first estimating the relationship between health (and other individual attributes) and employment for individuals age 50 to 54 and then using those estimates along with the actual health (and other) characteristics of older
individuals to predict their ability to work. Predicted employment is compared to actual employment in older age groups to estimate the additional capacity to work based on health. A third approach explores improvements in self-assessed health (SAH) over time by level of education. While this method does not yield direct estimates of the health capacity to work like the other two methods, it may be used to infer whether the ability to work at older ages is evolving differentially by socioeconomic status. We discuss each method and its results in turn. While this chapter focuses primarily on results for men, some results for women are available in the individual country chapters.
1. The Milligan-Wise Method
In Figure 2, we illustrate the MW method using the case of the United States. Beginning with the left-hand figure, the top dark line shows the relationship between mortality and employment that existed for men in the United States in 1977. The lower lighter line shows the relationship between mortality and employment 33 years later, in 2010. In 2010 at age 55, the mortality rate was 0.78 percent and the employment rate was 71.8 percent. In 1977, a mortality rate of 0.78 was experienced at age 49, when the employment rate was 89.1 percent. Thus, if we ask how much more people in 2010 could work if they worked as much as those in 1977 with the same mortality rate, the answer would be 17.3 percent, the difference in the two employment rates. Repeating the calculation at age 69, in 2010 the mortality rate was 2.19 percent and the
employment rate was 26.5 percent. In 1977, a mortality rate of 2.19 percent was experienced at age 61, when the employment rate was 64.4 percent. This suggests that the additional work capacity at age 69 is 37.9 percent.
9
Figure 2: Employment vs. Mortality of Men in the United States, Selected Years
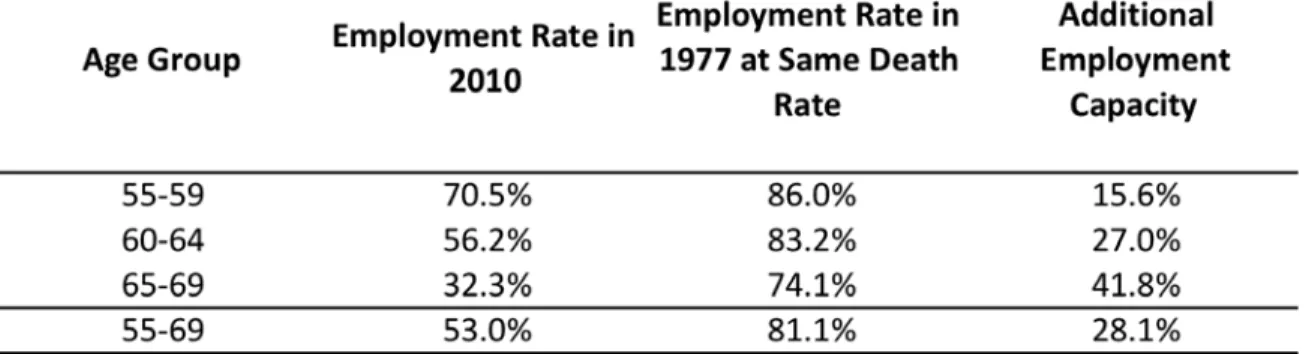
Source: US chapter (data from the Current Population Survey and the Human Mortality Database). We make similar calculations at every age and report these values in Table 2, averaging across age groups. We find additional work capacity of 15.6% at ages 55 to 59, 27.0% at ages 60 to 64, and 41.8% at ages 65 to 69. The fact that work capacity is rising with age can be seen on the figure in the increasing divergence of the darker and lighter lines as age increases. On average, total employment of men ages 55 to 59 was 28.1 percent lower in 2010 than it would have been if individuals worked as much as those with the same mortality worked in 1977.
Table 2: Additional Work Capacity for Men in the United States, MW Method
Source: US chapter (authors’ calculations).
The right half of Figure 2 repeats this exercise using the employment-mortality relationship that existed in 1995 rather than 1977 as the basis for comparison. Using the methodology described above, total employment of men ages 55 to 69 in 2010 was 12.2 percent lower than it would have been if individuals worked as much as those with the same mortality in 1995. We chose 1995 for a more recent comparison year because as shown in Figure 1, the employment rate of men 60 to 64 in the United States
10
declined from 1960 to 1995 and then began to increase, from 51.3 percent in 1995 to 55.1 percent in 2010. Our analysis suggests that even though employment rose
between 1995 and 2010, people in 2010 still worked less than their counterparts in 1995 with the same mortality, as employment did not increase by enough to keep up with mortality gains.
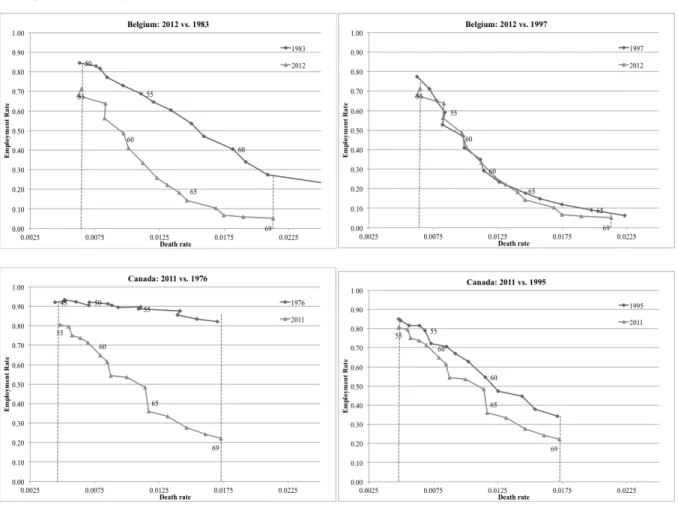
Comparable figures for men in the remaining eleven countries are shown in Figure 3 below, with the earlier comparison year (1977 or similar) on the left-hand side and the more recent comparison year (1995 or similar) on the right-hand side.
13
Source: see individual country papers for the source data for each country.
A number of findings are apparent from these figures. First, all countries exhibit substantial additional capacity to work when we use the employment of those with the same mortality rate in the earlier period (1977 or similar) as a basis for comparison. To further illustrate this, we take the additional work capacity at each age (measured as the vertical distance between the darker and lighter lines) and sum these values from ages 55 to 69 to arrive at an estimate of the total additional years of work capacity over this
14
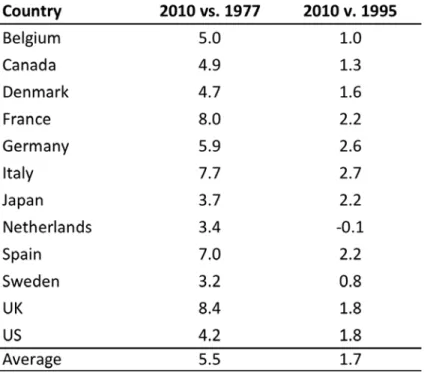
age range.2 As reported in Table 3, these values range from 3.2 years for Sweden to 8.4 years for the United Kingdom, with an average of 5.6 years across all countries. These values are quite large when compared to the actual average years of work over ages 55 to 69 in 2010 – 7.9 years in the United States, for example.
Table 3: Years of Additional Work Capacity for Men at Ages 55 to 69, MW Method
Source: individual country chapters.
Note: in some cases years used differ: Belgium (1983 not 1977); Germany (2005-09 not 2010, 1989-1995 not 1995, 1976-1980 not 1977); Japan (1975 not 1977); Netherlands (1981 not 1977); Sweden (2009 not 2010, 1985 not 1977).
A second key finding is that estimated additional work capacity is much smaller when using the more recent period (1995 or similar) as a basis for comparison. The total additional years of work capacity over ages 55 to 69 averages only 1.7 years for the countries as a group, and is one year or less in Belgium, the Netherlands, and Sweden. As shown in Figure 3, the two employment-mortality curves are barely distinguishable from each other in Belgium’s case.
The explanation for the difference between the 1977- and 1995-based results lies in employment trends. Mortality rates fell continuously over the period 1977 to 2010, while employment rates fell between 1977 and 1995 and then rose from 1995 to 2010,
2
For example, in the case of the United States, we estimate that an additional 17.3 percent of age-55 individuals could be working, which represents a 0.173 increase in years worked (17.3 percent of the population working one additional year). This value is 0.131 years at age 56, 0.144 years at age 57, etc. up to 0.379 years at age 69, and the total across ages 55 to 69 is 4.22 years.
15
as seen in Figure 1. Over the 1995 to 2010 period, increases in employment have been large enough to keep up with increases in mortality in some countries. To take 61 year-olds in the Netherlands as an example, the mortality rate fell from 1.33 percent to 0.81 percent between 1995 and 2010, while the employment rate rose from 26.7 to 61.9 percent. In mortality terms, 2010’s 61 year-olds are like 1995’s 57 year-olds, who had an employment rate of 61.2 percent. So the estimated additional work capacity at age 61, using the employment of those with the same mortality in 1995 as a basis for comparison, is close to zero. 2010’s 61-year-olds are also like 1981’s 54 year-olds, who had an employment rate of 79.6 percent, yielding a positive estimate of work capacity (17.7 percent) when 1981 is the basis for comparison. Even though the employment of 61 year-olds rose from 1981 to 2010 (from 57.3 to 61.9 percent), this is small compared with the drop in mortality (from 1.61 to 0.81 percent) and not enough to keep up with mortality gains.
To recap, in this analysis we estimate how much more older men today could work if they worked as much as those with the same level of health – as measured by mortality rates – did in the past. When we use 1977 as a basis for comparison, we estimate that there is substantial additional work capacity at ages 55 to 69 – 5.5 years on average for our sample of countries. This result can be explained by the fact that mortality rates have fallen substantially since 1977, while employment rates are either similar to or somewhat less than what they were in 1977, as evident from Figure 1. When we use 1995 as the basis for comparison, estimated work capacity shrinks substantially, to an average of 1.7 years in our sample of countries. Over the 1995 to 2010 period, employment has risen substantially in virtually all countries, as seen in Figure 1, and these employment gains have largely if not completely kept up with the gains in mortality.
It is not obvious whether 1995, 1977, or some other year is the “correct”
comparison year to rely on in drawing inferences about additional work capacity. Using an even earlier comparison year than we have here, such as 1960 (were the data to be available), would generate even larger estimates, since both mortality and employment rates fell during these earlier decades. It is also useful to remember that our approach implicitly implies that all increases in life expectancy will translate into additional work years. If one prefers to assume that life expectancy increases would be divided between work and retirement years, one could apply some fractional factor to the estimates here. The bottom line, however, is that the Milligan-Wise approach suggests that there is significant capacity to work at older ages in all countries.
16 2. Cutler et al. Method
Estimation: The Cutler et al. (or CMR) method involves two steps. The first is to estimate the relationship between employment and health (controlling for other
attributes, such as education) at ages 50 to 54. We choose this age range because it is before workers attain eligibility for social security and other early retirement benefits, and we wish to capture the relationship between health and employment that exists in the absence of access to retirement benefits.
For our measure of health, we use a health index constructed using the approach described in Poterba et al. (2013), which we call the PVW index. The index is based on 27 questions, including self-reported health diagnoses, functional limitations, medical care usage, and other health indicators. To calculate it, we first obtain the first principal component of these indicators, which is the weighted average of indicators where the weights are chosen to maximize the proportion of the variance of the individual health indicators that can be explained by this weighted average. The estimated coefficients from the analysis are then used to predict a percentile score for each respondent. An individual’s health index value will vary by survey wave, as updated health information is incorporated. As Poterba et al. (2013) demonstrate, the health index is strongly related to mortality and future health events such as stroke and diabetes onset, though not to future new cancer diagnoses. Some countries also estimate a version of the model including the individual health variables as covariates instead of the PVW index and present these results in their chapters.
To illustrate how we implement this approach, we estimate the model for those countries in our sample that are part of the Survey of Health, Aging and Retirement in Europe (SHARE) – Belgium, Denmark, France, Germany, Italy, the Netherlands, Spain, and Sweden. We also do so for the United States, using the Health and Retirement Study (HRS), and for the United Kingdom, using English Longitudinal Study of Ageing (ELSA), as the similarity of all of these datasets allows us to estimate a common specification for all countries.
Results are reported in Table 4 below. The coefficient on the PVW index is measured precisely for both men and women in each country, although the estimates vary across countries. For men for example, the lowest estimates are in Italy and Sweden—0.0032 and 0.0027 respectively. In the eight remaining countries the estimates vary from 0.0040 in France to 0.0077 in Spain. The estimate for the United States, for example, indicates that if the health percentile (between zero and 100) increases by 10 points, the probability of employment increases by about 6 percentage points.
17
Table 4: Estimated Relationship between Health and Employment, Men and Women Ages 50 to 54
Prediction of the Capacity to Work: In the second step of the CMR approach, estimates similar to those in Table 4 (though obtained separately for each country by its team) are used to predict the “capacity” to work at older ages—55 to 59, 60 to 64, and 65 to 69. In essence, we combine the estimated effect of health (and other
characteristics) on employment for those ages 50 to 54 with the actual health (and other characteristics) of those ages 55 to 69. This approach assumes that the relationship between health and employment will be the same for two groups, but should generate declining estimates of work capacity with age since health declines with age.
The results for men in the United States are provided in Figure 4 to illustrate the workings of this approach. For each age group, the total height of the bar represents
18
the predicted share of individuals working, based on the estimated relationship between health and employment for those 50 to 54 and the actual health of those in the older age groups. These values decrease with age, as expected, reflecting the effect of declining health on employment as predicted by our model. The light gray bar reflects the actual percent employed in each age group, and the dark gray bar – predicted share working minus actual share employed – is our estimate of the additional work capacity. As the actual share employed falls more quickly with age than does the predicted share working, the estimated additional work capacity grows rapidly with age, from 3.6 percent at ages 55-59, to 16.9 percent at ages 60-64, to 31.4 percent at ages 65-69, and 39.0 percent at ages 70-74.
Figure 4: Estimated Additional Work Capacity in the United States, by Age
Source: US chapter (authors’ calculations using Health and Retirement Study).
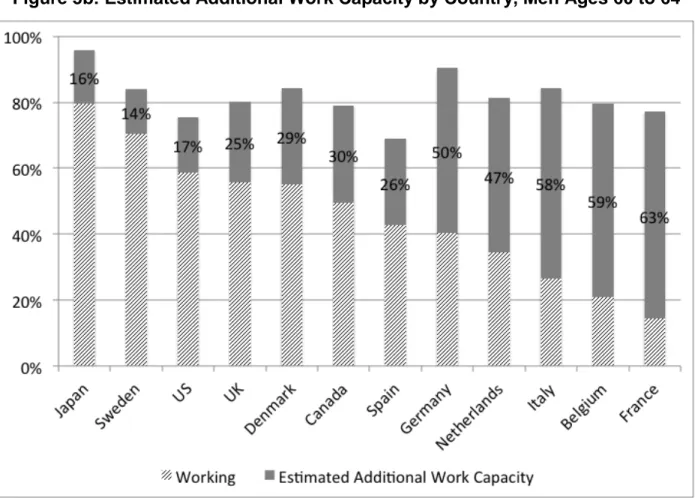
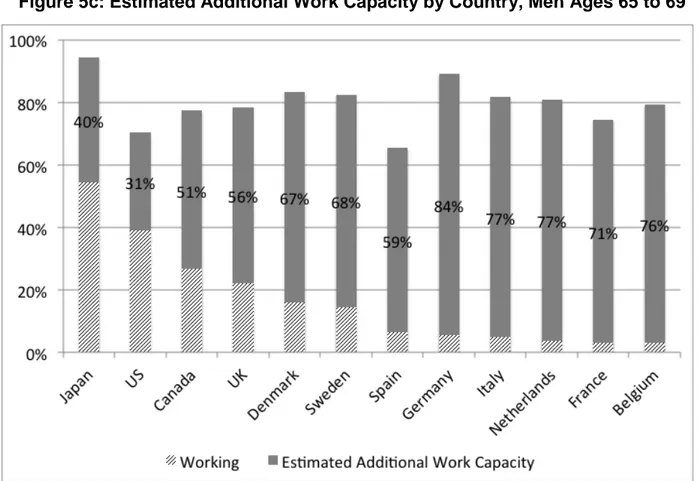
In Figures 5a, 5b, and 5c, we report the estimated additional work capacity for men ages 55 to 59, 60 to 64, and 65 to 69, respectively, for all countries in our sample.
19
The estimated additional work capacity at age 55 to 59 is only 2 percent in Japan and 4 percent in the United States, but values reach 19 percent in France, 21 percent in Italy, and 22 percent in Belgium. In the 60 to 64 age range, estimated additional work
capacity values are larger and the variance across countries is greater – values range from 14 percent in Sweden to 63 percent in France. This trend continues in the 65 to 69 age interval, where the values range from 31 percent in the United States to 84 percent in Germany.
Figure 5a: Estimated Additional Work Capacity by Country, Men Ages 55 to 59
20
Figure 5b: Estimated Additional Work Capacity by Country, Men Ages 60 to 64
Source: individual country chapters (authors’ calculation).
In the two older age groups in particular, it is evident that the differences in estimated additional work capacity across countries are not driven primarily by differences in the predicted share working. While there are some differences in predicted employment – Spain consistently has the lowest values and Japan and Germany the highest, for example – the differences in work capacity are primarily explained by differences in the actual share working across countries. For example, at ages 60 to 64 the predicted share working is nearly identical in the United States and France, while actual employment is much lower in France (14 percent vs. 59 percent), and consequently the additional work capacity is nearly four times larger in France, 63 percent vs. 17 percent.
Put differently, the widely varying levels of estimated work capacity across
countries cannot be explained by differences in the rate at which health declines, which would be reflected in how the predicted share working evolves with age. Rather, they are primarily due to differences in the age at which workers retire, a decision that is strongly influenced by social security incentives, as Gruber and Wise (1999) document.
21
Figure 5c: Estimated Additional Work Capacity by Country, Men Ages 65 to 69
Source: individual country chapters (authors’ calculations).
These estimates of the capacity to work may seem large relative to the actual employment rate. In Table 2, however, we showed that using the MW method for the United States, we obtain estimated additional work capacity of 15.6 percent at ages 55 to 59, 27.0 percent at ages 60 to 64, and 41.8 percent at ages 65 to 69, values in the range of those reported in Figures 5a, 5b, and 5c. The results using two very different methods are actually remarkably similar, though results from the Milligan-Wise method will depend on the base year used, as shown above.
3. Self-Assessed Health
In the first section of the paper, we focused on the mortality rate as a measure of changes in health over time. In this section, we explore the improvement in health over time based on SAH. An important advantage of SAH is that we can look at it by level of education, as the data sets with SAH virtually always include education, while mortality records often do not. Studies such as Waldron (2007) and National Academies of Sciences (2015) have established that gains in life expectancy over time are accruing disproportionately to individuals with higher socioeconomic status (SES). By looking at
22
the evolution of SAH by level of SES, we wish to see if this is the case for SAH as well. Unfortunately, data limitations prevented some countries from undertaking this analysis, but we show results for several of the countries where this was possible.
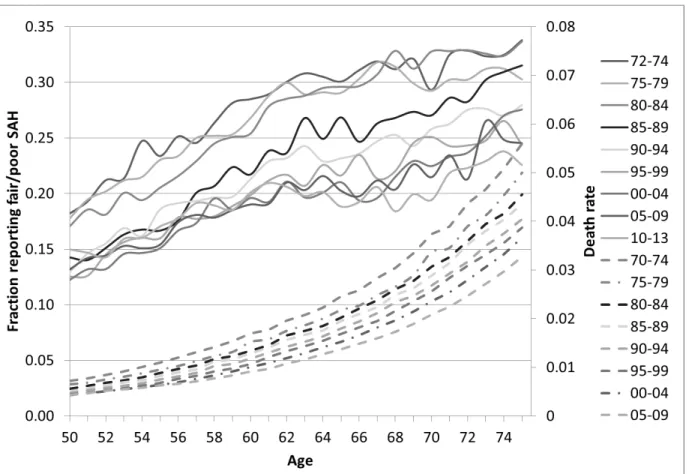
To begin, we discuss trends over time in mortality and in SAH and document their similarity. Figure 6 shows the relationship between SAH and age for 5-year groups from 1972 to 2013 and between mortality and age for 5-year groups from 1970 to 2009 for men in the United States. As expected, both mortality rates and the share of men reporting themselves to be in fair or poor health (SAH) rise with age, although this is perhaps less evident for SAH in the 60s in the more recent year groups. The mortality relationships are smooth and show continuous improvement from one group of years to the next. The SAH relationships are more variable due to smaller sample sizes; while improvements over time are sometimes difficult to discern from adjacent year groups, there are large improvements when contrasting the early 1970s with the late 2000s.
Figure 6: SAH and Mortality by Age for Men in the United States, 1972 to 2013
Source: National Health Interview Survey and Human Mortality Database.
Note: Solid lines (graphed against left-hand axis) show self-assessed health for groups of years. Dashed lines (graphed against right-hand axis) show death rates for groups of years.
23
Of particular interest is the fact that changes in the two series over time are relatively similar. For example, mortality at age 50 declined by 39.3 percent between 1970-74 and 2005-09, while the share reporting fair or poor health at age 50 decreased by 32.8 percent between 1972-74 and 2005-09. Over the same period, mortality at age 75 declined by 41.5 percent, while the share in fair or poor health at age 75 decreased by 33.2 percent. Alternatively, we can compare how much later certain health
benchmarks are reached in later vs. earlier periods. The mortality rate experienced at age 50 in 1970-74 was experienced at age 57 in 2005-09, a gain of 7 years, while the share of men in fair or poor health at age 50 in 1972-74 was experienced at age 57 in 2005-09, also a gain of 7 years. While the correspondence is not always one-to-one as in this example, overall the changes in these two health measures over time are fairly similar.
Figure 7: Change in SAH vs. Change in Mortality, Men Ages 60 to 64
Note: Reproduced from data in Milligan and Wise (2012). Regression line includes all countries with circle marker; excluding UK and France.
Looking across countries, there is a fairly strong correspondence between the change in reported SAH health and the change in mortality. Milligan and Wise (2012)
24
show a scatter plot of changes in self-assessed health and mortality across the twelve ISS countries. We reproduce this scatter plot below in Figure 7. The correspondence of the two across countries is very strong, except for the United Kingdom.
Turning our focus to SAH, Figure 8 highlights trends in SAH over time in the US, showing the relationship between age and the share of men in fair or poor health for three groups of years combined—1972-85, 1986-95, and 1996-13. The graph shows the raw data in the solid lines and a quadratic-smoothed dashed lines for each of the year groupings. The reduction in fair-poor SAH seems quite large over this time period. For example, the age at which 20 percent are in fair-poor health occurs at about age 54 in 1972-85 and at about age 62 in the years 1996-2013, a difference of 8 years. The age at which 25 percent of people are in fair-poor health rises by 15 years, from age 58 to age 73. An alternative comparison is based on the change in the fraction that reports fair or poor health at a given age. At age 65, this value is 35 percent lower in the 1996-2013 period than in the 1972-1985 period; at age 60 the value is 26 percent lower. The overall message is that the health of the population as a whole – as measured by SAH – has improved substantially in recent decades.
Figure 8: SAH by Age, Men in the United States, Selected Years
25
To assess whether these gains in health vary by education level, we first need to define education level in a way that will yield meaningful comparisons over time.
Following Bound et al. (2014), we focus on education quartiles. The use of specific categories like high school dropout can generate misleading results because the size of specific groups may be shrinking (or growing) over time, so that the group’s members are increasingly negatively (or positively) selected. That is, high school dropouts today may be quite different from their counterparts of the past, making it less useful to
compare how the health of people in this group has evolved over time.
Following the approach proposed by Bound et al. (2014), we begin by calculating the distribution of educational attainment for each cohort of 50-year-olds. The top education quartile will always contain the quarter of the cohort with the highest levels of education; however which education groups are represented in the top quartile will change over time. Figure 9 displays these results for men in the US. The top education quartile for the cohort reaching age 50 in 1950 includes all college graduates as well as most high school graduates; in 2012, the top quartile includes only college graduates.
Figure 9: Distribution of Educational Attainment by Cohort for Men in the United States, by Year Cohort Attained Age 50
26
Figure 10 shows the relationship between SAH and age by education quartile ranking for men in the United States for three groups of years—1972 to 1985, 1986 to 1995, and 1996 to 2013. The results show that health measured by SAH improved over time in each education quartile, with the exception of a reversal in ages in the 50s in the 2nd quartile for the years 1986 to 1995. However, the percent improvement was
greatest for those in the top education quartile and the lowest percent improvement was in the bottom education quartile. The percent improvements at age 66, for example, are shown at the end of this section in comparison to three other countries in Table 5.
Figure 10: Evolution of SAH by Education Quartile for Men in the United States
Source: National Health Interview Survey (accessed at www.ipums.org). The figure shows the share of men reporting fair or poor health.
Figure 11 is a comparable figure for France. Like the United States, the data for France show better health for higher education levels. Averaged over year intervals at age 50, the percent in fair-poor health in the United States is about 22 percentile points greater for the 1st education quartile than for the 4th education quartile—27 for the first
27
quartile, 14 for the second, 11 for the third, and 5 for the fourth quartile. Similarly, the difference in France between the first and fourth quartile is about 21 percentile points. But the average number of men reporting fair-poor health at age 50 is much greater in France than in the United States—38 percent in France versus 14 percent in the United States for the 2nd quartile. (This result is consistent with the well-known country-specific effects in SAH.) There is less evidence for an improvement through time for France, as the 1992-98 results are quite similar to the 2000-10 results, although the time spanned by the data is shorter here than in the United States.
Figure 11: Evolution of SAH by Education Quartile for Men in France
Data source: Enquête sur la Santé et la Protection Sociale. The figure shows the share of men reporting fair or poor health.
We next turn to the UK in Figure 12 to see the evolution of poor health across the different education quartiles. Here, the data are pooled for men and women for greater precision and separated into two time periods: 1991 to 1999 and 2004 to 2012. As with France and the United States, those with higher education levels appear to be in better
28
health. There is also a strong gradient with age for poor health. However, the evidence for improvements through time in the UK is weak, although there is some sign of improvement for the higher two education groups.
Figure 12: Evolution of SAH by Education Quartile for Men and Women in the United Kingdom
Source: Health Survey for England, 1991–2012. The figure shows the share of men reporting fair, bad or very bad self-assessed general health.
Finally, we look at data for Germany in Figure 13. We have data by age of the proportion who report having a chronic illness for more than one year. These data are broken down by education quartile in the manner described above, and presented for three separate years. There appear to be fewer differences across education quartiles than in other countries, with roughly the same age pattern evident in the first and fourth quartiles. However, there does appear to be improvement over time, most noticeably in the third and fourth quartiles.
29
Figure 13: Evolution of Chronic Illness by Education Quartile for Men in Germany
Source: German microcensus data. The figure shows the share of men reporting experiencing a chronic illness lasting more than one year.
Our findings for these four countries are summarized in Table 5, taking the results at age 66. Overall, for two of these four countries we highlighted, all education groups (as represented by education quartiles) have experienced gains in health over time. In addition, for three of the countries, gains have been largest for the more highly-educated groups, but for France there is no education pattern for the improvements. While the results of this analysis are not directly comparable to the Milligan-Wise and Cutler-Meara results presented above, they are nonethless useful in our assessment of the health capacity to work at older ages, as they suggest that gains in health capacity to work may be biggest for higher socioeconomic status individuals.
30
Table 5: Percent Improvement in Health at Age 66 by Education Quintile
Notes: For each country using the results from Figures 10 to 13, we compare the first group of years to the latest group of years. For the US: 1972-1985 vs 1996-2013. For France: 1992-1998 vs 2000-2010. For UK: 1991-1999 vs 2004-2012. For Germany: 1989 vs. 2009.
4. Summary
This volume is the seventh phase of our ongoing project on retirement programs around the world. In many countries, normal retirement ages have been increasing and further increases are in progress or under consideration. In this phase of the project, we consider the capacity to work at older ages, particularly whether the health of older persons would allow them to work longer.
We use three approaches to evaluate the capacity to work. The first, which we refer to as the Milligan-Wise method, is based on the reduction in mortality over time. We suggest that a decrease in mortality may be thought of as an increase in health, and thus as an increase in the capacity to work. We find, however, that mortality declines since the late 1970s have not been met with equivalent increases in employment. That is, at any mortality rate, employment is lower now than it was three to four decades ago. In the United States, for example, we estimate that the additional employment capacity of men 65 to 69 in 2010 is 42 percent (that is, that the employment rate could be 74 rather than 32 percent), using 1977 as the base year in the calculation and assuming a constant relationship between employment and mortality over time. In most of the ISS countries, the actual employment of men 60 to 64 has been increasing since the mid-1990s, but not by enough to keep up with mortality gains, so we estimate significant additional employment capacity even when we use a base year with low employment, such as 1995. On average across all countries, our estimates suggests that men could work an additional 5.5 years with 1977 as the base of comparison or 1.7 years with 1995 as the base year.
The second method, which we refer to as the CMR method, is based on using the estimated relationship between health and employment of persons aged 50 to 54 and the actual health of individuals age 55 to 69 to predict the work capacity of the latter group. This method also yields predictions of the capacity to work at older ages that substantially exceed the actual proportion of people working at older ages. Based on this method, the share of the population with the health capacity to work at ages 60 to 64 in the United States, for example, is about 17 percent greater than the actual percent
31
working; between 65 and 69, the difference is about 31 percent. The average values for the twelve countries in our sample are 36 and 63 percent, respectively.
A third method is based on improvements in self-assessed health (SAH) over time. This method, however, was possible to implement only in certain countries. The results were mixed across countries. For most, there was a strong education gradient in the incidence of poor health. Only some countries showed improvements in health as measured by self-assessed health through time, though there was some indication that these gains were larger for the higher education quartiles.
In short, all three methods suggest that older men have substantial additional capacity to work beyond their current employment levels. It is important to emphasize again that our concept of the health capacity to work is not intended to suggest how long people should work nor to suggest what typical retirement ages should be in various countries. As people live longer and healthier lives, it may be appropriate for policy makers to consider how these gains in life expectancy should be divided between years of work and retirement. It is also important to recall that there may be other
impediments to longer work lives, such as weak labor demand for older workers. The concept of health capacity to work, however, can be important in considering whether continued incremental increases in retirement ages, such as those that have been common in many countries over the past two or three decades, might be constrained by the health of older workers going forward. The results of this phase of the International Social Security Project suggest that this is not the case.
References
Bound, John, Arline Geronimus, Javier Rodriguez, and Timothy A. Waidmann (2014). “The Implications of Differential Trends in Mortality for Social Security Policy,” Michigan Center for Retirement Research Working Paper 2014-314.
Cutler, David M., Ellen Meara, and Seth Richards-Shubik (2013). “Health and Work Capacity of Older Adults: Estimates and Implications for Social Security Policy,” mimeo. Gruber, Jonathan and David A. Wise (1999). Social Security and Retirement Around the World. Chicago: University of Chicago Press.
Gruber, Jonathan and David A. Wise (2004). Social Security Programs and Retirement Around the World: Micro-Estimation. Chicago: University of Chicago Press.
Gruber, Jonathan and David A. Wise (2007). Social Security Programs and Retirement Around the World: Fiscal Implications of Reform. Chicago: University of Chicago Press.
32
Gruber, Jonathan and David A. Wise (2010). Social Security Programs and Retirement Around the World: The Relationship to Youth Unemployment. Chicago: University of Chicago Press.
Milligan, Kevin and David A. Wise (2012), “Introduction” in David A. Wise (ed.) Social Security Programs and Retirement Around the World: Historical Trends in Mortality and Health, Employment, and Disability Insurance Participation and Reforms. Chicago: University of Chicago Press.
Milligan, Kevin and David A. Wise (2015). “Health and Work at Older Ages: Using Mortality to Assess the Capacity to Work Across Countries,” Journal of Population Ageing, Vol. 8, No. 1-2, pp. 27-50.
National Academies of Sciences, Engineering, and Medicine (2015). The Growing Gap in Life Expectancy by Income: Implications for Federal Programs and Policy
Responses. Report of the Committee on the Long-Run Macroeconomic Effects of the Aging U.S. Population-Phase II. Washington, D.C.: The National Academies Press. Poterba, James, Steve Venti, and David A. Wise (2013). “Health, Education, and the Post-Retirement Evolution of Household Assets,” paper prepared for the RAND Conference on Health, Aging, and Human Capital.
Waldron, Hilary (2007). “Trends in Mortality Differentials and Life Expectancy for Male Social Security-Covered Workers, by Socioeconomic Status,” Social Security Bulletin 67(3).
Wise, David A. (2012). Social Security Programs and Retirement Around the World: Historical Trends in Mortality and Health, Employment, and Disability Insurance Participation and Reforms. Chicago: University of Chicago Press.
Wise, David A. (2016). Social Security Programs and Retirement Around the World: Disability Insurance Programs and Retirement. Chicago: University of Chicago Press.