HAL Id: hal-02997102
https://hal.archives-ouvertes.fr/hal-02997102
Submitted on 9 Nov 2020
HAL is a multi-disciplinary open access archive for the deposit and dissemination of sci-entific research documents, whether they are pub-lished or not. The documents may come from teaching and research institutions in France or
L’archive ouverte pluridisciplinaire HAL, est destinée au dépôt et à la diffusion de documents scientifiques de niveau recherche, publiés ou non, émanant des établissements d’enseignement et de recherche français ou étrangers, des laboratoires
zones: the case of the Manaus free trade zone
Louisiana Teixeira
To cite this version:
Louisiana Teixeira. Labor standards and social conditions in free trade zones: the case of the Manaus free trade zone. Economics: The Open-Access, Open-Assessment E-Journal, 2020, 14, pp.2020 - 2039. �10.5018/economics-ejournal.ja.2020-19�. �hal-02997102�
Received November 6, 2019 Published as Economics Discussion Paper November 29, 2019
Labor standards and social conditions in free trade
zones: the case of the Manaus free trade zone
Louisiana Cavalcanti Teixeira
Abstract
The creation of the Manaus Free Trade Zone had a development purpose in the Brazilian political, economic and social scenario between 1960 and 1970. This industrial pole was an important device in achieving the desired development, populating a region considered deserted and exposed to external threats at that time. It has guaranteed the improvement on labor standards and social conditions in the Manaus’ district and has become the main driving force behind regional employment, higher salaries and growth over the past decades. Using the residuals and the stochastic frontier techniques to estimate the labor and social performances of the Manaus Free Trade Zone, the analysis confirms that the implementation of the special economic zone collaborated to labor and social efficiency in the area – compared to other important industrial Brazilian municipalities – due to the rigid checks conducted by SUFRAMA and the strict respect of labor standards applied in the MFTZ. Nevertheless, economic linkages in the region are still weak and positive spillovers from Manaus to its surroundings were probably inexistent.
(Published in Special Issue Recent developments in international economics)
JEL F12 F13 F14
Keywords Free trade zone; Manaus; employment; labor standards; social progress Authors
Louisiana Cavalcanti Teixeira, University Paris Dauphine, DIAL-IRD,
louisiana.cavalcantiteixeira@dauphine.psl.eu
Citation Louisiana Cavalcanti Teixeira (2020). Labor standards and social conditions
in free trade zones: the case of the Manaus free trade zone . Economics: The
Open-Access, Open-Assessment E-Journal, 14 (2020-19): 1–41. http://dx.doi.org/10.5018/
1 Introduction
Special Economic Zones (SEZs) consist in a particular form of trade liberalization.1 These zones can be defined as "demarcated geographic areas contained within a country’s national boundaries where the rules of business are different from those that prevail in the national territory" (Farole and Akinci, 2011). Generally, they are implemented by governments in order to promote trade and provide a free trade environment within a limited territory in which there is a special regulation for the companies’ operation. Its purpose is therefore to stimulate trade and, in some cases, to accelerate regional development.
SEZs are part of the trade environment characterized by the international fragmentation of production. Firms reorganized their production based on outsourcing some of their activities, relying on a larger number of external suppliers for intermediate components and services. The commonly suggested explanation for the growing reliance on external suppliers is that changes in public policies and the development of new technologies have reduced trade and communication costs among vertically linked firms, stimulating companies to seek inputs and components from wherever their cost is lower (Baldwin, 2013). SEZs contribute to this costs reduction by tax exemptions, soft rules, better access to infrastructures and low wages (Teixeira, 2014). Usually, the production stages are developed in these special zones, using imported inputs to be transformed in final or other intermediate goods to be exported.
The International Labor Organization estimated that the number of employees in the world’s export processing zones (EPZ) stood at 66 million in 2006, excluding China.2 These SEZs are mainly set up in developing and emerging countries – especially from the 1990s, when the number of these zones in periphery economies increased significantly –, specializing in the manufacturing of labor–intensive produced goods, predominantly clothes and electronic goods (Cling et al., 2005).
Over the past few decades, these zones have received attention in debates on economic and social development. Although some authors (Heller and Kauffman, 1963; Buitelar et al., 1999; Naughton, 2007) find that SEZs bring economic and social benefits by attracting investments and expanding trade and income in developing countries, their economic and social effects remain controversial.
Buitelar et al. (1999) and Naughton (2007) use the examples of maquiladoras in Mexico and special zones in China to evaluate the potential economic benefits of the SEZs. Often specialized in assembly, these zones are the final stage in the Global Value Chain (GVC). Using industrial
1 The term ’SEZ’ covers a wide range of more specific types of zones, such as Free Trade Zones (FTZs), Export Processing Zones (EPZs), Business Zones, Free Ports and others. For descriptions and classifications of different types of SEZs in the world, see Farole (2011), Farole and Akinci (2011), and Siroen and Yucer (2014). The International Labor Organization’s (ILO) SEZs database reported 176 zones in 47 countries in 1986 and approximately 3,500 zones in 130 countries by 2006 (Boyenge, 2007). In addition, Siroen et al. (2014) find around 1,083 zones (excluding the Maquiladoras and US Foreign Trade Zones) in 2008 in their World FTZ database covering 158 countries. The differences in the number of SEZs found across databases are closely linked to the type of SEZ definition chosen, but there is clear evidence of growth in numbers (Castilho et al., 2015).
2 Boyenge (2007) present a new estimation in the ILO database on export processing zones. See also Siroen et al. (2014). They construct the World FTZ Database (ftz.dauphine.fr). It synthesizes the information about the FTZ programs for 158 countries and it is collected from different sources, such as NGO reports, academic articles, and authority websites.
components from all over the world in their production processes they have consequently become prominent importers of intermediate goods. The authors point out that they have contributed to the deepening of the international production fragmentation, to the increase of trade and also to attract foreign direct investment (FDI).
Likewise, the predominant view of international organizations (The World Bank, WTO, UNC-TAD) is that although SEZs operate in rather singular ways, often disrespecting WTO rules – such as those in the WTO’s Agreement on Subsidies and Countervailing Measures –, they do encourage foreign direct investment (FDI) spreading technology to the rest of the economy and creating positive externalities.3 They give developing countries the opportunity to integrate the Global
Value Chain stimulating trade and economic growth.
Regarding the potential social effects of SEZs, at the beginning of the 1960’s, Heller and Kauffman (1963) had already started to discuss the importance of tax exemptions in the industry and income expansion in developing countries. At the end of the 1980’s Freitas Pinto (1987) was already leading the debate about the creation of SEZs at the turn of the century.4 Naughton (2007) examined the potential effects on the increased income levels, technology and the pro-development nature of SEZs, focusing the debate on the special zones in China. Ham et al. (2011) and Busso et al. (2013) analyze the North American Federal Empowerment Zones program, pointing to positive and significant effects on local employment rate and wages as well as poverty rate decrease. Other studies dealt more specifically with the Brazilian free trade zone, such as Castilho et al. (2010), which addressed the subject of gender inequality, showing that female employees in the manufacturing industry in the Amazonas state are subject to less inequality compared to the rest of Brazil. More recently, Castilho et al. (2015) looked at the MFTZ potential for the local poverty and inequality decreases.
Nonetheless, these zones can also create distortions (due to tax exemptions, etc.) and another debate questions whether SEZs bring fair competition (OECD, Mercosur). Moreover, its impact on labor standards and human development is still the subject of considerable debate. Frequently questioned by civil society (Unions, NGOs) and international organizations such as the International Labor Organization (ILO), SEZs practices would be prone to ignoring fundamental labor standards. The weak labor regulation of these zones is an attractive factor for multinational companies, what corroborates to negligence national labor laws and standards. Cling et al. (2005), Siroen (2012), Teixeira (2013), Castilho et al. (2010) also explored labor standards concerns. They point out that labor standards in these zones are often neglected and workers are subject to low wages and poorer labor conditions.
3 Firms located in SEZ are often subject to export share requirements (ESR). i.e., they must export at least a certain share of their production to be eligible to operate and enjoy the fiscal incentives available in these special zones (Defever and Riano, 2017). The imposition of ESR, therefore, makes the subsidies provided to firms in SEZ contingent upon export performance – a practice prohibited by the World Trade Organization’s (WTO) Agreement on Subsidies and Countervailing Measures (Defever et al., 2018).
4 Freitas Pinto (1987) describes the changes introduced in the Amazon and their impacts on regional development due to the establishment of the Manaus Free Trade Zone, where several foreign companies have settled in search of incentives such as total or partial tax exemptions, infrastructure, low wages, among other advantages.
Recent reviews of descriptive case studies show how social and economic gains from zone operations vary across countries, but also within countries and between zones and time (Aggarwal, 2007, 2012; Fias, 2008; Farole, 2011).
This study examines the debate about social behavior based on the case of the Manaus Free Trade Zone (MFTZ). This special economic regime was introduced during the 1960’s following a government decision to pursue a growth strategy driven by import substitution. The MFTZ integrated the vertical specialization evolution, without making exports a goal. Differing from the usual SEZs and characterized by what literature calls an importing processing zone, the MFTZ final objective was the assembling of imported components for the internal market supply (Siroen and Yucer, 2014). The model was just one of the structural alignment policies introduced by the military regime at a time of international crises, threats of internationalization in the Amazon forest and the Cold War. Justified by the need to develop and integrate the Amazon region that had remained virtually deserted since the collapse of the rubber-based economy in the early 1920s, its idea and creation led to a shift in the decentralization of capitalist production beyond its original borders. Granting tax benefits was necessary to bring investments to the north region because of its distance from the consumer markets, mostly concentrated in the south and southeast of Brazil. Thus, the region needed to offer special conditions for companies to be set up there.
Despite its critics, the MFTZ started out as a veritable pole of development offering fiscal incentives from the Brazilian government.5 The fiscal incentive policies have created a pros-perous industrial center in Manaus, with a growing participation of this Amazonian industry in national production. Strictly supervised by the Superintendence of the Manaus Free Trade Zone (SUFRAMA), it has allowed compliance with labor standards.6Moreover, the revenue’s generation through new jobs, higher wages and new opportunities significantly improved the standards of living for the local population.7
5 The initiative to implement and develop the Manaus Free Trade Zone has never resulted from a unanimous position of the Brazilian society. The discussion is guided by the divergence in assessing the costs and benefits of maintaining the incentive schemes in the region. Its critics develop arguments on the cost of tax incentives and the alleged lack of competitiveness of the goods produced in the Manaus Industrial Pole.
6 The SUFRAMA has control mechanisms and the imposition of conditionalities for companies to acquire the various tax advantages. For a detailed analysis on the SUFRAMA’s impositions, see the SUFRAMA’s Resolution N. 203 of December 10th 2012.
7 According to data provided by the Brazilian Institute of Applied Economic Research (IPEA – IPEADATA) on the GDP per municipality, in 2010 Manaus concentrated 25% of the revenue generated in the Northern region. While Amazonas represented 1.4% of the Brazilian GDP, Manaus alone (with R$ 50,2 billion GDP in 2010), made up 82,4% of the total GDP of the state of Amazonas. Moreover, the Annual Industrial Survey by the Brazilian Census Bureau (PIA/IBGE) reports that the share of Amazonas – the smallest geographical unit in the survey – in the Brazilian manufacturing production reached 3.7% in 2010 – while Manaus accounts for just 0.9% of the Brazilian population. After a decade of high growth, Amazonas’ manufacturing production had grown by a factor of 3.4%, with an annual average growth rate of 13% (Castilho et al., 2015). In terms of job creation, the development of commercial and industrial activities in the MFTZ created a large demand for labor. According to IBGE data the population of Manaus represented 52.2% of the State in 2015 while in 1960 the percentage was only 24.3%. According to PIA / IBGE data, in the state of Amazonas, manufacturing employment almost doubled between 2000 and 2010. The number of workers in manufacturing industries increased from 59 586 to 116 503 in the period – an increase of 96% above the average of 50%. According to SUFRAMA data, the number of employees increased from 50 005 in 2000 to 103 673 in 2010 (+ 107%) in the MFTZ. On an annual average basis, the number of companies increased from 307 to 431 at the same period, while the industrial structure in the Manaus Industrial Pole remained highly concentrated.
This paper describes and evaluate some of the labor and social outputs of the various fiscal incentives applied in the Manaus Free Trade Zone, that allowed for a greater integration of the Brazilian economy in the international trade. Our aim will be to determine whether factors in labor standards and social conditions in the Manaus Industrial Pole are capable of generating positive spillovers in Manaus and surrounding areas. Despite confirmation of the existence of a positive impact from the MFTZ, this analysis will show that the beneficial effects of the free trade zone remain contained within the borders of the municipality of Manaus.
2 Methodology and Data
In order to empirically estimate labor and social conditions in the MFTZ, this analysis is based on the study of the residuals – deviations between an observed value and the estimated value –, exploiting two different methods, as a measure of robustness check. The analysis uses cross-sectional data, at the municipality level for the year 2010. Due to the lack of available data concerning only the perimeter of the free trade zone, the MFTZ is represented by the municipality of Manaus, which is compared to the other brazilian municipalities. The first model, Model A, estimates the expected Manaus’ outputs by a residuals analysis, using OLS estimation. The second one, Model B, applies the stochastic frontier method of error term decomposition, which shows the level of labor standardsâ and socialâs efficiency generated by Manaus, using the Maximum Likelihood estimation.
Attempts to capture the MFTZâs causal effects on welfare outcomes would call for a counter-factual of the situation without the MFTZ, which is not possible due to the unavailability of reliable data.8 Facing such limitations, we have nevertheless tried to provide a framework for comparison by applying cross-sectional variations across municipalities instead of a temporal comparative analysis.9
2.1 Concepts and Econometric Specificities
The methodology implemented for both residuals and stochastic frontier techniques will use linear regression with the Ordinary Least Squares (Model A) and the Maximum Likelihood estimations (Model B), respectively.
In order to empirically estimate working and social conditions in the MFTZ, the main econo-metric specifications are as follows:
ln yi= β0+ n
∑
j=1
βjln xj,i+ γiεU F+ γc+ εi (1)
8 We were unable to carry out analyzes from previous years to build a counterfactual of the situation without the MFTZ since the only Brazilian database that allows us to analyze at the municipality level is the census, which is carried out every ten years, and due to the unavailability of microdata for the census prior to the creation of the MFTZ (from 1920 to 1960, there are only tabulations at state and municipality level for the main variables, being published in printed format). 9 For our cross-sectional analysis, we employ residuals and social efficiency rankings of a subsample of municipalities with ’similar’ characteristics: state capitals and the main Brazilian industrials poles. See Castilho et al. (2015); Picarelli (2014).
where ln yidenotes the labor standards and social conditions in each municipality i. The vector
xj,iincludes j control variables typically assumed to affect labor and social conditions, capturing
geographic specificities. Our main specification includes as controls: GDP per capita, distance from the state capital, geographic density and urban population. Finally, γiεU F is a state specific
fixed effects, γcis a dummy for state capitals, and εiis the error term.
We use different dependent variables for each estimation Children not Working, Gender Equalityand Ethnic Equality for labor standards; Literacy Rate, Children with literate parents, Children with adequate housing and living conditions, Children with literate parents & adequate housing and living conditions, Less-poverty index and Equality index for social conditions. In this analysis, a smaller incidence of child labor, gender and ethnic wage inequalities will be treated as a result of labor standards efficiency while social performances will be analyzed through the illiteracy and poverty rates, the GINI, and the housing and living conditions. Moreover, positive coefficients will be indicating a reduction in child labor, an increase in gender and ethnic wage equality (considering that men are better paid than women and that white is better paid than non-white), a reduction in illiteracy rate, better housing and living conditions, smaller Poverty and smaller GINI. A comparative analysis between the states and municipalities in Brazil has been carried out in order to check the existence of labor and social efficiency in the MFTZ as well as positive spillovers from Manaus to its neighboring municipalities.
In Model A, in which the existence of a positive Manaus effect is approached by the study of the residuals (model’s deviation), we will focus whether positive values for the observed deviations can be perceived, in other words, whether the difference between the observed value yiand the
value ˆyiestimated by the regression is positive. The main idea is to determine whether the observed
value yi, which is a given social index, is superior to the value ˆβ xi+ ˆα estimated by the regression.
This positive deviation would be interpreted as a positive effect where the observed social result for each municipality is higher than the result expected by the model. Thus, inversely, a negative deviation would indicate a negative effect, in which the observed social result is smaller than the result predicted by the model.
In Model B, we apply the concept of productive efficiency to social efficiency analysis, using the stochastic frontier method. Ravallion (2003) points the benefit that it allows for random deviations from the frontier, such as due to measurement errors or shocks. Aigner et al. (1977) and Meeusen and Broeck (1977), admitting the possibility of a system not only to face problems of inefficiency in its performance, but also to be subject to external random factors that can affect its performance, assume the function of production as the locus of levels of maximum output that can be obtained with a particular set of inputs, for the current technology. It is assumed that not all systems have efficient performances, not being able to produce the output of the frontier. Thus, the term µ ≥ 0 reflects the output’s deviation.
Applying this method of decomposition of error terms – Stochastic Frontier – to our social analysis, we consider i municipalities that use N inputs to produce social performance.
Considering Cobb-Douglas technology, the production output of municipalities is expressed as follows: ln yi= β0+ n
∑
j=1 βjln xj,i+ νi− µi (2)Or, ln yi= β0+ n
∑
j=1 βjln xj,i+ εi (3)εi = νi− µi is the error term observed in the production function. νi reflects the random
deviation while µi is the inefficiency term. The stochastic statistical method considers εi a
compound term with asymmetric distribution, since the inefficiency term cannot be negative (µ ≥ 0).10 Thus, the model is composed by the difference between the stochastic boundary (ln yi = β0+ β ln xi+ νi) and the inefficiency term (µi). If the terms νi and µi are distributed
independently of each of the xiregressors, the estimators are consistent and efficient.
One of the main assumptions in production function models is that all productive units face similar environmental conditions. However, this is not the case of the Brazilian municipalities social reality since there are different socioeconomic and political factors between each location, illustrating the relevant independence between each unit of the federation. Thus, although they are not under the municipalities control, the omission of variables that capture different environmental factors generates a problem of heterogeneity in the model.
Having any of the error terms heteroskedastic renders the estimated parameters not efficient, although they remain consistent. Therefore, to include these characteristics within this analysis, we will add fixed effects to each federative unit, as well as a dummy to the state capitals in the model. 2.2 Data
The usual data source in Brazilian social and labor studies is PNAD data, which is conducted annually, covering individual information on the main socio-economic variables. Nonetheless, a significant limitation made it unsuitable for our study: its representativeness and coverage do not extend to below state level. Hence, in order to focus on Manaus, a remaining representative at the municipality level, we turned to census data. To elaborate on our cross-sectional analysis, we used the individual/household level microdata from the Brazilian census of 2010. It is conducted every ten years by the Brazilian Census Bureau, the Instituto Brasileiro de Geografia e EstatÃstica (IBGE), the last one occurring in 2010. A detailed questionnaire (questionario da amostra) – including individual and household’s information on the main socio-economic variables, such as the general characteristics of population, education, labor, income, housing, migration, fertility, marriage, health, nutrition – is administered to a census sample of around 11% of the Brazilian population. The survey samples about 70 million households and it is nationally representative, ensuring coverage of both rural and urban areas of all the 5.565 municipalities of the federation. The data used to our control variables were obtained from IBGE.
10As the random term can assume any value, it is common to assume that this term follows a normal distribution νi∼ N(0, σν2). As the inefficiency term cannot be negative, there are several distributions that satisfy this restriction, among them truncated-normal, exponential and gamma. In this study, we use the truncated-normal distribution, since it allows the correction of any sources of bias in the model, bringing more consistent estimations.
In our study, we use the municipality level, obtained by the aggregation of the individual-level information. The analysis use information concerning three different topics on labor standards: Child Labor, Gender Wage Gap, and Ethnic Wage Gap; and six topics on social conditions: Illiteracy Rate, three variables concerning children conditions, the poverty incidence and the GINI index, assuming the hypothesis of exogeneity.11 These nine topics are then treated separately.
The choice of the labor standards dependent variables used is based on goals two, three and four of the Millennium Development Goals of the United Nations Development Program (UNDP) – achieve universal primary education promote gender equality and reduce child mortality, respectively – which were the themes that we judged the most exploitable to deal with the labor standards’ issue. Since we are interested in dealing with the effects of the MFTZ on labor standards and as child labor refers to the exploitation of children through any form of work that deprives them of their childhood, their physical, mental and moral health, or interferes with their ability to attend regular school, we have decided to convert objectives two and four of the Millennium Development Goals to child labor, considered one of Brazil’s most significant social issue. Regarding the third goal related to the promotion of gender equality, we translated the topic into the gender wage inequality and broaden the treatment of the issue to another type of labor discrimination such as ethnic wage disparities, both still deeply embedded in the Brazilian society. These questions are particularly important for Brazil, though the child labor has significantly reduced since the 1988’s Constitution. Hence, the dependent variable took three forms:
1. % o f Children not Workingi: Number of children (aged 10-15) who do not work/Number
of children (aged 10-15) in the total population, or the number of children who do not work per municipality (IBGE);
2. Gender Equalityi: Wage Ratio between Women and Men per municipality (Average Wage
of Woman Divided by Average Wage of Men) (IBGE);
3. Ethnic Equalityi: Wage Ratio between Non-White and White per municipality (Average
Wage of Non-White Divided by Average Wage of White) (IBGE).
The choice of the social conditions dependent variables used is based on the Social Progress Index’s dimensions. We use six variables covering some aspects of basic human needs, foundations of wellbeing and opportunity, translated into the issues of illiteracy, children conditions and standards of living, poverty and inequality. These questions are particularly important for Brazil, especially from the 2000s, when they became the target of the main social and income transfer programs implemented by the government (Programa Brasil Alfabetizado (PBA), Brasil Sem Miseria, Bolsa Familia, etc.). Thus, the dependent variable took six forms:
11Endogeneity tests made using lagged control variables as instruments (IBGE 2009 and 2008). No correlation between a predictor variable and the error term (no endogenous regressors). OLS and IV models presenting consistent and equivalent results. OLS can be considered consistent and efficient.
1. Literacy Ratei: Percentage of people aged 15 or over who can read and write, in the total
resident population of the same age group. (1-(Illiteracy Rate)/100)·100, population older than 15 per municipality;
2. Children with literate parentsi: (1-(Children with Illiterate Parents)/100)·100 per
munici-pality;12
3. Children with adequate housing and living conditionsi: (1-(Children living In Poor
Hous-ing Conditions)/100)·100 per municipality;13
4. Children with literate parents & adequate housing and living conditionsi: (1-(Children
with Illiterate Parents Living In Poor Housing Conditions)/100)·100 per municipality.
5. Less − Poverty Indexi: Percentage of not poor people on total population (1-Poverty
Incidence)
6. Equality Indexi: (1- GINI index)
Accordingly, a positive coefficient indicates a progress on labor standards and social conditions through a reduction in child labor and an increase in gender and ethnic wage equality (considering that men are better paid than women and that white are better paid than non-white), a reduction in the illiteracy rate, better housing and living conditions, smaller poverty and smaller GINI.
We also added control variables commonly assumed to affect labor conditions and that capture geographic and demographic aspects. Hence, a district with greater levels of GDP per capita, demographic density, urban population and closer to the state capital would be expected to present better child labor conditions but more substantial wage inequalities (Kuznets, 1971; Taques and Piza, 2009). Their use is justified by the need to isolate any local specificity of the municipalities analyzed, solve problems of heterogeneity and capture the influence of omitted variables such as economic development and regional inequalities. The controls can be defined as follows:
a) GDP per capitai: GDP data per capita per municipality (IBGE);
b) Distance f rom capitali: Data on distance of municipality from the state capital (IBGE);
c) Demographic Densityi: Demographic density per inhabitant/Km2 and per municipality
(IBGE);
d) U rban Populationi: The percentage of the urban population: Urban population/Total
population per municipality (IBGE). e) Fixed E f f ects: state
f) Dummy: state capitals
12Children with parents aged 15 or over who can read and write (IBGE).
13Adequate housing and living conditions: Households with sewers connected to the general network or septic tank; served from water from the general supply network; and waste disposal: collected directly or indirectly by cleaning services (IBGE).
The reason to include a dummy for state capitals and also the variable âdistance from capitalâ is that the model was overestimating the capacity of capitals to generate better performances than the rest of the state. After performing some tests with and without this dummy, we observed more robust results when we included it to the model, since the dummy might be correcting the overestimation of the capitals’ capacity. Moreover, the control of the impact of each state and each state capital on the variables under study might allow for a comparative analysis between Brazilian states and municipalities.
2.3 Descriptive Statistics
Table 1 shows some descriptive statistics of the data used in the study. It describes the values assumed by the municipalities for each variable in the study. In order to perform our log-linear analysis, being able to include zero values in the statistics and avoid any type of problems related to it, we proceeded a log(x+2) transformation.
Table 1: Descriptive Statistics - Labor and Social Outcomesâ variables
3 Empirical Results
To check if the MFTZ presented a certain efficiency concerning labor standards, positively impact-ing the state of Amazonas, the study was based on two econometric models: Model A (residuals analysis) and Model B (Stochastic Frontier). We will present the empirical results for each of these models below.
3.1 Residuals Analysis (MODEL A)
In this section, we are estimating the labor and social conditions in the MFTZ using the Residues estimations. The obtained parameters are illustrated in Tables 2 and 3
Among the variables of the labor regressions in Table 2, most of them were significant at least 10%. The statistics present results that are expected. As positive coefficients indicate improvement and negative coefficients indicate a worsening, an increase in the GDP per capita and in the Urban population brings an improvement in child conditions (1). However, we might note a sharper negative impact of more substantial Urban population and GDP per capita on the gender (2) and ethnic equality (3) variables if compared to the other control variables’ parameters. It could be explained by the fact that these two controls would be capturing more directly some negative outcomes of more developed urban conglomerates. Wealth and development cannot compensate for inequalities; on the contrary, growth is frequently accompanied by an increase of unequal distribution of revenue, confirming what is observed in the literature (Kuznets, 1971; Taques and Piza, 2009).
Moreover, a rise in the distance between the municipality and the capital causes a worsening in the three estimated labor variables, indicating that the farther the municipality is from the state capital, the worst the conditions might be perceived. A negative coefficient for child conditions (1) may also be perceived regarding the control variable Demographic density, suggesting that greater demographic agglomerations do not necessarily follow social development.
Analyzing results for the fixed effects and dummy in Table 2, capitals presented negative and significant parameters for two labor standards variables. Regarding the inequalities’ variables, the negative statistics for ethnic equality show results that are expected (Kuznets, 1971; Taques and Piza, 2009). The gender inequalities’ parameter is not significant. Considering child labor, the statistics illustrate that greater demographic density would be linked to a smaller percentage of children not working, which converges to the negative parameter obtained by the dummy Capital.
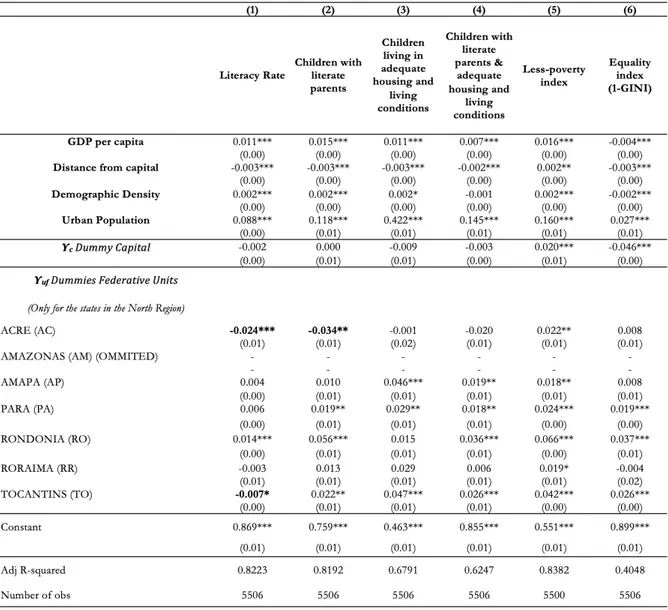
Considering the federative unit’s fixed effects, taking Amazonas (AM) as a reference, the regression analysis shows positive coefficients for labor standards for most of the other states located in the northern region, showing that they presented better performances than Amazonas, despite the presence of the MFTZ. It is possible that positive spillovers from the improvements in labor conditions in the free trade zone to other municipalities in Amazonas were weak or even inexistent, explaining its poor performance when compared to surrounding states and even to the rest of Brazil, as it will be examined in Section 3.4.
14In Tables 2 and 3 we decided to analyze only the states in the Northern region. The idea is to cover states with the most significant similarities with Amazonas. For complete tables (including all the UF fixed effects) see the Appendix, Tables 7 and 14.
Table 2: Labor Standards Regressions MODEL A14
Source: Self-Elaboration based on Census data (2010). Notes: Regressions are weighted by the square root of the number of people in a municipality. Standard errors (in parentheses) are robust to heteroskedasticity. * p < 0.10; **
Table 3: Social Regressions MODEL A
Source: Self-Elaboration based on Census data (2010). Notes: Regressions are weighted by the square root of the number of people in a municipality. Standard errors (in parentheses) are robust to heteroskedasticity. * p < 0.10; **
In Table 3, the statistics show positive coefficients when we analyze the control variables GDP per capita, Demographic Density and Urban population, except for the equality index that presented a negative parameter regarding the GDP per capita and the Demographic Density. We could also observe a more remarkable positive impact of more significant Urban population and GDP per capita on the estimated social variables if compared to the less noteworthy effects of the other controls included in the model. This might be justified by the fact that these two variables seize more directly the positive outputs of more developed urban conglomerates. Negative coefficients were observed for all the variables for social conditions studied when analyzed the Distance from the capital – except for the less-poverty index –, indicating that the farer is the district from its state capital, the worst conditions this municipality will tend to be exposed. More advanced urban areas are likely to follow better social advancements, attesting that most statistics present results that are expected.
Concerning the fixed effects and dummy in Table 3, capitals presented a positive and significant parameter for the less-poverty index, suggesting that capitals showed a smaller poverty incidence, and a negative and significant parameter for the equality index, indicating that the obtained coeffi-cients correspond to the expected results. Regarding the federative unit fixed effects’ parameters, most of the Amazonas coefficients presented worst performances than the other federative units in the north region and even in the rest of Brazil, despite the presence of the MFTZ, as it has been observed from the labor standards regressions.15
3.2 Stochastic Frontier Analysis (MODEL B)
In this section, we are estimating the labor and social conditions in the MFTZ using the Stochastic Frontier estimations. Results are presented in Tables 4 and 5.
The parameters σv, σµ and λ are significant and different from zero.16 There is therefore
inefficiency in the system.17 We can also state that the stochastic frontier and the residuals model present similar results in terms of significant variables. Among the variables of the labor regressions in Table 4, most of them were significant, at least 10%. We may perceive negative coefficients linked to inequalities (2) (3) when we analyze the control variables GDP per capita and Urban population. Moreover, we observe negative coefficients for the three labor standards variables regarding the Distance from capital and a negative parameter for children conditions (1) when considering the Demographic density.
15Amazonas’ municipalities presented better significant performances than the states in the northeast, which is the poorest region in Brazil, for Literacy Rate. However, despite these few positive results, Amazonas presented worst performances than most of the other federative units in Brazil for all the labor and social variables in the study. See the Appendix, Tables 7 and 14.
16
λ measure the relative importance of technical efficiency in relation to the term of idiosyncratic error. σvand σµ are respectively the variances of the zero-mean normal noise (disturbance term νi), and the pre-truncated inefficiency component’s distribution (technical inefficiency term µi).
17Recalling the use of the stata command s f cross, assuming normal distribution for component νiand t-normal distribution for component µiin order to correct any sources of bias in our parameters. Stochastic production model that provides estimators for the parameters of a linear model with a disturbance that is assumed to be a mixture of two components, which have a strictly nonnegative and symmetric distribution, respectively. See Kumbhakar and Lovell (2000) for a detailed introduction to frontier analysis.
Table 4: Labor Standards Regressions MODEL B18
Source: Self-Elaboration based on Census data (2010). Notes: Regressions are weighted by the square root of the number of people in a municipality. Standard errors (in parentheses) are robust to heteroskedasticity. * p < 0.10; **
Table 5: Social Regressions MODEL B
Source: Self-Elaboration based on Census data (2010). Notes: Regressions are weighted by the square root of the number of people in a municipality. Standard errors (in parentheses) are robust to heteroskedasticity. * p < 0.10; **
Regarding our social regressions in Table 5, an increase in the GDP per capita and in the Demographic density brings an improvement in most of the social indicators – except for the equality index – while a growth in the distance between the municipality and the capital causes a worsening in five of the estimated social variables – except for the less-poverty index. Considering the urban population, an increase in the urban/rural ratio brings an improvement to all six social indicators studied.
Regarding the fixed effects parameters in Tables 4 and 5, as already observed in Model A, the labor and social performances coefficients pointed to worst outcomes for Amazonas.
3.3 The Manaus Free Trade Zone’s Labor Effect in Manaus
In order to identify the origins of the Manaus effect, we predicted our estimations’ residuals and technical efficiency. Recalling that positive residuals indicated results were better than expected – which means that the observed results were better than the results estimated by the model – interpreted as a positive Manaus Effect; the technical efficiency represents the ratio between the observed municipality’s social performance and the average social performance predicted by the model.
Looking at the Manaus effect in the city of Manaus itself, we note Manaus’ performance is higher than the results predicted by the model for all the labor standards and social conditions’ variables. I.e., Manaus presented positive residuals for all the variables in the study (Model A).
Manaus is among the first six capitals when it comes to the approximation of figures predicted by the model for the % of children not working, the first regarding gender equality and the second capital for the ethnic equality. Regarding social conditions Manaus is among the first twelve capitals (from a total of 27 capitals) when it comes to the approximation of figures predicted by the model for the literacy rate, the tenth capital for the children with literate parents, the second for children living in adequate housing and living conditions, the fourth for children with literate parents living in adequate housing and living conditions, the fifth for less-poverty index and the third for the equality index. The positivity of residuals proves results were better than those estimated by the model (For the complete labor standards and social conditions capitals’ rankings, see the Appendix, Tables 10 and 17).
If we compare Manaus with the twenty municipalities with the highest industry Gross Value Added in Brazil in 2010, Manaus occupies the fifth position in the ranking regarding the percentage of Children not working, the second and the first positions respectively concerning gender and ethnic equalities. Concerning social conditions, Manaus is in the fourth position when it comes to the approximation of figures predicted by the model for the literacy rate, the third municipality for the children with literate parents and the first for children living in adequate housing and living conditions, children with literate parents living in adequate housing and living conditions, less-poverty index and the equality index (For the complete labor standards and social conditions twenty cities’ rankings, see the Appendix, Tables 11 and 18).
We may also comment on the inefficiency parameters generated by Model B, and how these results approximate the results obtained in Model A, recalling that the technical efficiency is the ratio between the observed average social performance of the municipalities and the average social performance predicted by the model.
Considering the labor standards inefficiency capital’s ranking, Manaus occupies the fourth position among the lowest inefficiency capitals for % of children not working, with a technical inefficiency of 0.55%. For gender and ethnic equalities, Manaus occupies the first position, with the lowest technical inefficiencies of 0.59% and 0.40%. Regarding the social inefficiency capital’s ranking, we can observe worst positions for Manaus regarding indicators of literacy.19 Manaus is at the eighteenth and fourteenth positions, with technical inefficiencies of 1.06% and 1.33% for the two literacy variables under study. In relation to the other social variables, we can observe Manaus relatively well classified, presenting the second lowest inefficiency parameter for children living in adequate housing conditions, the first for children with literate parents living in adequate housing conditions, the fifth for the less-poverty index and the third lowest inefficiency for the equality index, with inefficiencies of 0.68%, 0.12%, 0.49% and 0.52% respectively (For the complete labor standards and social conditions capitals’ rankings, see the Appendix, Tables 12 and 19).
Furthermore, when comparing Manaus with the twenty municipalities with the highest industry Gross Value Added in Brazil in 2010, it occupies the fourth, the third and the first positions respectively, among the municipalities with the lowest inefficency in all the three labor standards variables. Concerning social conditions, Manaus is at the ninth and fifth positions in the ranking regarding the two literacy variables under study and the first position concerning the two housing and living conditions variables, the less-poverty index and the equality index, being among the less ineficient municipalities. (For the complete labor standards and social conditions twenty cities’ rankings, see the Appendix, Tables 13 and 20).
3.4 The Manaus Free Trade Zone’s Labor Effect on the State
In terms of the Manaus effect on its surroundings, positive spillovers from the free trade zone to other municipalities in the state of Amazonas were probably weak or inexistent. As shown in Tables 2, 3, 4, 5 from models A and B, the coefficients for labor standards and social conditions in the Amazonas state are lower than for other Brazilian states, what can be attributed to the existing regional discrepancies regarding economic activities developed by the local labor force and significant social backwardness in numerous municipalities in the rest of the state.
As we evaluate Manaus’ neighboring municipalities, such as those closer to Manaus belonging to the meso-region of Centro Amazonense, although we observe higher levels of GDP and GDP per capita (Table 6), we note that the main economic activities developed in these territories seem to have little or no relation to the activities performed in the Manaus Industrial Pole. Agriculture, cattle and extractive activities are one of the primary sources of income of these municipalities. Moreover, the iron-ore activities are well-developed in the region, especially in municipalities bordering the state of Para. Although municipalities such as Coari and Presidente Figueiredo present significant participation of the industry in the local economy, overcoming the sectors of services and farming (Table 6), they are characterized by traditional industry activities, with low technological content (logging, textiles, food, fishing, ...), differing from the sectors of high technology (electronics, chemical, ...) installed in the Manaus industrial pole.
19Despite better performances of the state of Amazonas presented by our fixed effects when compared to states in the northeast region (see Table 16 in the Appendix)
Regarding the municipalities of the other meso-regions, even those well classified in the GDP and GDP per capita rankings of the Amazonian districts (Table 6), the meso-region Sudoeste Amazonense economically stands out for agriculture and cattle activities. Towns such as Tabatinga, however, presents a more developed tertiary sector (Table 6). The proximity to the Colombian border is a factor of dynamism in the region since traders buy their merchandise at lower prices in Colombia to resell at the local Brazilian market. Likewise, municipalities in the meso-regions Norte Amazonense and Sul Amazonense stand out for farming activities, the regions’ primary source of income (Table 6). However, these three regions have very deficient economic performances if compared to the east of Amazonas, confirming the economic backwardness prevalent in most of the state of Amazonas.
Table 6: Gross Value Added / GDP by sector, GDP and per capita GDP (2010) - 20 municipalities with the highest GDP in the state of Amazonas
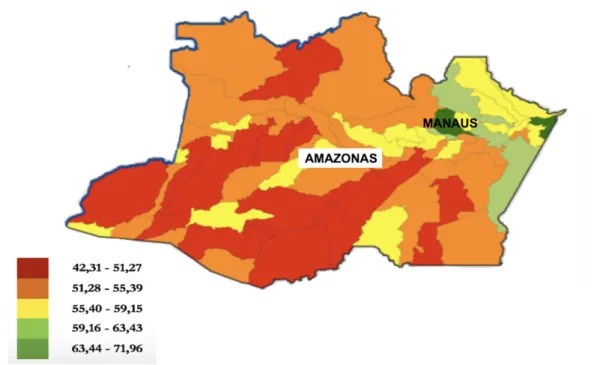
Regarding regional social disparities, Figure 1 presents an interesting reality: while the east of the state presented better indexes of social progress, following an industry-based development, a large extent of territories in the west presented the worst levels of social advancement.20
The main activities developed in most of the Amazonas’ municipalities are not related to the operations performed in the MFTZ; and besides, a large extent of Amazonas territories is occupied by the Amazon forest. Economically based on mining, farming and forestry rent, the majority of these districts, mainly located in the west of the state, experience significant urban development delay.21
Figure 1: Social Progress Index in the state of Amazonas
Source: Amazon Institute of People and the Environment - 2014 (Imazon)
20The Social Progress Index is an aggregate index of social and environmental indicators that capture three dimensions of social progress: Basic Human Needs, Foundations of Wellbeing, and Opportunity. It measures the extent to which countries provide for the social and ecological needs of their citizens, considering the well-being of a society by observing social and environmental outcomes directly rather than the economic factors. The social and environmental factors include wellness (including health, shelter and sanitation), equality, inclusion, sustainability and personal freedom and safety. The index is published by the nonprofit Social Progress Imperative, and is based on the writings of Amartya Sen, Douglass North, and Joseph Stiglitz.
21Moreover, according to Castilho et al. (2015), contrasting results on poverty and inequality reduction in Manaus and in the rest of Amazonas would be illustrating the benefits and the limits of the Manaus Free Trade Zone’s influence. The authors stress that while labor incomes (proportion of total monthly household income per capita earned from all households members’ jobs) played a crucial role in reducing poverty and inequality in the municipality of Manaus over the years 2000-2010, this is not the case in the rest of the state of Amazonas, where non-labor income (retirement, pensions, rents, social transfers, unemployment insurance and others) explained the decline of poverty and inequality. This reality might confirm the hypothesis in which its positive impacts seem to remain within Manaus.
Our analysis confirms the findings in Model A; that the positive Manaus effect on labor standards and social conditions is real, but it remains stuck inside Manaus.
We conclude this investigation by verifying the correlation between the εiof Model A and the
µi of Model B, recalling that εi= νi− µion Figure 2.
The graphs show a strong negative correlation between the term of error εifrom Model A and
the technical inefficiency µifrom Model B, following an exponential relationship and converging
to what is expected by the literature. Thus, we deduce that the residuals obtained in Model A would be suffering a little random influence, indicating that residuals deviations would be capturing the system’s efficiency and guaranteeing robustness in both models.
Figure 2: Correlation between εiand the µi
4 Conclusion
The creation of the Manaus Free Trade Zone had a development purpose in the Brazilian political, economic and social scenario between 1960 and 1970. This industrial pole was an important device in achieving the desired development, populating a region considered, at the time, deserted and protecting it from external threats. It has guaranteed the development of labor standards in the Manaus district and has become the main driving force behind regional employment, higher salaries and growth over the last decades.
This investigation confirms the existence of a positive Manaus social effect due to the rigid checks conducted by SUFRAMA and the strict respect of labor standards applied to the MFTZ. Hence, the residuals analysis in Model A suggested Manaus presented better results than the model’s prediction, which corroborates with the hypothesis of the existence of a positive Manaus effect in terms of labor and social outcomes. Concerning results obtained in Model B, they are quite similar to those obtained in Model A. The stochastic frontier analysis showed Manaus had superior performances in most labor and social indicators, confirming the conclusions already taken from Model A.
Nonetheless, the persistence of significant inequalities among Amazonas’ municipalities would be attesting that the benefits of the MFTZ’s model do not cross the borders of the Manaus’ district. The high performances of Amazonas in comparison to other states regarding income generation and labor came from Manaus and most of the positive outcomes in the Manaus Industrial Pole could not compensate for the regional inequalities and socioeconomic backwardness in numerous municipalities in the rest of the state. When analyzing Manaus’ neighboring towns, although we observe higher economic performances, we note that the main economic activities developed in these territories seem to have little or no relation to the activities developed in the Manaus Industrial Pole. Farming and extractive activities are the primary sources of income of these municipalities, like in the rest of the Amazonas state. These findings indicate economic linkages in the region are still weak and justify the worst estimations obtained by Amazonas when compared to other states in the northern region and in the rest of Brazil, making us reject the hypothesis about the existence of significant positive spillovers from Manaus to its surroundings.
A Labor Standards
Table 7: Labor Standards Regressions MODEL A
Source: Self-Elaboration based on Census data (2010). Notes: Regressions are weighted by the square root of the number of people in a municipality. Standard errors (in parentheses) are robust to heteroskedasticity. * p < 0.10; **
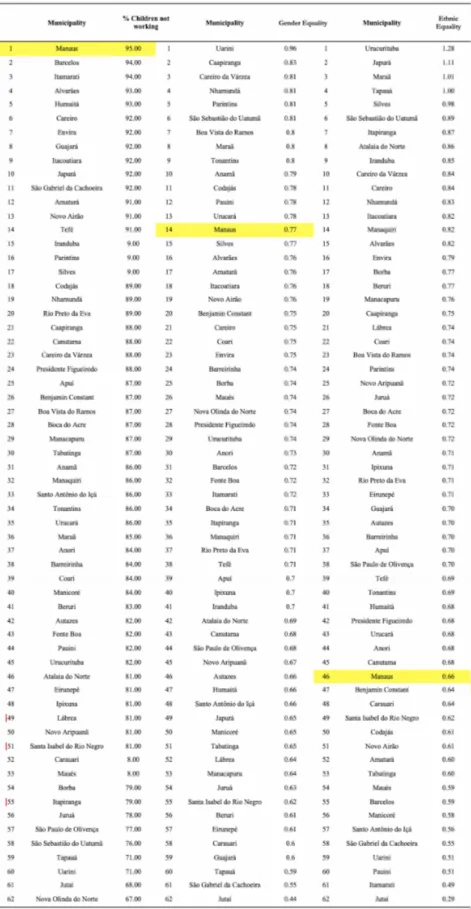
Although Manaus presented strong labor efficiency, occupying top positions in the rankings of capitals and large industrial conglomerates regarding child labor’s reduction and greater gender and ethnic equality, these good performances were not capable of improving the Manaus’ positions in comparison with other municipalities of the state in terms of inequalities. Large urban conglom-erates tend to concentrate higher levels of disparities (Kuznets, 1971; Taques and Piza, 2009), a fact that explains the worst statistics presented by Manaus when compared to municipalities in the rest of Amazonas (Table 8).
Table 8: Ranking Labor Standards of Amazonas cities
Table 9: Labor Standards Regressions MODEL B
Source: Self-Elaboration based on Census data (2010). Notes: Regressions are weighted by the square root of the number of people in a municipality. Standard errors (in parentheses) are robust to heteroskedasticity. * p < 0.10; **
Table 10: Ranking of Labor Standards Residuals (Model A) - per capital (2010)
Table 11: Ranking of Labor Standards Residuals (Model A) - per 20 municipalities with the highest industry Gross Value Added in Brazil, per variable (2010)
Table 12: Ranking of Labor Standards Inefficiency (Model B) - per capital (2010)
Table 13: Ranking of Labor Standards Inefficiency (Model B) - per 20 municipalities with the highest industry Gross Value Added in Brazil, per variable (2010)
B Social Conditions
Table 14: Social Regressions MODEL A
Source: Self-Elaboration based on Census data (2010). Notes: Regressions are weighted by the square root of the number of people in a municipality. Standard errors (in parentheses) are robust to heteroskedasticity. * p < 0.10; **
Despite Manaus’ social efficiency, the worst statistics presented by Manaus when compared to municipalities in the rest of Amazonas (Table 15) regarding the GINI index might be explained by the theory, in which large urban settlements tend to concentrate higher levels of inequalities (Kuznets, 1971; Taques and Piza, 2009).
Table 15: Ranking of Social Indicators of Amazonas cities
Table 16: Social Regressions MODEL B
Source: Self-Elaboration based on Census data (2010). Notes: Regressions are weighted by the square root of the number of people in a municipality. Standard errors (in parentheses) are robust to heteroskedasticity. * p < 0.10; **
Table 17: Ranking of Social Indicators Residuals (Model A) - per capital (2010)
Table 18: Ranking of Social Indicators Residuals (Model A) - per 20 municipalities with the highest industry Gross Value Added in Brazil, per variable (2010)
Table 19: Ranking of Social Indicators Inefficiency (Model B) - per capital (2010)
Table 20: Ranking of Social Indicators Inefficiency (Model B) - per 20 municipalities with the highest industry Gross Value Added in Brazil, per variable (2010)
References
Aggarwal, A. (2007). Impact Of Special Economic Zones On Employment, Poverty And Human Development. Working Papers id:1111, eSocialSciences. URLhttps://ideas.repec.org/p/ess/
wpaper/id1111.html.
Aggarwal, A. (2012). Social And Economic Impact Of SEZs In India. Number 9780198077275 in OUP Catalogue. Oxford University Press. URL https://ideas.repec.org/b/oxp/obooks/ 9780198077275.html.
Aigner, D., Lovell, C., and Schmidt, P. (1977). Formulation And Estimation Of Stochastic Frontier Production Function Models. Journal of Econometrics, 6(1): 21–37. URL https:
//EconPapers.repec.org/RePEc:eee:econom:v:6:y:1977:i:1:p:21-37.
Baldwin, R. (2013). Trade And Industrialization After Globalization’s Second Unbundling: How Building And Joining A Supply Chain Are Different And Why It Matters, pages 165–212. University of Chicago Press. URLhttp://www.nber.org/chapters/c12590.
Boyenge, J.-P. S. (2007). ILO Database On Export Processing Zones (Revised). ILO Working Papers 993989593402676, International Labour Organization. URLhttps://ideas.repec.org/p/ilo/
ilowps/993989593402676.html.
Buitelar, R., Urrutia, R., and Padilla, R. (1999). Industria Maquiladora Y Cambio Tecnico. Revista CEPAL, (67): 133–152. URL https://repositorio.cepal.org/bitstream/handle/11362/ 12172/067133152_es.pdf?sequence=1&isAllowed=y.
Busso, M., Gregory, J., and Kline, P. (2013). Assessing The Incidence And Efficiency Of A Prominent Place Based Policy. American Economic Review, 103(2): 897–947. URL http:
//www.aeaweb.org/articles?id=10.1257/aer.103.2.897.
Castilho, M. R., Melo, H. P., and Di Sabbato, A. (2010). Um Olhar De Genero Sobre O Setor Eletro-Eletronico Da Zona Franca De Manaus. In I. E. (Org.) (Ed.), Um olhar de genero sobre o setor eletro-eletronico da Zona Franca de Manaus, pages 11–54. 1 edition. URL
http://www.equit.org.br/novo/wp-content/uploads/2013/03/um-olhar-de-genero-sobre.pdf. Castilho, M. R., Menendez, M., and Sztulman, A. (2015). Poverty And Inequality Dynamics In
Manaus: Legacy Of A Free Trade Zone? Working Papers DT/2015/18, DIAL (Developpement, Institutions et Mondialisation). URLhttps://ideas.repec.org/p/dia/wpaper/dt201518.html. Cling, J.-P., Razafindrakoto, M., and Roubaud, F. (2005). Export Processing Zones In Madagascar:
A Success Story Under Threat? World Development, 33(5): 785–803. URLhttps://ideas.repec.
org/a/eee/wdevel/v33y2005i5p785-803.html.
Defever, F., Reyes, J. D., Riano, A., and Sanchez-Martin, M. E. (2018). Special Economic Zones And Their Compliance With Wto Subsidy Rules. Discussion paper, Latin America and Caribbean Economic Association.
Defever, F., and Riano, A. (2017). Subsidies With Export Share Requirements In China. Jour-nal of Development Economics, 126(C): 33–51. URL https://ideas.repec.org/a/eee/deveco/ v126y2017icp33-51.html.
Farole, T. (2011). Special Economic Zones: What Have We Learned? Discussion paper 64, The World Bank.
Farole, T., and Akinci, G. (2011). Special Economic Zones: Progress, Emerging Challenges, And Future Directions. Directions in development and trade. Washington, DC: World Bank. Fias (2008). Special Economic Zones: Performance, Lessons Learned, And Implications For Zone
Development. Discussion paper, The Multi-Donor Investment Climate Advisory Service, The World Bank, Washington DC, USA.
Freitas Pinto, R. (1987). Como Se Produzem As Zonas Francas. (mineo), UFPA/ Naea, Belem (PA), Brasil.
Ham, J. C., Swenson, C., Imrohoroglu, A., and Song, H. (2011). Government Programs Can Improve Local Labor Markets: Evidence From State Enterprise Zones, Federal Empowerment Zones And Federal Enterprise Community. Journal of Public Economics, 95(7): 779–797. URL
https://ideas.repec.org/a/eee/pubeco/v95y2011i7p779-797.html.
Heller, J., and Kauffman, K. (1963). Tax Incentives For Industry In Less Developed Countries. Law School of Harvard University. URLhttps://books.google.fr/books?id=lEEwAAAAMAAJ. Kumbhakar, S., and Lovell, C. (2000). Stochastic Frontier Analysis. Cambridge University Press.
URLhttps://doi.org/10.1017/CBO9781139174411.
Kuznets, S. (1971). Economic Growth Of Nations: Total Output And Production Structure. Belknap Press of Harvard University Press. URLhttps://books.google.fr/books?id=bjB7Ad8in4MC.
Meeusen, W., and Broeck, J. V. (1977). Efficiency Estimation From Cobb-Douglas Production Functions With Composed Error. International Economic Review, 18(2): 435–444. ISSN
00206598, 14682354. URLhttp://www.jstor.org/stable/2525757.
Naughton, B. (2007). The Chinese Economy: Transitions And Growth. The Chinese Economy. MIT Press. URLhttps://books.google.fr/books?id=BZv6AQAAQBAJ.
Picarelli, N. (2014). Who Really Benefits From Export Processing Zones? Evidence From Nicaraguan Municipalities. Mimeo, London School of Economics.
Ravallion, M. (2003). In Measuring Aggregate "Social Efficiency". Policy Research Working Paper Series 3166, The World Bank. URLhttps://ideas.repec.org/p/wbk/wbrwps/3166.html. Siroen, J.-M. (2012). Core Labour Standards And Exports. Working paper UMR 225 DT/2012-18,
DIAL - Universite Paris-Dauphine/IRD, Paris, France.
Siroen, J.-M., and Yucer, A. (2014). Trade Performance Of Free Trade Zones. Working paper 2014-09, DIAL - Universite Paris-Dauphine/IRD, Paris, France.
Siroen, J.-M., Yucer, A., and Archanskaia, E. (2014). World Ftz Database. Discussion paper. URL
http://ftz.dauphine.fr.
Taques, F. H., and Piza, C. T. (2009). Curva De Kuznets: Mensuracao Do Impacto Do Crescimento Economico Sobre A Desigualdade De Renda Para Os Estados Brasileiros (1995–2005). In XIV Encontro Regional de Economia do Nordeste. Fortaleza, CE.
Teixeira, L. C. (2013). A Zona Franca De Manaus: Evolucao E Resultados. Monografia (bacharel em economia), Universidade Federal do Rio de Janeiro, Rio de Janeiro (RJ), Brasil.
Teixeira, L. C. (2014). Export Processing Zones In Madagascar: The Impact Of The Dismantling Of Clothing Quotas On Employment And Labor Standards. Mini-memoire, Universite Paris-Dauphine, Paris, France.