LieAlR
8 D PA}
ADSORPTION OF BINARY GAS MIXTURES
by
David W. Bareis
Submitted in Partial Fulfillment of the Requirements
for the Degree of
MASTER OF SCIENCE
from the
MASSACHUSETTS INSTITUTE OF TECHNOLOGY
1947
Signature of Professor in bcharge of research Signature of Head of Department Signature of AuthorCambridge, Massachusetts
November 15, 1946
Mr. George W. Swett
Secretary of the Faculty
Massachusetts Institute of Technology
Dear Sir:
The author wishes to submit this thesis, entitled, "Adsorption of Binary Gas Mixtures", in partial
fulfillment of the requirements for the degree of Master of Science in Chemical Engineering.
Sincerely yours,
ACKNOWLEDGENENTS
The author is deeply grateful to Dr. E. R.
Gilliland for his interest in this work, and for his valuable advice. The author is grateful to B. Chertow for his unfailing interest and for his helpful
assistance and advice, given so generously during
this investigation. Thanks are extended to W. H.
TABLE OF CONTENTS Summary ... ... Introduction ... Procedure ... Result s... Discussion... Conclusions... Recommendations... Appendix... Calculated Data... Sample Calculations Original Data... Nomenclature... Literature Citations... .. o...1
... 3
... 13 ... 20 ... 52 .. 89 ... 92 ... 93 ... 94 ... 99 ... 104 ... 108SUMMARY
The gas-adsorbate equilibria of ethylene-propane and
ethylene-propylene mixtures on silica gel at 000C, 2500 and 400C and at one atmosphere total pressure were determined,
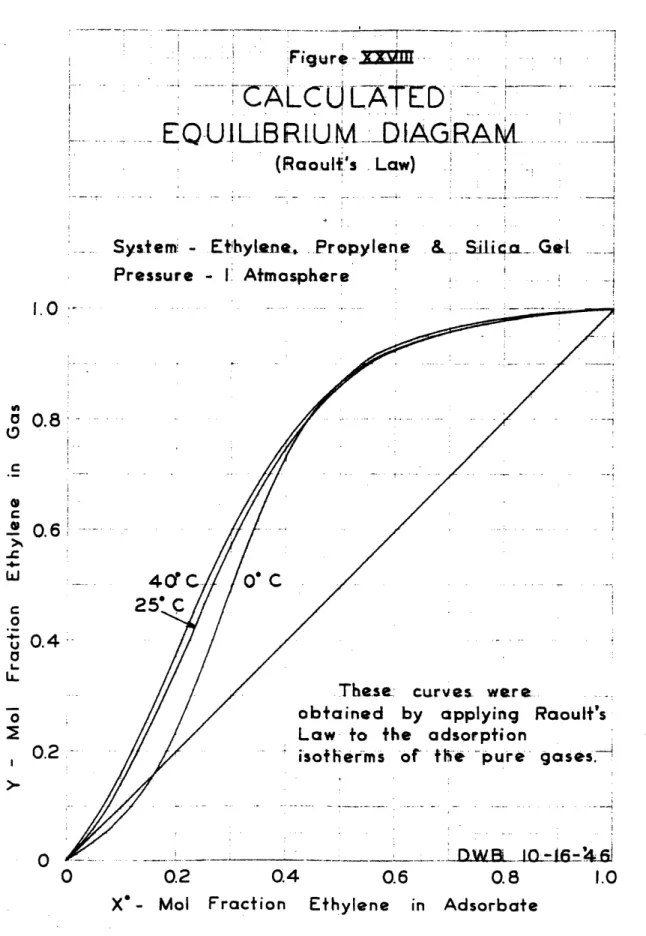
and the results were correlated by a modified Van Laar procedure. The modified Van Laar correlation, which has little theoretical basis, requires the isotherms of the
pure gases between 0 and 760 mm. Hg pressure and at least
two experimental mixture points at the same temperature.
The relative volatilities of ethylene with respect to propane on silica gel are approximately two and those of ethylene with respect to propylene are approximately eight.
In the temperature range from 000 to 40C the relative volatilities for both systems decreased slightly with
increasing temperature.
The calculated differential heats of adsorption for
the pure gases fell mostly between 6,000 and 7,000 calories per gram mol of gas adsorbed. The adsorption of ethylene,
propane and propylene on silica gel is unimolecular and represents physical adsorption.
A volumetric method was used to obtain the adsorption
data. Equilibrium was approached very closely in the
mixture runs. The ethylene and propane isotherms represent true equilibrium. Hysteresis and drift evident during the propylene isotherm runs were probably caused by the
impurities in the propylene used in this investigation. The propylene adsorption data should be checked with pure propylene, to determine what effect, if any, the impurities
had on the propylene results reported herein.
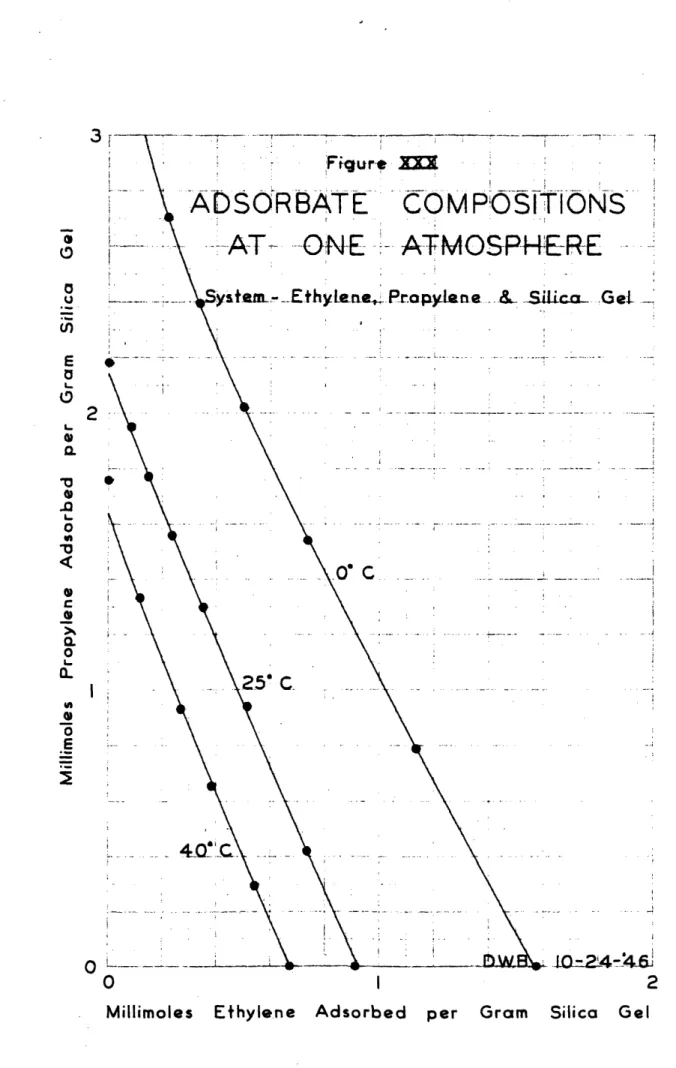
During any isothermal chan6e in adsorbate
composition
at one atmosphere of pressure, the ratio of the amount of
propane transferred to the amount of ethylene transferred
is equal to a constant. This constant is equal to the
ratio
of the amount of pure propane adsorbed to the amount
of pure ethylene adsorbed at one atmosphere and at the
same temperature as the mixture.
Both the chemical structure and the molecular weight
are factors which determine the adsorption of a gas on
silica gel. Olefins are attracted more strongly to the
silica gel than paraffins and
heavy molecules are attracted
more strongly than light molecules.
It is possible to calculate the number of theoretical
equilibrium steps required to separate a binary gas mixture
into its two components by an adsorption process similar to
fractional distillation. A method is outlined in the
'Discussion' and is similar to the method used to calculate
the number of theoretical plates required by a distillation
column.
INTRODUCTION
At the interface between a solid and a gas, the
concentration of the gas molecules is usually greater than in the gas phase beyond. The gas molecules on the solid surface are said to be 'adsorbed'. The solid which takes up the gas is called the 'adsorbent', the gas attached to the
surface of the solid is called the 'adsorbate'. When the solid surface can take up only one molecular layer of
adsorbate the adsorption is called 'unimolecular'; when more
than one layer is adsorbed, it is called 'multimolecular'. An atom located in the surface of a solid is subjected to unbalanced forces, the inward pull being greater than
the outward forces. When an atom or molecule of the adsorbate
saturates some of the unbalanced forces of the surface, heat is generally evolved. The enthalpy change for a system
undergoing adsorption is called the 'heat of adsorption'. When a gas attaches itself to the surface of a solid, there
is either a weak interaction between the solid and gas,
similar to condensation, called 'physical adsorption', or
a strong interaction, similar to chemical reactions, called
'chemical adsorption' or 'chemisorption'. In physical adsorption the heat of adsorption is of the same order of magnitude as the heat of condensation of gases, in chemi-sorption as the heats of chemical reactions. The heat of
adsorption is most frequently expressed as calories evolved per mole of gas adsorbed.
When a gas is admitted to an evacuated adsorbent,
The pressure of the
gas
continues to fall for a period which may be anything from a few seconds to many weeks, depending on the state and nature of the system under consideration.In the ideal case adsorption is a reversible process, and
the amount adsorbed at a given pressure is independent of the side from which equilibrium has been approached. In practice, however, the adsorption and desorption curves
frequently do not coincide - a phenomenon termed 'hysteresis'.
Hysteresis is often accompanied by a great decrease in the
rate of approach to equilibrium - an effect which is called
'drift'. The amount of gas adsorbed per gram of adsorbent
at equilibrium is a function of the temperature, the pressure, and the nature of the adsorbent and the adsorbate. The amount adsorbed is usually expressed as the number of moles taken
up per gram of adsorbent.
When the pressure of the gas is varied and the
temper-ature is kept constant, the plot of the amount adsorbed
against the pressure is called the 'adsorption isotherm'.
This relation is determined most frequently in adsorption
investigations. When the temperature is varied and the pressure is kept constant, one obtains the 'adsorption isobar'. The variation of the equilibrium pressure with
respect to the temperature for a definite amount of gas
adsorbed is expressed by means of the 'adsorption isostere'.
The most common method of making adsorption measure-ments is the volumetric method. The adsorbent is contained
in a suitable chamber connected to the necessary manometers and measuring burettes. The volume not occupied by the
adsorbent in the adsorbent bchamber is referred to as the
'dead space'. After preliminary evacuation a known quantity
of the gas under test is admitted to the adsorbent chamber.
The pressure in the dead space is read when equilibrium is
reached, and knowing the volume of the dead space, the
quantity of unadsorbed gas can be calculated. By subtracting
this from the total quantity of gas admitted, the amount of
gas adsorbed can be obtained. This method is satisfactory
when the pressure in the dead space is low. At high pressures the amount of unadsorbed gas becomes an appreciable
proportion of the quantity adsorbed, and may even exceed it.
Errors in evaluating the volume of the dead space are then
reflected in the values for the amount adsorbed. The point
at which the amount of unadsorbed gas exceeds the amount
adsorbed depends on the design and packing of the adsorbent chamber and on the nature of the adsorbent and adsorbate.
In the dynamic method, a current of negligibly
adsorbed gas, charged with the gas under test to a known partial pressure, is drawn through a tube packed with adsorbent until the issuing stream is identical in
composition with the entering one. The amount adsorbed is
then determined by direct weighing, the partial pressure of the adsorbed gas in the mixture being taken as the
equilibrium pressure.
In order to eliminate the dead space difficulty at high pressures, the amount adsorbed is often determined by
direct weighing. The success of this method is largely due
It consists essentially of a quartz spring, on the end of
which is hung a bucket, containing the adsorbent, and the
whole placed in a glass tube. Increases in weight are
followed by measuring the increase in the length of the
spring.
Obtaining adsorption measurements for gas mixtures,
requires a modified procedure. Usually the composition of
the unadsorbed gases is quite different from
that
of the
adsorbate. This makes it necessary to mix the unadsorbed
gases thoroughly and continuously, and to increase
the
contact
time between the adsorbent and unadsorbed gases for
attaining equilibrium. After equilibrium is reached, the
unadsorbed gases must be measured and analyzed. Knowing the
total quantity of each gas used and the quantity of each
gas unadsorbed, the composition of the adsorbate may be
determined
by
a material balance. An alternate method
employs the degassing of the adsorbent and the analyzing
of
this gas.
If the surface of an adsorbent holds only physically
adsorbed gas, the purification is quite simple. Moderate
heating and complete evacuation of the system are sufficient
to overcome the binding forces between adsorbent and
adsorbate. One of the most effective methods of purifying
the surface prior to physical adsorption is to adsorb and
pump off repeatedly the gas whose adsorption is to be
studied. The
removal of chemisorbed gas is much more
difficult. Often complete removal is impossible without
permanently
injuring the surface of the adsorbent.
both isothermal and adiabatic calorimeters have been used.
In the isothermal calorimeter the heat evolved is allowed
to produce a phase
change,
such as the melting
of ice. In
the adiabatic calorimeter the heat evolved is calculated
from the temperature rise of the system. In addition to
these direct methods of measuring the heat of adsorption,
the differential heat may be calculated indirectly with
the aid of the Olausius-Clapyron equation,
al1n
p
q
La(1/T-)]n - R
This assumes that the substance acts as a perfect'gas when
in the gaseous state, 'p'
being the equilibrium pressure of
the gas phase in equilibrium with 'n' moles of adsorbate at
the absolute temperature 'T'. 'q'
is the differential heat
of adsorption,
'R'
being the perfect gas law constant.
Generally, the differential heat of adsorption decreases as
the quantity adsorbed increases. This indicates that the
first molecules condensing saturate the strongest attractive
forces on the solid surface.
The earliest correlation of adsorption with certain
physical properties of the adsorbed gases was made in 1814
by de Saussure
(3)
who found that the most easily
condensible
gases are adsorbed in the largest quantities by a given
adsorbent. The adsorbabilities of different gases on a given
adsorbent run roughly parallel to the solubilities of the
gases in water, to their critical temperatures, and to their
van der Waals constants. Ohemisorption is specific, and
At constant temperature the adsorption of a gas increases
with increasing pressure. For many systems at small
adsorptions, the amount adsorbed increases linearly with
pressure. This is analogous to Henry's Law for the solubility
of gases in liquids. In other instances, Henry's Law does not
appear to hold even at very low pressures and concentrations.
In the majority of cases, the amount adsorbed at a given
pressure is lower than it would be if Henry's Law applied
-in other words, the adsorption isotherm is concave to the
pressure axis.
One of the earliest attempts to give quantitative
formulation to the adsorption isotherm beyond the Henry's
Law region is the so-called Freundlich isotherm,
n= kpc
where 'n'
is the amount adsorbed per unit weight of adsorbent
under an equilibrium pressure of 'p', while 'k'
and 'a'
are
constants for a given system at a given temperature,
'c'
being always less than unity. The equation is purely
empirical and cannot in any case cover the whole isotherm,
for it does not reduce to the Henry relation characteristic
of low-pressure adsorption. At still higher adsorptions the
amount adsorbed increases only slightly with pressure. The
surface apparently becomes saturated with the adsorbate.
Since the adsorption process
is generally exothermic,
the amount adsorbed at equilibrium decreases with increasing
temperature according to the principle of Le Chatelier. In
terms of the
Freundlich isotherm 'k' diminishes and
'c'
implies that Henry's Law is more nearly obeyed as the
temperature increases.
The quantity of a gas adsorbed by a given weight of
adsorbent varies greatly from one adsorbent to another. The
variation in adsorption must be due to at least two factors:
the area of the interface, and the chemical nature of the
solid surface.
The more common adeorbents are activated
carbon, silica gel and other gels, chabasite and other
zeolites, clays, glass, metals and crystal surfaces. In
this investigation silica gel was used as the adsorbent.
Silica gel is prepared from the coagulation of a colloidal
solution of silioic acid. Some of the industrial uses of
silica gel are: dehydration and purification of air and
industrial gases; air conditioning; refining of petroleum
distillates; gas masks; catalyst carrier. Silica gel has a
marked affinity for water vapor, which it adsorbs up to
40 per cent of its weight.
Before the modern work on crystal structure had been
brought to fruition,
it
was believed that the range of
molecular forces was very considerable. Some theories of
adsorption, of which the best known is Polanyi's (8), were
worked out on this assumption. According to his view, the
forces of attraction reaching out from the surface are so
great that many adsorbed layers can form on the surface.
Since the.theory does not attempt to formulate an isotherm
equation, the scope of information obtainable from it is
limited.
10
a solid indicates that the forces responsible for adsorption
fall off very rapidly with distance, and become negligible
at distances very little greater than the diameter of a
molecule. Thus theadsorbed layer does not exceed one
molecule in thickness,
except under special conditions.
Langmuir (5) arrived at this view from the following
considerations. X-ray examination of crystals suggests that
the forces holding together the atoms in the crystal must
be of short range and identical with the valency forces
holding together the atoms in a chemical compound. These
forces emanate from all aides of an atom, so that at the
surface of the crystal there will be unbalanced forces,
which will be capable of attracting molecules of a foreign
substance and holding them at the surface so as to form a
kind of extension of the space lattice.
According to Langmuir's (5)
theory, a gas undergoing
adsorption will obey the following equation,
abp
n
=1
+
b
p
where 'n' is the amount adsorbed per unit weight of adsorbent
at an equilibrium pressure 'p'. 'a'
and 'b'
are constants
depending on the temperature and the nature of the system.
The Langmuir equation is perhaps the most important single
equation in the field of adsorption. Although there are at
present isotherm equations that fit experimental data which
do not obey the Langmuir equation, and others that fit the
data over a wider range, in most cases the starting point
in their derivations is the Langmuir equation.
11
was propounded in two papers; one by Brunauer, Emmett and
Teller (1) in 1938, the other by 'Brunauer, Demin6, Deming
and Teller (2) in 1940. It is based on the assumption that
the same forces that produce condensation are also chiefly
responsible for the
binding energy of multimolecular
adsorption. This theory is the first attempt to give an
unified theory of physical adsorption. Its most general
equation includes
five isotherm types as special cases and
describes the shape of each isotherm type through the entire
range of adsorption, from zero pressure to saturation
pressure, whereas previous equations have dealt only with
one type of isotherm at a time.
The adsorption of gas mixtures is of immense practical
importance. Most technical applications of adsorption
processes involve gas mixtures rather than one gas alone.
The charcoal in gas masks must remove small amounts of war
gases from a large excess of air. In the recovery of solvent
vapors like petroleum ether, benzene and alcohol, the
organic vapor is removed from air. The phenomenon of mixed
adsorption is encountered in the recovery of acetone, ethyl
and butyl alcohol from waste gases produced in fermentation
processes; in the recovery of benzene and light oil from
illuminating gas; in the purification of air in submarines;
in the purification of other gases, such as carbon dioxide,
hydrogen and ammonia; and in the refining of helium. These
are examples of mixed physical adsorption; mixed
chemi-sorption forms the basis of many important industrial
Natural gas and refinery gases are becoming increasingly
important as raw materials for the manufacture of many
different chemical products. These hydrocarbon gases occur
as mixtures and must be separated into their individual
components for use in chemical manufacture. The lighter
components require refrigeration, which is costly, and
pressure, which decreases their relative volatilities, for separation by conventional fractional distillation.
Adsorption was suggested as a possible means of separating these gases at ordinary temperatures and pressures. The present investigation studied the equilibrium of two binary
systems of these light hydrocarbons on silica gel.
Gas-adsorbate equilibrium can be treated similarly to
vapor-liquid equilibrium. The mol fraction of the more volatile component in the gas can be plotted against the
mol fraction of the more volatile component in the adsorbate to obtain an 'equilibrium diagram' or
'Y-X
curve'. The'relative volatility', W&, can be calculated for
gas-adsorbate equilibrium in the same manner it is calculated for vapor-liquid equilibrium, that is,
Y,(.1-X ) = X1 .(1-Y,)
where Y, is the mol fraction of the more volatile component in the gas and X, is the mol fraction of the more volatile
component in the adsorbate. In the cases where the relative
volatility for adsorption is different from that for
distillation at the same pressure, the adsorbent is said to
be 'selective' toward the component whose volatility has been
13
PROCEDUREThe adsorption isotherms for the pure gases were
obtained by the volumetric method. Figure I shows a sketch
of the apparatus used. Additional apparatus consisted of a vacuum pump, standard gas analysis pipettes, and a constant temperature water bath with a circulating pump attached to the thermostat. The adsorbent was a Refrigeration Grade silica gel, 14/20 mesh, supplied by the Davison Chemical Corporation, Baltimore, Maryland. The gases used were C.P. grade ethylene, C.P. grade propane and 97% pure propylene obtained from the Matheson Company, East Rutherford, New Jersey.
The apparatus is prepared for making adsorption measure-ments as follows. One gram of silica gel is weighed to the nearest tenth of a milligram and placed in the adsorbent
U-tube. Glass wool plugs weighing less than 30 milligrams are packed lightly into each arm of the adsorbent U-tube above
the silica gel. The adsorbent U-tube is then sealed into the
apparatus as shown in the sketch. The adsorbent dead space includes the capillary tubing running from the premix
chamber to the vacuum pump stopcock and the free space in
the capillary above the mercury level in the reservoir-manometer. The dead space is evacuated while the adsorbent
is heated by a glycol-water mixture bath boiling between
160-1700C. The adsorbent is cooled and the gas under test
is admitted to the adsorbent until a pressure of one
atmos-phere is reached in the dead space. The dead space is
evacuated and heated again. By repeating this performance
free from impurities such as air and water vapor. The dead
space is then sealed off by closing the stopcocks. If the
pressure in the dead space as read from the
resaervoir-manometer remains a vacuum over night, the system can be
considered sealed properly.
The gas under
test
must be purged through the inlet
stopcock and out past the analysis pipettes for a few
minutes to insure the
removal of gas impurities from the
inlet lines. The premix chamber, adsorption burette, and
capillary lines to the gas inlet stopcock are
completely
filled with mercury. A sample of the gas under test is
brought into the adsorption burette. The mercury in the
capillary between the premix chamber
and adsorption burette
is displaced by the gas. The gas sample is adjusted to
atmospheric pressure by means of the compensator manometer.
After the initial volume reading is made the compensator
tube is sealed off by closing the pinch clamp above the
manometer. Then
the burette temperature and atmospheric
pressure are recorded.
Data for an isotherm is collected as follows. The
adsorbent thermostat is regulated to the temperaturedesired. An ice bath is used for the 00C isotherms. The
25*0
isotherms are made with the water bath regulated to
within +.020, and the 40'0 isotherms are made with the
water bath regulated to within +*.lOC.
The mercury level
above the reservoir-manometer is fixed always at a point
in the vertical capillary to insure a constant dead space
16
reservoir-manometer to obtain the correction term for
subsequent pressure readings. A few milliliters of gas are taken from the adsorption burette to the premix chamber, and then are let slowly into the adsorbent chamber. Equilibrium is reached usually in about two minutes. Constant pressure in the dead space is used as a sign of equilibrium attained.
The dead space pressure is read from the reservoir-manometer. The volume of gas admitted is read from the
adsorption burette after the pressure of the gas in the burette is balanced against the compensator tube. The
compensator tube eliminates the necessity of taking pressure and temperature readings for the gas in the burette each time a sample of gas is admitted to the adsorbent. Samples of gas are admitted to the adsorbent until the dead space pressure is one atmosphere. Desorption points are obtained by returning increments of the ps to the adsorption burette
by means of the desorption pump. The silica gel then is freed from gas by evacuation and heating, as in the initial
preparation of the gel for adsorption measurements.
The dead space is determined in a manner similar to
running an adsorption isotherm, except that an inert gas,
helium, is used. The helium is purged through charcoal
cooled by liquid air, in order to remove all adsorbable impurities. The dead space is calculated, assuming the
perfect gas law governs, at three different pressures, and an average value is used. The dead space must be determined at each isotherm temperature, since the capillaries are
17
The moles of gas in the dead space and adsorbed on the
silica gel are found from the volume of the gas admitted by
means of the perfect gas law. By using the compensator tube, the moles of gas admitted can be calculated by multiplying the volume decrease in the burette by a constant factor.
The moles of gas in the dead space are also calculated by
the perfect gas laws from the dead space pressure and
volume. The moles of gas adsorbed are determined by
subtracting the moles of gas in the dead space from the total moles of gas admitted.
The binary gas mixture runs are made as follows. A
predetermined volume of each gas under test is first taken into the adsorption burette. The volume, temperature and pressure of the gas in the burette is read. The gas is next placed in the premix chamber. When each gas is in the premix chamber, the capillary between the burette and the premix chamber must be full of mercury. The gases are well mixed by means of a soft iron washer inside the premix chamber and a magnet outside the chamber, which can be raised and lowered. The washer spins rapidly when it is raised or
lowered, creating high turbulence. A half minute of violent
mixing is sufficient. The mixed gases are let into the
adsorption chamber and the reservoir-manometer until the
dead space pressure is at one atmosphere. The remaining gas is passed over the adsorbent at one atmosphere by holding
the mercury levels in the manometer even. A soft iron
washer in the reservoir is used to mix the gases after
slowly back and forth between the premix chamber and the
reservoir at one atmosphere. They are mixed thoroughly
after each pass. Ten passes taking one hour total time are
used for the
ethylene-propane
mixtures. Sixteen passes
taking an hour and a quarter are used for the
ethylene-propylene mixtures. After the last pass is made the mercury
in the reservoir is brought to the measured dead space
level in the capillary while holding the pressure at one
atmosphere. The gas in the premix chamber is taken completely
into the adsorption burette and measured. The temperature
and pressure of the gas in the burette are recorded also.
The ethylene-propane mixtures are analyzed according
to the method proposed by Francis and Lukaslewicz
(4). A
solution, made by dissolving
57
grams of mercuric sulfate
in
200
grams of 22% sulfuric acid, absorbs ethylene
irreversibly from the gas mixtures. A sample of the
unadsorbed gas mixture is fed to the analysis burette, which
always contains a drop of water above the mercury. The
capillary leading to the analysis pipette must contain only inert gas such as propane or air. From five to ten passes, depending on the initial concentration of ethylene, remove the ethylene quantitatively. Knowing the composition of the unadsorbed gas, the dead space volume and the total quantity
of each gas used,
it is easy to calculate the composition
of the adsorbate, using a material balance. An alternate method involves the degassing of the adsorbate by means of
the desorption pump and the application of heat. The desorbed gas plus the unadsorbed dead space gas is measured and
19
analyzed as above. This procedure may also be used to check the material balance. The desorption pump can remove 99+%of the adsorbate in the above procedure.
The ethylene-propylene mixtures are analyzed according
to the method proposed by Matuszak (7). Propylene is
selectively absorbed by 85% sulfuric acid. Since the propylene is only 97% pure, the ethylene must be analyzed for also.
The unadsorbed gas sample is taken into the analysis burette. About 20 milliliters of air are added to the gas in the
analysis burette. The volume is read before and after adding
the air. First the gas mixture is passed into the 85%
sulfuric acid until consecutive readings show a constant incremental decrease of approximately 0.04 milliliter. The
gases are then passed into the 22% sulfuric acid solution to remove the ethylene. The remaining gas is composed of the added air and the inerts in the unadsorbed gas sample. Thus
knowing the composition of the unadsorbed gas, the dead space volume and the total quantity of each pure gas used, the composition of the adsorbate may be determined.
2O
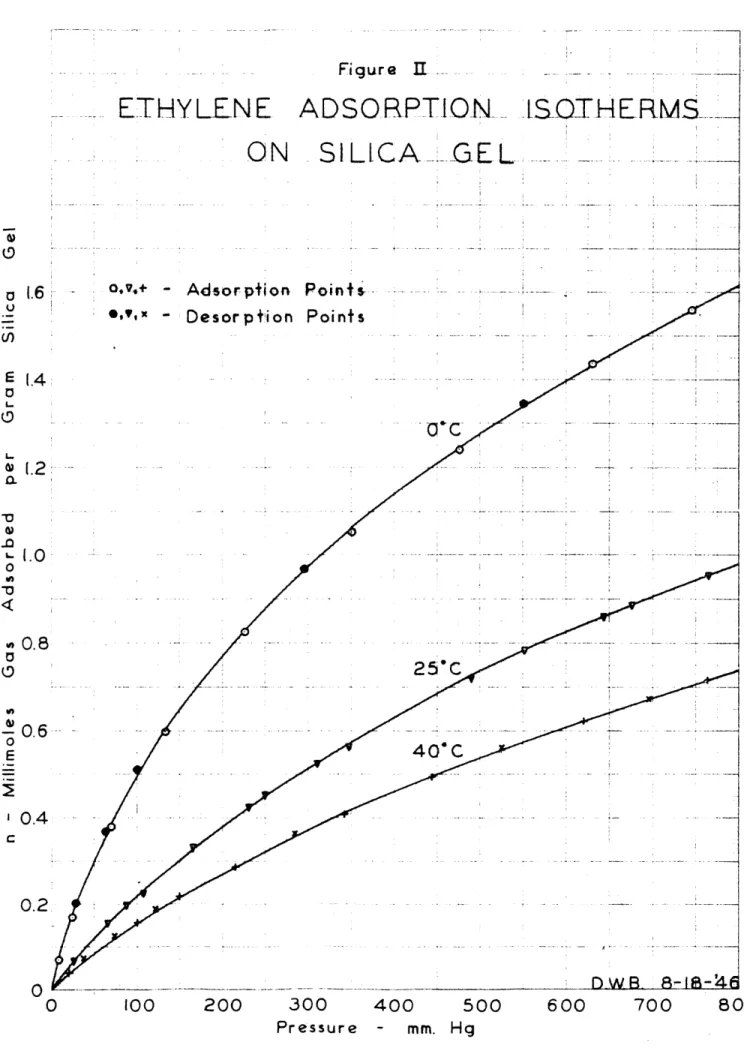
RE SULTSThe adsorption isotherms of ethylene, propane and
propylene on silica'gel were determined at 000, 2500 and 4000C at pressures between 0 and 760 mm. Hg. Figures II,
III and I show the isotherm plots made from the experimental
data as reported in Tables I, II and III. The differential
heats of adsorption calculated from the isotherm data are presented in Figure V.
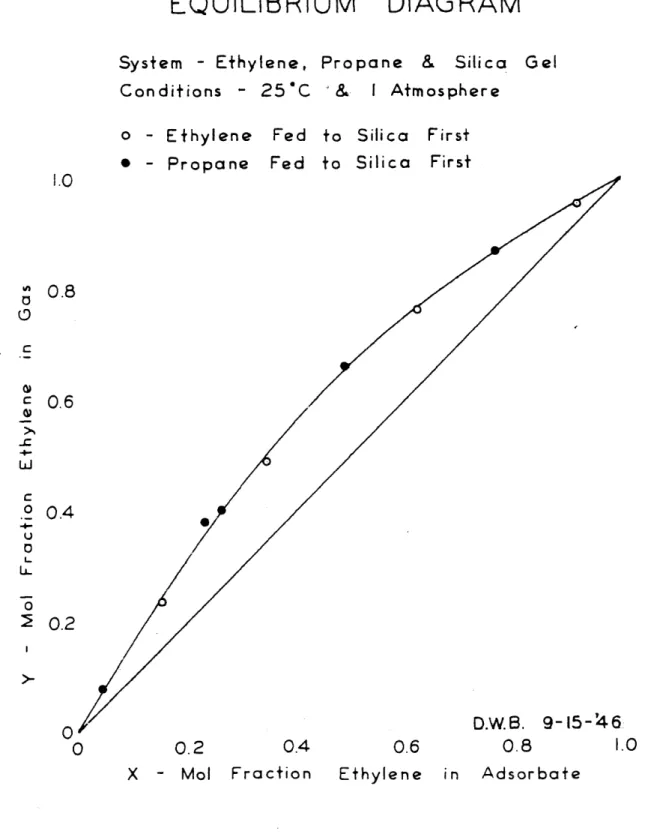
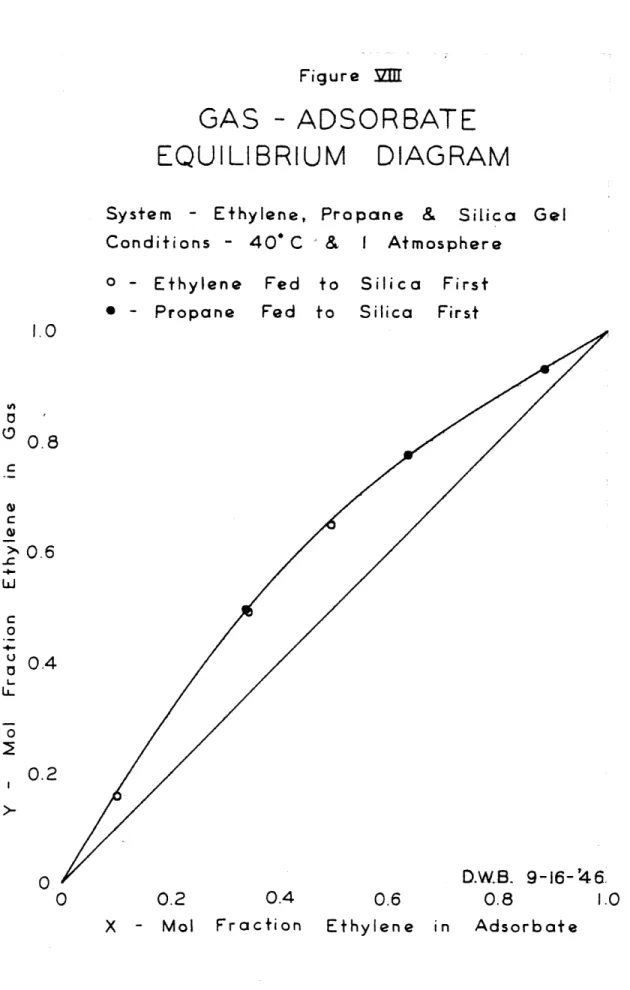
A total of 46 runs were made to determine the
gas-adsorbate equilibria of propane and ethylene-propylene mixtures on silica gel at 00C, 2500 and 400C and at a total pressure of one atmosphere. The equilibrium diagrams for the ethylene-propane mixtures are presented in Figures VI, VII and VIII and the experimental results for
these runs are found in Table IV. A composite equilibrium
diagram made from the smooth curves through the individual runs and showing the effect of temperature is presented in Figure IX. The relative volatilities are presented in Figure
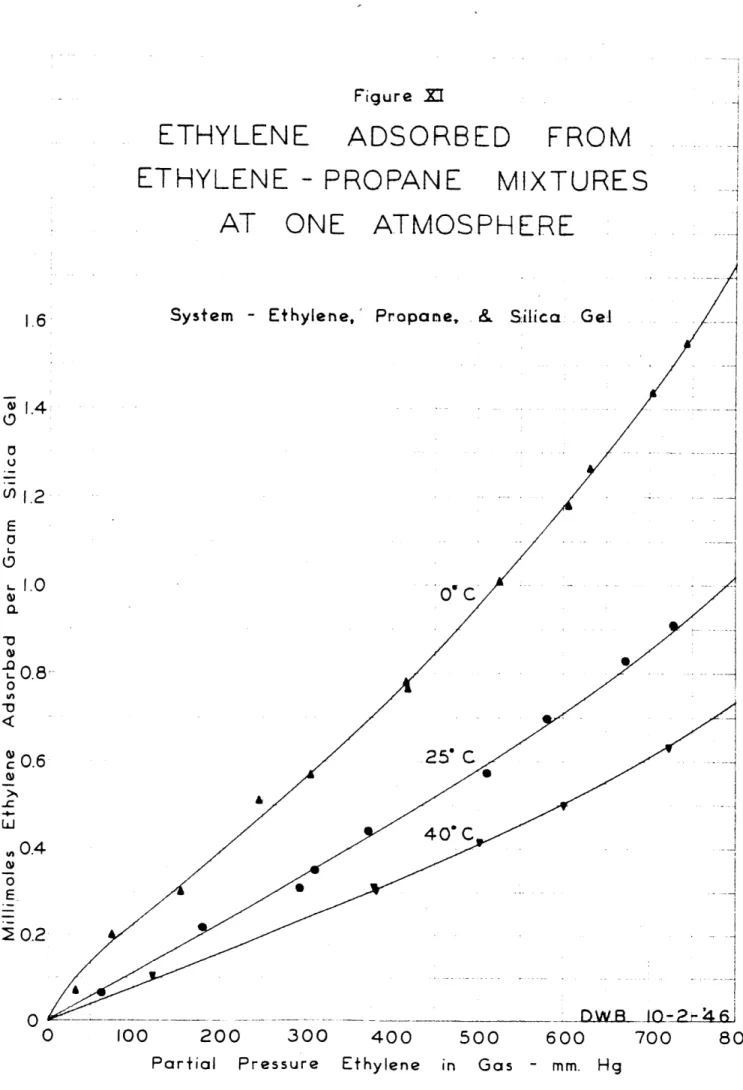
X. The total adsorptions and the component adsorptions for
the ethylene-propane mixtures are presented in Figures XI,
XII and XIII.
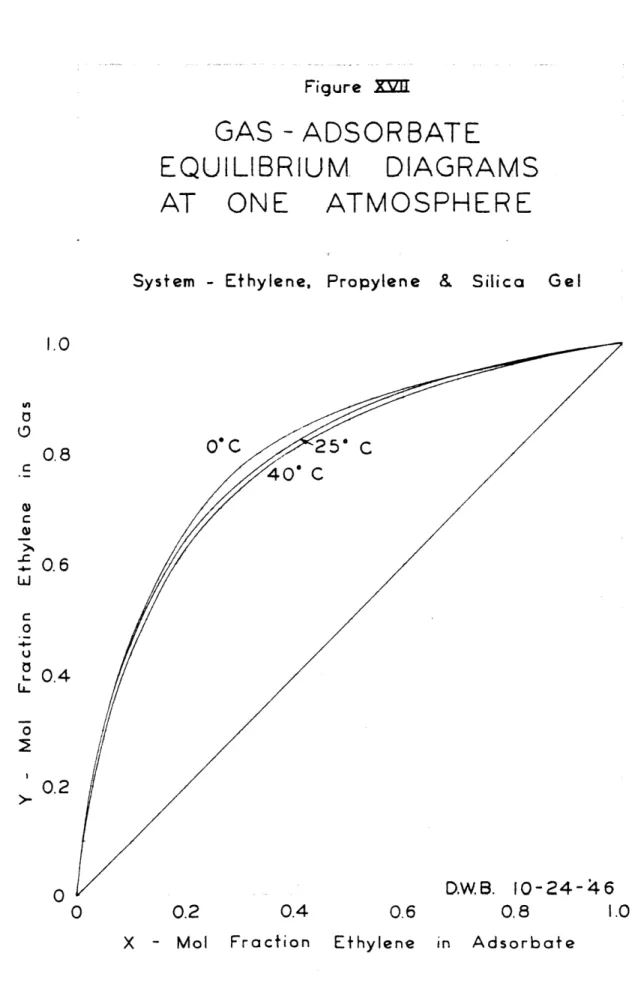
The experimental results of the ethylene-propylene runs are found in Table V, and the equilibrium diagrams made therefrom are presented in Figures XIV, XV and XVI. The composite equilibrium diagram, relative volatilities,
component adsorptions and total adsorptions are presented
in Figures XVII, XVIII, XIX, XX and XXI respectively. The mixture runs were correlated by a modified Van
r
a Laar procediure, TPb constants obtained from the above
correlation are presented in Table VI.
4S
i
I
i
I
Figure II.
ETHYLENE ADSORPTION
ON
SILICA .GEL
(-o,w.+ - Adsorption
Points-,,IX - Desorpftion Points
O'C
i.. 13 (.0 0.825'C
0.6
0 E '0.4 0.2 100 200 300 400 Pressure - mm. HgISOTHE
1.6
1.4500
600700
800 -~-i --c---.~~,_ --c-* . . : I CC
*2:
(2.4 E a L2.0 0CL
a1.6 0 .01.6 0aE
0.8
VI r0.40 E0 , 0 i. t - - I I-- 1·~- ; . 4, • , J I t I ___-·-1i_· a 1 ____f I - Th . 4. I.i I~ i-.- -I: Iii
-
;
- P -- - I A :Ii -S P- -L··. N I ·-- -i -l*i I.---·-C---
m i. ---V.,... ... -. . . .f I .i I I *:C' :40
.-:8i 4qC
P' i' s'.; -eferminid'
by, B.-
CHiER IOW
o1jll$7 Adoorpfioin :P·i I.
ffLi>d· Deporption
Points
n i-~-·.----:--"_. -~-- ;-t -- r -~-- · I----7-4~ -0 100 200 300 400 500 600 700 800 I ---·· --- -- ~--- --- -- I-- --· ·- · _-_ ----. , .. .. ~..--..--- _L_.__ _.._i....l.._ I 1 i I r
i - 1
i;:i
i;
i
I
D.W.B 9-3-;'4i6:_P_
P YLENE L ADSO-TLQN
O
-S OTHEIRMS.
ON
SILICA G EL
; . , . .; . ! . ! 3.2 2.8 E-2.4 a L0.2.0
0) o 1.6 14 'A ~I2 _________ -. - . -.--.-..--- .-I- Pro p Ylene -1 97~ Pure
I~~~ : j L~i. L-,..,--- T. ... ~. . -'.-~.7.. .. -`~-..:..' ~---~-r-I- Sf- .'-1--1 1- :'--- I '4 .~ 0.8 c 0.4 -.~ -.. ~-...--c-L-. -..,~..--..- · ;.-. -.I.- -I -~-~---.--.-.- .~----L----c-ll .f t I I.. ..i...i -C---. ·--·--- r---,- -- ·-- ·--- c--- ~ 1 -- f- --- ---- t---"- --- L-- -- '---~---c-~--"-: A ·i· C· j~ · 1~ · tj A iu~ r?.rs~rr 300 400 500 Pressure - mm. Hg 100 200 600 700 800 i---.-.- ?-·---.---- ·--- ·-- ~---- --- ·- ---. --- i I
Table I
Adsorption of Ethylene on Silica Gel at 0*C
Pressure -1.9 7.6 23.4
67.9
133.3 226.4 350.4 476.1631.6
745.5mm. Hg Millimols adsorbed per gram
0.01185
0.05926
0.1694 0.3804 0.5976 0.8260 1&053 1.242 1.4371.
561
Desorption549 ,.5
295.6 100.1 62.4 27.3 8.4 1.346 0.970 0.5116 0.3704 0.2036 0.0818Table I (Cont'd)
Adsorption of Ethylene on Silica Gel at 2500 Pressure - mm.
14.2
65*4 87.2 164.5 250,5 347.1552.0
676.6 764.2Millimols adsorbed per gram 0.03446 0.1567 0.2011 0.3320 0.4554 0.5743 0.7828 0.8884 0.9552 Desorption
644.3
489.7 310.4 231.5 107.0 26.5 0,8601 0.72030.5262
0.4231 0.2262 0.06797Table I (Cont'd)
Adsorption of Ethylene on Silica Gel at 40OC
Pressure - mm. Hg 20.0
100.9
150 .3 214.1 342.5 444.0 620.3 763.7Millimol s adsorbed per gram 0.03839 0.1578 0.2176 0.2883 0.4084 0.4936
0.6226
0.7178 Desorption 696.2 524.6 284.6 121.7 73.7 37.5 10.6 0.6771 0.5620 0.3648 0.1903 0.12775 0.073620.02752
Z8
Adsorption of Pressure - mm. Hg 16.6 37*.7 64.4 93.2 129.3 218.4 298.8 429.4 587.1 762.6 Table IIPropane on Silica Gel at 00C
Millimols adsorbed per gram 0.2097 0.3805 0. * 5573 0.7127 0.8845 1.2336 1.4916 1.8467 2.2005 2, 5383 Desorption 668.9 501.1 264.6 109.4 73.2 29.4 2*3780 2.0348 1.4183 0.8284 0.6189
0.3657
Z9
Table III
Adsorption of 97% Propylene on Silica Gel at
000C
and 40*0Pressure - mm. Hg Millimols adsorbed per gram
O°C 51.1 1.037 95.2 1.446 151.7 1.876 213.8 2.033 354.9 2*512 428.4 2.600 564.9 2*889 762.1 3.131 400 52.9 0.4519 74.7 0.5628 93.4 0.6210 184.1 0.9136 249.4 1.0419 405.9 1.3448 503.2 1.4774 605.4 1.6008 764.9 1.7639
30
Table III (Cont'd)
Adsorption of 97% Propylene on Silica Gel at 250C Pressure -4.4 34.2 71.4 74.2 91.6 155.4 194.3 198.3 271*.5 281.8 353.2 355.6 457.9 459.0 550.7
555.2
650.0
760.6 768.2mm. HiS Millimols adsorbed per gram 0.1090 0.3738 0.7227 0.7596 0.7472 1.1250 1.1285 1.1683 1.4010 1.4725 1.5624 1.6328 1.8081 1.8137 1.9175 1.9283 2.0725 2.1840 2.1968
Figure '
HEATS. OF
-...
ADSORPTTIN
CalculmtedL from .the._• .
au25
I..
Isotherms by the Equatiaon... - Ethylene S Propane... £ - Propylene ClIusiusi- .CLapyran -.·-.-- ----
1-i1
8000r- 2000'--"-1iDwR
8- 1I--'9-46. 0.4 0.8 1.2 1.6 2.0Millimoles Gas Adsorbed
-o
0 IE 0 L L. 0) a-6000 4000 O -- -I - ·IlLLIL --- · Y- --0.4 -- i -r -T- 7----·---~ r -. lj · ·--- ·-···~ ) --- i-:::iI
.:.I
I ~ ... I .1 --·-··-·-..._, . .* i GelSystem - Ethylene, Conditions
-o - Ethylene
* - Propane
Propane & Si.Lica Gel
O'C & I Atmosphere Fed Fed to to Silica Silica First First 0.2 0.4 0.6 0.8 Ethylene in Adsorbate 1.0 0.8 0.6 0.4 0.2 1.0 Figure rI
GAS -ADSORBATE
EQUILIBRIUM
DIAGRAM
X- Mol Fraction 1.0Figure Z1
GAS - ADSORBATE
EQUILIBRIUM
System - Ethylene, Conditions - 25"CDIAGRAM
Propane & Silica Gel I Atmosphere
o - Ethylene Fed to Silica First
* - Propane Fed to Silica First
0.8 0.6 0.4 0.2 0.2 0.4 0.6 Ethylene in Adsorbate 0.8 1.0
I &
i X - Mol FractionFigure SZlE
GAS - ADSORBATE
EQUILIBRIUM
DIAGRAM
- Ethylene, Propane & Silica Gel
1.0
Conditions - 40' C & I Atmosphere
o - Ethylene Fed to Silica First
* - Propane Fed to Silica First
0.8 C c >0.6 -u bJ 0.4 0.2 D.W.B. 9-16-'46; 0.2 0.4 0.6
X - Mol Fraction Ethylene
0.8
in Adsorbate
Syste m
35
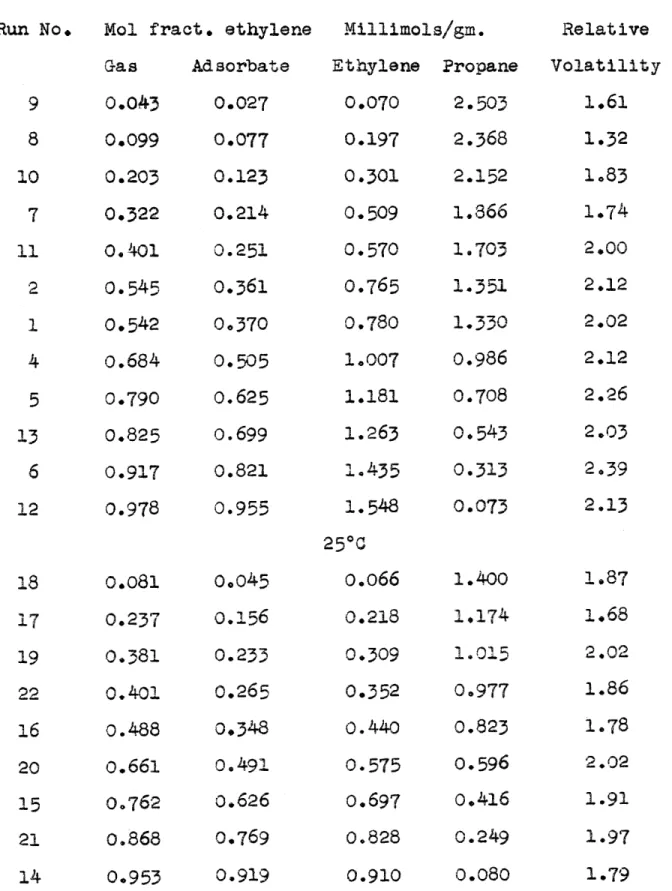
Table IV
Gas-Adsorbate Equilibrium of Ethylene-Propane Mixtures on Silica Gel at One Atmosphere
00C Run No. 9 8 10 7 11 2 1 4 5 13
6
12 18 17 19 22 16 2015
21 14 0.081 0.2370.381
0.401 0.488 0.661 00762 0.868 0.953 0.045 0.1560.233
0.265 0,348 0.491 0.626 0.769 0.919 Mol fract. ethyleneGas Adsorbate 0.043 0.027 0.099 0.077 0.203 0.123 0.322 0.214 O.401 0.251 0.545 0.361 0.542 0.370 0.684 0.505 0.790 0.625 0.825 0.699 0.917 0.821 0.978 0.955 Millimols/gm. Ethylene Propane
0.070
2.503
0.197 2.368 0.301 2.1520.509
1.8366
0.570 1.703 0.765 1.351 0.780 1.330 1.007 0.986 1.181 0.708 1.263 0.543 1.435 0.313 1.548 0.073 25°Co.066
1.400 0.218 1,174 0.309 1.015 0.352 0.977 0.440 0.823 0.575 0.596 0.697 0.416 0.828 0.249 0.910 0.080 Relative Volatility 1.61 1.32 1.83 1.74 2.00 2.12 2.02 2.12 2.26 2.03 2.39 2.13 1.871,68
2.021.86
1.78 2.02 1.91 1.97 1.7936
Table IV (Cont'd)
40C0
Mol fract. ethylene Gas Adsorbate 0.159 0.103 0.494 0.340 0.492 0.346 0.648 0.494 0.775 0.635 0.931 0.884 Millimols/gm. Ethylene Propane 0.104 0.g91 0.306 0.594 0.312 0.588 0.414 0.425 0.499 0.286 0.633 0.083 Relative Volatility 1.65 1.90 1.83 1.89 1.97 1.76 Run No. 28
26
27
25
2423
GAS
-ADSORBATE
. . .... .. .Q U..t... .- ... ... .
.-
EQU[EIBR
UML
DIAG
A
AT
ONE
ATMOSPHE•
E
.Syst e Ethy:eaePane Sid c eL
-- -- I 1.0 0 . C S0.6 L. k--~-- k .... ·. " ... -- ---- .. -t- .. r . . --.. ... -- . ... . . : .-' ---. . I- . -O i '-4 0 02 0.4 0.6 0.8 1.0
Figure X
RELATIVE
VOLATILITIES
ETHYLENE -PROPANE
MIXTURES
ON SILICA
GEL
Pressure - One Atmosphere
,0o,v - Ethylene Fed to Silica First
&,O,v - Propane o, - 25 C , - 40' C -TO = 2 .. . .... ... O C AI b Ld.VV.LI~. II i- L'.J tV 0.2 0.4 0.6 0.8 1.0
Y - Mol Fraction Ethylene
FOR
I. I ..
r lw it Inf 10
-
ý
a
Figure MI
ETHYLENE
ADSORBED
FROM
ETHYLENE - PROPANE
MIXTURES
AT ONE ATMOSPHERE
m - Ethylene, Propane, & Silica Gel
O' C
25" C & 200 300 400500
600
Syste 1.61.4
1.2
I.C0 0.6 L O. S0.2 >1-C
n
100700
800 v.. .. .. ... ... .. ... F i g u r e IzII.. . . . .. .. . . . . . . . .
-
PROPANE
ADSORBED
EROM
..ETHYLENE_- PROPANE ._MIXTURES
ATL. ONE ATMOSPHERE
_Syste.ta - Ethylene; Pr.pan•e . SilicG Gel
'j I 2. 8
2.4"---2.0
1.6 1.20.8.
0 E 0.4. 0 U) t C 0 o I 1\DWB IiO-2 -'4~ O-' 0 100 200 300 400500
600 700 800Partial Pressure Propane in Gas - mm. Hg
·--Figure- I=II
TOTAL
ADSORPTION
AT ONE ATMOSPHERE
.System - .. Ethylene, Proapne & _Silica
i- -"---- 2.4-a i---LtE6 CL .4.'--t---a ~-a .fj4; L. 0 E 2 0' C --I 1 ---1 25' C
i
0 C 040D_
B.__-23- 4_
0 0.2 0.4 0.6 0.8 1.0 -Get I 1`1-i
-~
--1
i
!Figure
GAS
-
ADSOR BATE
EQUILIBRIUM
DIAGRAM
System - Ethylene, Propylene & Silica Gel
Conditions - OC & I Atmosphere
o - Ethylene Fed to Silica First
* - Propylene Fed to Silica First
0.6
0.4
0.2
D.W.8. 9-16-'46
0.2 0.4 0.6 0.8 1.0
X - Mol Fraction Ethylene in Adsorbate
C~
1.L
Systenrm._- Ethylene,. Propytioee & Sill c... Gelt Conditions. - 25'C i - Ethylene * - Propylene 0.2 X - Mol 0.4 Fraction & I Atmosphere Fed, to Silica First
Fed to Silica First
0.6 0.8 Ethylene in Adsorbate 0.8 c 0.6 c S0.4 U L L, 0.2 Figcure Z3
GAS -
ADSORBATE
EQUILIBRIUM...
DIAGRAM
I --- ---~-~ ~-~- -~'---~--= _Figure XrI
GAS
-ADSORBAT-E
EQUILIBRIUM
DIAGRAM
_System' - Ethylene, Propylene A& Silica Gel
Conditions - 40'C 0 - Ethylene Fed. * - Propylene Fe & I Atmosphere to Silica First d to Silica First 0.2 0.4 0.6
X - Mol Fraction Ethylene in
0.8 Adsorbate
.08
.. O 0 .C
t 0.6C L U-0.2 '- ~ ~ ~~-~--Table V
Gas-Adsorbate Equilibrium of Ethylene -Propylene Mixtures on Silica Gel at One Atmosphere
Run No. Mol fract. ethylene
Gas Adsorbate 32 0.364 0.066 31 0.579 0.145-30 0.711 0.207 29 0.682 0.238 33 0.814 0.362 34 0.903 0.541 35 0.948 0.745 36 0.989 0.885 39
38
37
40
41 4243
44
4547
46 0.2480.526
0.628 0.817 0.9080.968
0.321 0.563 0.703 0.852 0.935 0.037 0.123 0.195 0.3970.597
0.807o.o6o
0.159 0.2700.471
0.705
Millimols/gm. Ethylene Propylene 0.191 2,699 0.379 2.232 0.518 1.9860.565
1.807
0.807 1.421 1.072 0.909 1,347 0.460 1.471 0.191 2500 0.074 1.946 0.216 1.547 0.327 1.353 0.558 0.847 0.721 0.487 0.847 0.202 4000 0.089 0.207 0.309 0.4430.581
1.392 1.098 0.834-0.499 0.243 Relative Volatility 8.07 8.10 9.42 6.87 7.71 7.916.25
11.34 8.60 7.92 6.99 6.77 6.64 7.22 7.386.83
6.38 6.47 6.00Figure =II
GAS - ADSORBATE
EQUILIBRIU
AT ONE
System - Ethylene, O' CM
DIAGRAMS
ATMOSPHERE
Propylene & Silica
5" C O' C D.W.B. 10-24- 46 0.2 0.4 0.6 0.8 1.0 Ethylene in Adsorbate 1.0 Gel 0.8 0.6 0.4 0.2 X - Mol Fraction
r it i 10 -1 *-4 . . . . I. ..
r-f-THY-ENE
LT---E
ES
0 ~ • .. !. . ... .... 25 & C . 06
Y - Mol Fraction Ethylene in Gas
Y -O ""l i E i G
....
. +
.---
-
·-:-
"---
"
-,
+.--
. .
T-
.
-
....
...
~ ~...
:
I
I 1.6 1.4 1.2 1.0 0.2 0' 0 100 200 300 400 500 600 700 800Partial Pressure Ethylene in Gas - mm. Hg
..
....
L
E IN .:
~ETH
LFEN-
.PRXLN
MiXTLRELL
m:1:1
---L1
-·J ---- ___ _________·____7
ri
E-t h
.:
Silica. L
r..AI
o. .F I -*1 .... I _!. . .. . I .... .. fI 7-i I * *·~- -r-- -i I: I I j IL - - - I I . -rI ·
K..
:-. ... -.- *---_ r I _ _ -4-I1
1
: .L· I:: ________________________ I 0 a 0.8. 0.6
C -c i. 0.4.. .. .. .... ..
IFN Pý
OSO
-I I ___~~~~~~~
RiLN~AtSRF7
tO
L-H S - = -I I ::T T7!1·:T T r . :3.6
3.2
_____ I I-'I : I' . . ._ . _ , .- t_. . • , 1 ,, , J m ,
• , • , ,•
, , ,
, • ,
I,-
,
0
fi Li
T(.i: .1., i
* .:.i
:7
i-i
1 r)
tr
W
R':
ffi
46 '
0
0 100200
300
400
500600
700
800
i ;32.8
U E 2.4 L. L2.0 30 1.6 1.20.8
0E
7-0.44
i . i..~.. r ' -~--~-1-'-- -~--~-1-'-- i · · I · i i . ... i: i · i ·- ·--- ~-·--- t.-- . .. .; I ' c., i ; i I t j ·: · ·· · · ·;···I ·-· ---·--·- ···-- -I i', I i .1~
.,r .I .';LL I · rISýs7iy
77 7- .-..----..... .. . ... . . 25 c . . . . .K-~7I
I
I -*- -I - ·f * II
,--. . ! • .F i,• e ..XX. .. .. ....... Fi.gur..e .L . .. . ..
O T
A
L
... ... ...
..
...
.. . ..
AT:
i
ONE
:
T
O S
Ri
Ii
F
32
-.-.
~ i ---- ~3 2 - ' · -4- -- - -• -. ...-- ---..." . . .. .... .--K-"
-- C- --- --- -.-. - r~_ _~-- C-- -- ..i-- ~--•2,8- -
...i
:.I
, , , . . r i •...- . •8 ;'-2--- -4" . - ... .;-·- ... --.-#-. ... .. .. ...-.-· •- ..--- . - - + - " t • _ _. .... .. . . . , ', ----.... --
: T - ·
... ...--- ---i---- : L
r--
-i - -·-L-•
...
·-
... -
...
;25
22
__WIR -24 +4] 6 0 0.2 0.4 0.6 0.8 1.0X -Mol Fraction Ethylene in Adsorbate
. !
..--
:d·--
:·
.i
i---_--
'
i-
•--
i ..
i
-. ....--
·- · te - . .'---1- ... .- ....
; :: ! . .. j i. i - •
! ... , ,: ~~~~~·-I ! , i . -2
Constant
s
Temperature
250C
4000 2500 400Table VI
for the Modified Van Laar Correlation
Ethylene -Propane Mixture s
A
B
A
B
Ethylene
Propane
1.661
-502
1.012
-343.5
0.8415
-234.8
1.75
-370
0.596 -228 1.693 -312.5Ethylene-Propylene Mixtures
Ethylene
Propylene
2.05
-1175
0.324 -368.5
1.787
- 816 0.0962 -8731.687
-721
1.208 -408
51
ftV % a I-DISCUSSION
2
Apparatus arld Methods
The apparatus and method used for measuring the
adsorption isotherms ensured a high degree of precision
to the data.
The dead space volume was-measured to the
nearest hundredth of a cubic centimeter. The amount of
gas in the dead space was always less than ten percent of
the amount of adsorbate. The dead space pressure was read
to the nearest tenth of a millimeter of mercury and the
gas volume was read to the nearest two hundredths of a
cubic centimeter.
The ethylene and propane used were 99+% pure, while
the propylene used had a maximum purity of only 97%. The
effect of the impurities on the behavior of the propylene
during adsorption was quite evident from a comparison with
the behavior of the two other gases during adsorption. The
adsorption data for ethylene and propane fell on smooth
curves, Figures II and III, while the scattering of the
propylene data, Figure IV, indicated a certain amount of
hysteresis. Also equilibrium was reached in a matter of
a
few seconds during the ethylene and propane isotherm
measurements, whereas equilibrium was not attained after
hours of drift during the propylene isotherm measurements.
The magnitude of the error caused by the impurities in the
propylene isotherm data can be determined only by comparison
with isotherm data made with pure propylene on the same
silica gel.
The
apparatus used in this investigation was designed
specially by previous workers to ensure the attainment of
equilibrium in the study of the behavior of gas mixtures on
adsorbents. Means are provided for thoroughly mixing the
gases
and passing them over the adsorbent continuously at
the pressure required. Material balances can be made by
removing the adsorbate with the desorption pump, which is
followed by analysis of the gases.
The equilibria of ethylene-propane mixtures were
studied first at
0.0.
Runs 1 and 2 were made to determine
how much time was required to reach equilibrium. In Run 1
ethylene was fed to the silica gel first at one atmosphere.
The propane was added at one atmosphere to give the required
mixture. Twenty passes about one hour were made. In Run 2
propane was fed to the silica gel first. Ethylene was added
to give the same mixture as in Run
1,
and again twenty
passes were made. The results, found at Y
=
0.54 in Figure
VI, indicated that equilibrium was approached very closely.
Since the relative volatility was not very large, the
remaining runs for the ethylene-propane system were made
with only ten passes, still taking about one hour. Runs 26
and 27 were made to determine the approach to equilibrium
with only ten passes. The results, found at Y
= 0.5
in
Figure
VIII, indicated ten passes were sufficient. A
material balance was made on Run 1 by desorbing the
adsorbed gases and analyzing them. The adsorbate composition
was calculated as 37.0% ethylene from the analysis of the
-54
adsorbate composition
as
36.1% ethylene. The solution of
mercuric sulfate
in 22%
sulfuric
acid,
used for analysis
of the ethylene-propane mixtures, was changed frequently.
This reagent removes the ethylene rapidly and is excellent
for the quantitative
removal
of olefins
from
paraffinsa.
Several runs were made in sequence without evacuating
the adsorbent chamber. The
gas, which had to be displaced
for a
new equilibrium composition, was considered as the gas
fed first to the
silica
gel.
For those cases where the
adsorbent was evacuated
and
the gases were premixed, the gas
fed last to the premix chamber was considered as fed first
to the silica gel, because the gas remaining in the bulb
below the stopcock leading into the premix chamber could not
be mixed with the rest of the gases in the premix chamber.
It was noted in Figures VI, VII and VIII that the runs in
which ethylene was fed to the silica first fell on or below
the smooth equilibrium curves drawn through the data points.
The runs in which propane was fed to the silica first fell
on or above the equilibrium curves. In the cases where the
data points lay off the equilibrium curves the required
change
in
adsorbate composition was in the same direction
as the change which occurred during the run. This indicated
that the runs had not reached the equilibrium compositions
in those cases, For this reason the relative volatility
curves of Figure X were drawn between the ethylene fed
first and the propane fed first data points.
The equilibrium curves for the ethylene-propylene
s5
3.08% inert gas. The gas and adsorbate compositions were calculated on a basis of 100% ethylene and pro.pylene. Inother words the total pressure was assumed to be equal to
the sum of the partial pressures of ethylene and propylene only. Runs 29 and 30 were made first to determine whether ten passes were enough to attain equilibrium. The results,
found at Y = 0.7 in Figure XIV, indicated that ten passes
were not enough to properly locate the equilibrium curve.
Thereafter fourteen passes taking an hour and a quarter were used. Because of the presence of the inert gas, the silica gel was evacuated after each run. The ethylene-propylene data points fell into positions relative to the smooth equilibrium curves similar to those noted in the
case of the ethylene-propane data points. The equilibrium curves, Figures XIV, XV and XVI were as well defined by the ethylene-propylene data points as those for the
ethylene-propane mixtures, even with the more intricate analyses and higher relative volatilities of the former. The presence of
impurities in the propylene required the analysis for both ethylene and propylene in the unadsorbed gases. The 85%
sulfuric acid used to absorb the propylene also absorbs
ethylene slightly. During the analysis, the gas mixture was
passed first through the 85% sulfuric acid until consecutive readings showed constant decrease of approximately 0.04 cc., and then passed through the 22% sulfuric acid solution to remove the ethylene. This constant value was multiplied by the number of passes and added to the volume of ethylene
Since the analytical procedure used for the
ethylene-propylene mixtures is more involved, more care must be
used to obtain results as accurate as those obtained from
the analytical procedure used for the ethylene-propane
mixtures.
Isotherms
The adsorption isotherms of ethylene, propane and
propylene, Figures II,
III
and IV respectively, are concave
to the pressure axis. This type of curve
usually represents
the formation of a unimolecular layer of adsorbate.
Lansmuir's
(5)
adsorption isotherm equation,
n l+bp
was
derived for unimolecular adsorption. This equation
can be rearranged as follows,
1
1
+1.
n =
abp
a
Thus a plot of i/n against 1/p should be a straight line
for a gas which obeys the Langmuir equation. The isotherm
data for ethylene and propane were plotted in this form
in
Figures XXII and XXIII respectively. The ethylene data fell
nearer to a straight line than did the propane data. The
propylene isotherm data did not come close to a straight
line when plotted as above. The curvature of the n vs. p plots for the propylene isotherms is noticeably different from the curvature of the ethylene and propane plots.
Ryerson and Gines (9) obtained adsorption isotherms for
:---T---r·--- I__~__~_ ~---r-- --- 1---i ---- ---- -- ---- -~-uJ
-jL
-4•-- - --- ---.
iU i i -' I 0 .;~-.,i---.-~-. .- ~~--- . U----o-'o o * i\: i : s i im UJ-ti-7n -iLI--L
i iTF---~T2---r
0• ..i. r~-j0---F:
-cr
(f)
4--.I..-- . I-. --L. Lt 00 Ie It a p. LL r'-~~~ .- _._ ___ - r-.---~__-r- itif I--· _~___~~~_lcly _;__ ~QS!-~o---t~---
---EL 10
B I E -N. C____~_ · _~____~ -~--t'--1 --- --- --- --I--~-~--~-1-`- i ` cC ·- i·-. I- ; ~d i\ i r c __~ I--c-.-l--.L--- - - i - -~- ~~ ~-~-' -- r --~ i I I i' I f aO I I · ---c. I.-~---~ ,-t-- --- f---t----0[11..4. __i~~.__ -. ~ 1__-_I 1. I ~.-...~__-__i~-2
13 t--- --- t·---c----· -- c--·---·-e--- --- · ·--r--- -· ---'·---·-r---I-·· , r· I-; ~,~-;.~~-__.~.J---;---- --- IC --- ·--- I--- ·-t~ -- I- -i--- -. ,.---.---·i--- -- · t-K-i I