ORIGINAL PAPER
A microfluidic device for open loop stripping of volatile
organic compounds
Benjamin Z. Cvetković&Petra S. Dittrich
Received: 10 October 2012 / Revised: 20 November 2012 / Accepted: 23 November 2012 / Published online: 13 December 2012 # Springer-Verlag Berlin Heidelberg 2013
Abstract The detection of volatile organic compounds is of great importance for assessing the quality of water. In this contribution, we describe a miniaturized stripping device that allows fast online detection of organic solvents in water. The core component is a glass microfluidic chip that faci-litates the creation of an annular-flowing stream of water and nitrogen gas. Volatile compounds are transferred efficiently from the water into the gas phase along the microfluidic pathway at room temperature within less than 5 s. Before exiting the microchip, the liquid phase is separated from the enriched gas phase by incorporating side capillaries through which the hydrophilic water phase is withdrawn. The gas phase is conveniently collected at the outlet reservoir by tubing. Finally, a semiconductor gas sensor analyzes the concentration of (volatile) organic compounds in the nitro-gen gas. The operation and use of the stripping device is demonstrated for the organic solvents THF, 1-propanol, toluene, ethylbenzene, benzaldehyde, and methanol. The mobile, inexpensive, and continuously operating system with liquid flow rates in the low range of microliters per minute can be connected to other detectors or implemented in chemical production line for process control.
Keywords Microfluidics . Open loop stripping . Water monitoring . Volatile organic compounds . Process analytical technology
Introduction
Water is a valuable world resource, and in order to sustain a good supply of safe drinking water, the economical consump-tion as well as treatment and monitoring of polluted water is becoming increasingly important. Measurements of the qual-ity of ground water, drinking water, lake water, and sewage frequently include, besides inorganic and biological material, the determination of dissolved volatile organic compounds (VOCs). VOCs also have to be monitored continuously in the cooling water of chemical production plants before release of the water into the public network to prevent contamination and harm to the environment. Online monitoring of VOC concentrations can also be used for controlling emissions to detect deviation from regular operation [1].
The online detection of trace concentrations of organic pollutants in aqueous samples is not always straightforward, mainly due to further contaminations such as suspended solids and salts. Chromatographic methods, optical meth-ods, or total organic carbon analyzers are most commonly used for online analysis of organic compounds in water [2]. Chromatographic methods are rather slow, while optical techniques have some limitations especially for particulate-rich or inhomogeneous liquids. Alternatively, analytical stripping approaches were developed and established in the 1970s by Grob and coworkers [3–6]. In a stripping process, an inert gas (a stripping agent such as nitrogen) is introduced into the liquid sample and the volatile com-pounds are transferred completely or partially into the gas phase. The technique can be performed in two different instrument configurations: the closed looped stripping anal-ysis (CLSA) also referred to as static headspace [3,7] and the open loop stripping or dynamic headspace.
In CLSA, the volatile compounds in the liquid are evap-orated and up taken by the stripping gas in a closed instru-ment. The stripping gas is then analyzed, e.g., in a gas
ABC Highlights: authored by Rising Stars and Top Experts. B. Z. Cvetković
:
P. S. Dittrich (*)Department of Chemistry and Applied Biosciences, ETH Zurich, Wolfgang-Pauli-Str. 10,
8093 Zurich, Switzerland e-mail: [email protected] DOI 10.1007/s00216-012-6604-4
chromatograph or directed through a bed of absorbent par-ticles such as charcoal, where the analytes are trapped and eluted by a solvent or by thermal desorption. The main drawbacks are the discontinuity of this process, and the leakage of ambient air into the system, which might cause contaminations in the closed stripping system [6].
Alternatively, open loop stripping instruments with direct sampling have been presented [8]. Here, the stripping agent and the liquid are continuously flushed through a tube or pipe (under current or counter flow). Enriched with the VOCs, the stripping agent is collected at the end of the tube and delivered to the detection system. Suitable detection systems for online analyses are fast gas sensors based on thermal conductivity measurements or the flame ionization detector for the determination of the total organic carbon. This continuous approach is particularly appealing for online monitoring of the water quality or coolants in indus-trial and wastewater treatment plants.
For CLSA, the concentration of the VOC in the aqueous phase and the partial pressure in the gas phase at equilibrium conditions can be derived from Henry’s law. Open loop stripping, however, is not performed at equilibrium as the gas is continuously flushed through the channel and is typically not saturated with the VOC. Here, the efficiency of the stripping process, i.e., the amount of VOCs that is transferred into the stripping agent per time, depends on several parameters, such as the chemical properties of the VOC (volatility and water solubility) and the temperature of the liquid and gas. Furthermore, a large interface area be-tween liquid and gas, as well as short diffusion pathways between the solvent and the gas phase, supports the fast phase transfer of the VOCs.
Typically, stripping systems are rather large and not designed for mobile use or flexible implementation in in-dustrial plants. As a result, they consume large volumes of sample and stripping agent. Furthermore, heating of the system requires constant supply of energy (either by heating of the liquid or injection of hot stripping agent). In this paper, we present a miniaturized stripping technique for the detection of VOCs in aqueous solutions. The continuous removal of solvents from reaction mixtures on a microflui-dic device has been demonstrated before [9–12], but these methods were optimized for use in chemical syntheses and could not be employed directly for analytical stripping. Based on our former development of a microfluidic device for gas-supported solvent removal in chemical reactions [12], we modified our experimental setup and demonstrate herein the operation of the device for analytical stripping.
The small size of the device is especially interesting for open loop stripping approaches as the large surface to vol-ume ratio facilitates a fast transfer of analytes to the gas phase, already at room temperature. Furthermore, we can efficiently heat the sample simply by positioning a resistive
microheater underneath the microchip. The combination of the microfluidic stripping device with a small-sized metal oxide semiconductor gas sensor decreases the overall size without reduction in the system performance compared to larger systems [13]. Hence, it is well suited for analytical stripping with applications in online process monitoring as well as field testing.
Materials and methods Device fabrication
The planar glass microdevice was designed using CAD software (AutoCAD 2010, Autodesk) and fabricated using standard lithography techniques and wet chemical etching [12,14]. Briefly, a multilayer approach was used to enable a high flexibility in channel dimensions and geometry. The microchannels and capillaries were etched into two B270 (Telic, Valencia, CA, USA) glass plates that were subse-quently bonded together. The device consists of a glass base plate where the capillary geometry (with a height of 5 μm and a width of 10 μm) was etched, and a glass top plate where the main channels (with a height of 100 μm and a width of 400μm) were embedded. Inlet and outlet holes (1/ 16″ OD) were drilled into the glass top layer; both layers were aligned and thermally bonded. About 25 mm of stan-dard PEEK tubing (1/16 in. OD; 0.030 in. ID, BGB Analy-tik AG, Switzerland) was glued (TS10 Vacuum Epoxy, Thorlabs) to the device enabling the connection of addition-al tubing for fluid supply. For fluid supply, chemicaddition-ally stable FEB tubing (1/16 in. OD; 0.01 in. ID, BGB Analytik AG, Switzerland) was used. Furthermore for several experi-ments, the device was equipped with a resistive microheater. The heater was fabricated by physical vapor deposition of a thin (300 nm) gold film on a glass substrate and connected to a laboratory voltage source. Besides the meandering gold structure used for resistive heating, a second structure for direct temperature sensing was patterned on the glass sub-strate. Temperatures up to 150 °C could be achieved using this configuration.
Chemicals, fluid, and gas handling
The in-house nitrogen line was used for pressure control of the gaseous nitrogen stream. The nitrogen pressure applied for the stripping process was 1.8 bar for all experiments resulting in a flow rate of approximately 80 mL/min. The nitrogen gas supplied to the VOC detector was held constant at a pressure of 0.8 bar (approximately 2 L/min).
A syringe pump (Nemesys, Cetoni, Germany) was used to control the liquid flow with an overall liquid flow rate of 20 μL/min in the microdevice in all experiments. The
concentration of the VOC in water was changed dynamical-ly by varying the flow rate ratio of water and VOC stream and premixing the streams using a PTFE-Tee junction (BGB Analytik AG, Switzerland), which was installed before the microfluidic device. Concentrations of VOCs between 0 and
100 mg/kg (parts per million) were used in the stripping experiments.
Milli-Q™ water and the following VOCs were used (Table 1): benzaldehyde, (>98 %) and 1-propanol (>99 %) (Acros); methanol (>99.8 %) (EGT Chemie AG, Switzerland);
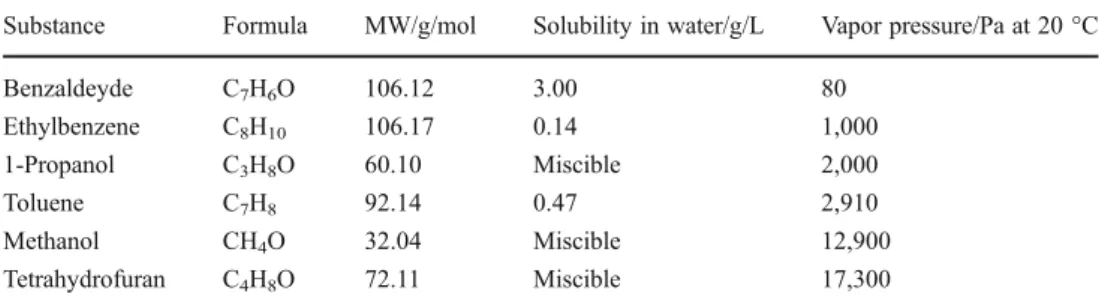
Table 1 Properties of the tested
volatile organic compounds Substance Formula MW/g/mol Solubility in water/g/L Vapor pressure/Pa at 20 °C Benzaldeyde C7H6O 106.12 3.00 80 Ethylbenzene C8H10 106.17 0.14 1,000 1-Propanol C3H8O 60.10 Miscible 2,000 Toluene C7H8 92.14 0.47 2,910 Methanol CH4O 32.04 Miscible 12,900 Tetrahydrofuran C4H8O 72.11 Miscible 17,300
Fig. 1 a Schematic drawing of the microfluidic channels (black), the resistive heater (orange), and the temperature sensing structure (gray). The heater and sensor are fabricated on a glass slide and placed underneath the microfluidic platform. The stripping is performed in three functional sections. (i) In the first section, the annular flow of a gas core and a fluid corona is created, (ii) stripping of the volatile compound takes place in the serpentine channel, and (iii) fluid and gas separation is achieved in the third section. b Sketch of the experimental setup with the gas sensor. c Photograph of the microchip with fluid and
gas access connectors, and the electrical connections for the heater and sensor. d Separation of gas and liquid (section iii) illustrated by a fluorescence micrograph. The gas phase is collected from the main channel, while the liquid phase (here with fluorescein for illustration) enters the side capillaries integrated on both sides of the main channel (indicated by the arrows) and is collected through another outlet. Abbreviations: lin, loutand gin, goutinlet and outlet of liquid and gas,
a
b
d
e
f
Benzaldehyde/mg/kg MeOH/mg/kg Ethylbenzene/mg/kg 0 10 20 30 40 50 60 70 0.4 0.5 0.6 0.7 0.8 0.9 1.0 R/ R0 Toluene/mg/kg Propanol/mg/kg THF/mg/kg 0 10 20 30 40 50 60 70 0.4 0.5 0.6 0.7 0.8 0.9 1.0 R/ R0 0 10 20 30 40 50 60 0.4 0.5 0.6 0.7 0.8 0.9 1.0 R/ R0 0 10 20 30 40 50 60 0.4 0.5 0.6 0.7 0.8 0.9 1.0 R/ R0 0 10 20 30 40 50 60 0.4 0.5 0.6 0.7 0.8 0.9 1.0 R/ R0 0 10 20 30 40 50 60 0.4 0.5 0.6 0.7 0.8 0.9 1.0 R/ R0c
Fig. 3 Microfluidic stripping of VOCs. The graphs show the dependence of the normalized detector with the initial concentration of the VOCs in the liquid phase. a Toluene; b 1-propanol; c THF; d ethylbenzene; e benzaldehyde; f methanol. Linear fits are included (red line)
b
a
0 10 20 30 40 1.6x10⁵ 1.8x10⁵ 2.0x10⁵ 2.2x10⁵ Propanol/mg/kg 50 25 37.5 37.5 Resi st ance /Ω Time/min 62.5 0 10 20 30 40 50 1.8x10⁵ 2.2x10⁵ 2.6x10⁵ 3.0x10⁵ 3.4x10⁵ 45 45 0 4.5 11.3 Resi st ance / Ω Time/min THF/mg/kg 22.5Fig. 2 Detector signal for water samples containing low concentrations of a THF and b 1-propanol. The numbers indi-cate the concentration of the solvent in water in milligrams per kilogram
ethylbenzene (>99.0 %) and toluene (>99.7 %) (Fluka); tetra-hydrofuran (>99.5 %) (Sigma-Aldrich).
Temperature control
For the experiments requiring temperature control, a labo-ratory source meter (U1271B, Agilent) was used to control the resistive microheater and the resulting temperature was determined by the change of resistance of the implemented patterned metal surface (Fig. 1a). Using 1-propanol as a model substance, the temperature dependency was demon-strated between 20 and 34 °C.
VOC detection
The gas outlet of the microfluidic stripping device was connected to a PTFE tubing with a total volume of 10 mL (ID 8 mm; length 20 cm). A metal oxide semiconductor gas VOC sensor (MiCS-5121, e2v technologies, UK) was placed at the end of the tubing, which was controlled by a computer. An additional flow of nitrogen was added to the gas exiting the microdevice to enable a fast rinsing of the tubing and detector. For each solvent concentration, the signal was recorded every second for at least 200 s up to several minutes. From these data points, average values and deviations were calculated.
Results and discussion Device design and operation
A schematic representation of the microchip and the exper-imental setup is shown in Fig. 1. The microfluidic device used for the stripping process can be divided into three different sections (Fig. 1a). At first, gaseous and liquid streams are introduced at a Y-shaped junction creating an annular flow of a gas core and a fluid corona. The second section consists of a serpentine channel where the stripping process takes place. In the last section, the fluid and the gas phase are separated and collected at two different outlets (Fig.1d). Here, the aqueous liquid phase is entering small, hydrophilic capillaries (5×10μm2cross section), while the gas phase is continuously flowing along the main channel (300×100μm2) into the direction of the gas outlet, where it is transferred to the gas sensor. The annular flow regime is stable over a wide range of liquid flow rates between 10 and 100μL/min and stripping gas pressures >400 mbar, while separation of the gas from the liquid requires gas pressures below 2.0 bar to avoid gas breakthrough in the capillaries. The operation of the device is stable for at least 4 h, which was the time limited by our experiments before the liquid reservoir was empty.
Device characterization
First, we tested and optimized the device using THF dis-solved in water as a feed solution (Fig. 2). The graphs in Fig.2ashow the signal changes of the VOC detector (here the resistance) over time during the experiments as the concentration of the VOC feed flow was varied between 0 and 60 mg/kg. The signal at the starting point was very high because the detector was rinsed with additional pure nitro-gen flow before each experiment until stabilization of the signal. Afterwards, the tubing was connected to the outlet of the microchip and water with different concentrations of THF was investigated. The signal steps could clearly be differentiated as the concentration of THF vapor changed. The signal was however not linear over the full range of concentrations. Deviations occurred for the higher concen-trations, which could be due to temperature or humidity effects of the otherwise linearly responding detector as well as saturation effects of the detector. Additionally, saturation of stripping gas with THF and changes in the vapor pressure in dependence of the liquid composition could contribute to these deviations. For comparison, the detector signals for the less volatile compound 1-propanol (see also Table1) is also given (Fig.2b), with smaller absolute signal changes. Determination of various VOCs
Further investigations were performed with various volatile organic compounds. The goal was to demonstrate the suit-ability of the microstripping approach for volatile substan-ces with different functional groups as representatives of a whole range of VOCs. A list of the compounds investigated and their physicochemical properties is given in Table 1. Besides the organic solvents mentioned previously, another
20 25 30 35 0.7 0.8 0.9 1.0 30 ppm 50 ppm 70 ppm R/ RRT Temperature /°C
Fig. 4 Temperature dependence of the stripping process. Detector signals (normalized to room temperature, RT) at different temperatures for three different initial concentrations of 1-propanol in water
alcohol (methanol), two aromatic hydrocarbons from the BTX group (toluene, ethylbenzene), and an aromatic alde-hyde (benzaldealde-hyde) were tested.
An overview of the stripping results is shown in Fig.3a–f. Here, the normalized detector signal was plotted against the concentrations of the substances. All tested VOCs could be detected in the concentration range of 5–70 mg/kg after pass-ing the stripppass-ing device. However, the relative signal change (slope) varies for the different test substances. In other words, the system has a substance-specific response, which could not be correlated with the vapor pressures, the boiling points, or the Henry coefficients of the tested VOCs. This is likely to be a consequence of the different detector sensitivities for the various gases. For the highly volatile compound benzalde-hyde (Fig. 3e), we see strong deviations from the linear response, which we mainly attribute to saturation of the gas phase with the solvent.
Another parameter, which was determined from the data, was the t90 value for the stripping device,
represent-ing the time required to obtain 90 % of the final signal after a change of parameters. This value is particularly interesting because it reflects the response time of a system. Especially for online monitoring, the response time should be short to enable a fast analysis time. This parameter was evaluated using the data from the meas-urements of methanol, propanol, and tetrahydrofuran at room temperature over the entire concentration range. For the studied microfluidic stripping system, the t90 value
was 195 ± 20 s, which is slightly faster than found by Schocker and Lißner for a macroscopic stripping device [13]. The t90 value can certainly be decreased with a
faster detector and shorter tubing. It should be empha-sized that the residence time in the microfluidic system is below 5 s for the flow and pressure conditions used here, i.e., the stripping process is very fast.
Finally, we demonstrate that the efficiency of the strip-ping process can be further improved by increasing the temperature, which was realized by placing the microdevice on a resistive microheater. While the heater can, in principle, increase the temperature up to 150 °C, this was not per-formed here with the applied flow and pressure conditions because high temperatures can result in partial evaporation of the water and induces flow instabilities. Hence, the tem-perature was varied only in a narrow range between 20 and 34 °C, and the stripping results are shown for 1-propanol, which was added to water at different concentrations (70, 50, and 30 mg/kg). For all three concentrations, an increase of the resulting signal of up to 30 % was observed with increasing temperature (Fig. 4). The pos-sibility to quickly heat the sample could be particularly useful for the detection of very low concentrations of VOCs and for the complete removal of the VOCs traces, e.g., to clean the water samples.
Conclusions
A new microfluidic stripping approach for the continuous monitoring of volatile organic compounds in aqueous solutions has been demonstrated. The device allows continuous opera-tion making it an ideal tool for online monitoring of aqueous streams within waste water or industrial plants. The experi-ments performed in this paper have shown a high efficiency of the stripping process enabling the detection of compounds in a low range of milligrams per kilogram concentrations, without the need of heating the gas or liquid. We believe that the detection time and detection limit can be significantly improved by choosing another detector. Further modules for pretreatment, e.g., for filtration of water samples could be easily integrated. Separation and identification of the stripped compounds could be achieved by injecting the organic compound-enriched gas into a gas chromatograph.
Acknowledgments We thank Valentian Arima and Ross Rinaldi (CNR Lecce, Italy) for providing the glass chip, Stefan Schmid (ETH Zurich) for providing the gas detector, Oliver Lade (Siemens AG Berlin) and Alexander Schocker (BASF Schweiz AG) for helpful discussions, and Tom Robinson for careful proofreading of the manu-script. The authors acknowledge the EU project Radiochemistry on chip“ROC”, grant agreement no. 213803 for financial support.
References
1. Wortberg M, Ziemer W, Kugel M, Müller H, Neu HJ (2005) Monitoring industrial wastewater by online GC-MS with direct aqueous injection. Anal Bioanal Chem 384:1113–1122
2. Bourgeois W, Burgess J, Stuetz R (2001) On-line monitoring of wastewater quality: a review. J Chem Technol Biotechnol 76:337–348 3. Grob K (1973) Organic substances in potable water and in its precursor. I. Methods for their determination by gas–liquid chro-matography. J Chromatogr A 84:255–273
4. Grob K, Grob G (1974) Organic substances in potable water and in its precursor. II. Applications in the area of Zürich. J Chromatogr A 90:303–313
5. Grob K, Grob G (1975) Organic substances in potable water and in its precursor. III. The closed-loop stripping procedure compared with rapid liquid extraction. J Chromatogr A 106:299–315 6. Grob K, Zurcher F (1976) Stripping of trace organic substances from
water: equipment and procedure. J Chromatogr A 117:285–294 7. Martí I, Lloret R, Martín-Alonso J, Ventura F (2005)
Determina-tion of chlorinated toluenes in raw and treated water samples from the Llobregat river by closed loop stripping analysis and gas chromatography–mass spectrometry detection. J Chromatogr A 1077:68–73
8. Borén H, Grimvall A, Sävenhed R (1982) Modified stripping technique for the analysis of trace organics in water. J Chromatogr A 252:139–146
9. Sahoo HR, Kralj JG, Jensen KF (2007) Multistep continuous-flow microchemical synthesis involving multiple reactions and separa-tions. Angew Chem Int Ed 46:5704–5708
10. Hartman RL, Sahoo HR, Yen BC, Jensen KF (2009) Distillation in microchemical systems using capillary forces and segmented flow. Lab Chip 9:1843
11. Hibara A, Toshin K, Tsukahara T, Mawatari K, Kitamori T (2008) Microfluidic distillation utilizing micro-nano combined structure. Chem Lett 37:1064–1065
12. Cvetkovic BZ, Marra L, Arima V, Rinaldi R, Dittrich PS (2012) Nitrogen supported solvent evaporation using continuous-flow microfluidics. RSC Adv 2:1117–11122
13. Schocker A, Lißner B (2012) Fast online emission monitoring of volatile organic compounds (VOC) in wastewater and product streams (using stripping with direct steam injection). Anal Bioanal Chem 402:2669–2674
14. Paul CHL, Fraser S (2005) Microfluidic lab-on-a-chip for chemical and biological analysis and discovery. CRC, Boca Raton