HAL Id: hal-03084619
https://hal.archives-ouvertes.fr/hal-03084619
Submitted on 21 Dec 2020HAL is a multi-disciplinary open access
archive for the deposit and dissemination of sci-entific research documents, whether they are pub-lished or not. The documents may come from teaching and research institutions in France or abroad, or from public or private research centers.
L’archive ouverte pluridisciplinaire HAL, est destinée au dépôt et à la diffusion de documents scientifiques de niveau recherche, publiés ou non, émanant des établissements d’enseignement et de recherche français ou étrangers, des laboratoires publics ou privés.
Benchmarking impact hydrocodes in the strength
regime: Implications for modeling deflection by a kinetic
impactor
Angela Stickle, Megan Bruck Syal, Andy F. Cheng, Gareth S. Collins,
Thomas Davison, Galen Gisler, Nicole Güldemeister, Tamra Heberling,
Robert Luther, Patrick Michel, et al.
To cite this version:
Angela Stickle, Megan Bruck Syal, Andy F. Cheng, Gareth S. Collins, Thomas Davison, et al.. Bench-marking impact hydrocodes in the strength regime: Implications for modeling deflection by a kinetic impactor. Icarus, Elsevier, 2020, 338, pp.113446. �10.1016/j.icarus.2019.113446�. �hal-03084619�
Benchmarking impact hydrocodes in the strength regime: implications for modeling deflection by a kinetic impactor
Angela M. Stickle1, Megan Bruck Syal2, Andy F. Cheng1, Gareth S. Collins3, Thomas M.
Davison3, Galen Gisler4, Nicole Güldemeister5, Tamra Heberling4, Robert Luther5,7, Patrick
Michel6, Paul Miller2, J. Michael Owen2, Emma S.G. Rainey1, Andrew S. Rivkin1, Thomas
Rosch1, Kai Wünnemann5,7
1 Johns Hopkins University Applied Physics Laboratory, Laurel MD, 20723, USA 2 Lawrence Livermore National Laboratory, Lawrence Livermore, CA
3 Impacts and Astromaterials Research Centre, Department of Earth Science and Engineering,
Imperial College London, London, United Kingdom
4 Los Alamos National Laboratory, Los Alamos
5 Museum für Naturkunde, Berlin Germany, Leibniz Institute for Evolution and Biodiversity
Science, Berlin, Germany
6 Université Côte d’Azur, Observatoire de la Côte d’Azur, CNRS, Laboratoire Lagrance, Nice,
France
7 Institute of Geological Sciences, Planetary Sciences and Remote Sensing, Freie Universität
Berlin, Berlin, Germany
Corresponding Author: Angela M. Stickle 11100 Johns Hopkins Rd. M/S 200-W230 Laurel, MD 20723, USA
+1 (240) 228-3822
Abstract
1
The Double Asteroid Redirection Test (DART) is a NASA-sponsored mission that will be the first 2
direct test of the kinetic impactor technique for planetary defense. The DART spacecraft will 3
impact into Didymos-B, the moon of the binary system 65803 Didymos and the resulting period 4
change will be measured from Earth. Impact simulations will be used to predict the crater size and 5
momentum enhancement expected from the DART impact. Because the specific material 6
properties (strength, porosity, internal structure) of the Didymos-B target are unknown, a wide 7
variety of numerical simulations must be performed to better understand possible impact 8
outcomes. This simulation campaign will involve a large parameter space being simulated using 9
multiple different shock physics hydrocodes. In order to understand better the behaviors and 10
properties of numerical simulation codes applicable to the DART impact, a benchmarking and 11
validation program using different numerical codes to solve a set of standard problems was 12
designed and implemented. The problems were designed to test the effects of material strength, 13
porosity, damage models, and target geometry on the ejecta following an impact and thus the 14
momentum transfer efficiency. Several important results were identified from comparing 15
simulations across codes, including the effects of model resolution and porosity and strength model 16
choice: 1) Momentum transfer predictions almost uniformly exhibit a larger variation than 17
predictions of crater size; 2) The choice of strength model, and the values used for material 18
strength, are significantly more important in the prediction of crater size and momentum 19
enhancement than variation between codes; 3) Predictions for crater size and momentum 20
enhancement tend to be similar (within 15-20%) when similar strength models are used in different 21
codes. These results will be used to better design a modeling plan for the DART mission as well 22
as to better understand the potential results that may be expected due to unknown target properties. 23
The DART impact simulation team will determine a specific desired material parameter set 24
appropriate for the Didymos system that will be standardized (to the extent possible) across the 25
different codes when making predictions for the DART mission. Some variation in predictions 26
will still be expected, but that variation can be bracketed by the results shown in this study. 27
28
1. Introduction
29
The Double Asteroid Redirection Test (DART) is a NASA-sponsored mission, currently in Phase 30
C development (as of January, 2019). DART is the first direct test of kinetic impactor technology 31
for planetary defense, and involves the impact of a spacecraft into the moon of a binary system in 32
order to monitor momentum transfer to the target. High-fidelity impact simulations are one tool 33
used to better predict the results of this impact. Because the target of the DART impact is a binary 34
system that has not previously been visited by spacecraft, many of the target properties are 35
unknown and the potential modeling parameter space is large. To deal with this, several different 36
hydrocodes are employed by the team to examine possible effects. This variety of hydrocodes 37
comes with some uncertainty, however, as different codes utilize different numerical techniques 38
and material model implementations. In order to understand better the behaviors and properties of 39
numerical simulation codes applicable to the DART impact, a benchmarking and validation 40
program using different numerical codes to solve a set of standard problems was designed and 41
implemented. The problems are designed to test the effects of material strength, porosity, damage 42
models, and target geometry on the ejecta following an impact and thus the momentum transfer 43
efficiency. Here, we briefly introduce the DART mission concept, kinetic impactors for planetary 44
defense, the hydrocode benchmarking campaign performed by the DART team and collaborators, 45
and the codes used in this study. This is followed by the results of five different benchmarking 46
cases and implications of these comparisons for the impact modeling DART working group. 47
48
1.1 The Double Asteroid Redirection Test 49
Approaches to asteroid impact mitigation fall into four broad categories [Board et al., 2010]: 50
civil defense, slow-push/pull methods, kinetic impact, and nuclear detonation. These approaches 51
are differently suited to various impact scenarios, and they are roughly listed in order of increasing 52
impactor size and decreasing warning time. Deflection by nuclear device has been shown by 53
extensive numerical simulation to be effective against NEOs as large as 1 km in diameter. Testing 54
this method on an asteroid is not necessary, due to its effectiveness and the availability of extensive 55
test history data. The next-most potent mitigation technique, the kinetic impactor, is untested in 56
the regimes where it would be of most use: objects of ~100-300 m diameter. Kinetic impactors are 57
conceptually simple: a mass is thrown at a threatening object and the added momentum of the mass 58
changes the threat’s orbit such that impact with Earth is avoided. Given decadal-scale warning 59
times, imposed speed changes of mm/s to cm/s scales are sufficient for a successful mitigation. 60
To understand the effectiveness of a kinetic impactor, we are reliant upon impact and shock 61
physics codes that are calibrated to laboratory experiments many orders of magnitude smaller in 62
size than a real-world application. Some of the most important questions about the technique, 63
including how much momentum is carried away from the impact by ejecta, and how much the 64
target’s orbit is affected, remain unanswered. 65
NASA’s Double Asteroid Redirection Test (DART) [Cheng et al., 2018] is a planetary defense 66
demonstration mission intended to carry out a kinetic impactor test against a representative target 67
(e.g., one similar to many Potentially Hazardous Asteroids (PHAs)). DART is planned to visit 68
(65083) Didymos, a binary asteroid system with components ~780 m and ~150 m in diameter 69
(informally called “Didymos A” and “Didymos B”) [Naidu et al., 2016]. DART will impact 70
Didymos B at ~6 km/s, changing its orbit period, currently 11.9 hours, by up to several 71
minutes. This period change will manifest in a change in the lightcurve of the Didymos system, 72
in particular a shift in the timing of eclipses and occultations of Didymos A by Didymos B and 73
vice versa. Because the period change is observable in the lightcurve, the required post-impact 74
observations can be made with ground-based telescopes, and the amount of period change can be 75
used to measure the change in speed of Didymos B caused by the DART impact. The spectral 76
characteristics of Didymos A classify the asteroid as an S-type, a type associated with ordinary 77
chondrite meteorites [Dunn et al., 2013], the most common meteorite type seen to fall to Earth, 78
and Didymos B is believed to be composed of similar material (if it co-accreted or formed after 79
rotational disruption of the primary [Walsh et al., 2012]. Didymos is both representative of the 80
population of the most likely impactors and also allows modeling efforts to use a very well-known 81
and common material as the target. 82
83
1.2 Momentum Enhancement by Kinetic Impactor 84
The efficiency of deflection from a kinetic impactor is often measured using the momentum 85
enhancement factor, β, which defines the momentum imparted to the asteroid by impact in terms 86
of the momentum of the impactor. β is defined as: 87
! =#$%&'($,*+,$ .(/0(1$2+3
#24*%1$+& (Eq. 1)
88
where the momentum of the target (here, Didymos-B) post-impact is ptarget,post deflection=masstarget,post
89
deflection*Δvtarget, with masstarget,post deflection = masstarget, initial + massimpactor and the incoming
90
momentum of the impactor (pimpactor) is equal to the DART spacecraft momentum. Here, the mass
of Didymos-B is estimated from the observed size of Didymos-B and assumed material properties, 92
and Δvtarget is the determined from the measured period change. For a general impact simulation,
93
the initial projectile momentum and the mass of the target are inputs to the model and Δvtarget is
94
calculated from the simulation results. Determining β from the DART impact is one the mission’s 95
top level requirements. 96
97
1.3 Impact Simulation and Modeling Working Group 98
The Asteroid Impact and Deflection Assessment (AIDA) concept is an international 99
collaboration framework between NASA and ESA. AIDA was originally composed of the AIM 100
ESA mission [Michel et al., 2016], which is currently re-designed as the Hera mission [Michel et 101
al. 2018] which will be proposed to ESA member states for funding at the ESA Council of 102
November 2019, and the DART mission. As part of the collaboration, an international working 103
group was formed to better understand the range of possible outcomes of the DART impact. DART 104
will join Deep Impact [A’Hearn et al., 2005] and LCROSS [Colaprete et al., 2010; Schultz et al., 105
2010] as one of three full-scale planetary impact experiments, and is the only one in which the 106
deflection of the target will be measured. The goals of this working group are to 1) better 107
understand the magnitude of this deflection by determining the sensitivity of impact models to 108
impact conditions, 2) determine the momentum transfer efficiency, β, from the deflection 109
magnitude, and its sensitivity to target properties, and 3) predict the ejecta mass and putative crater 110
size following the DART impact. All three goals require numerous impact simulations, and will 111
be accomplished using a variety of numerical approaches. 112
113
1.4 Overview of Numerical Shock Physics Codes 114
Simulations of dynamic processes require solving the equations of motion (conservation of 115
mass, momentum and energy) for a given material. The set of equations is closed using a 116
constitutive model. All shock physics codes, which are used to simulate impact processes, solve 117
similar forms of the conservation equations. Constitutive models, however, can vary widely. 118
Typically, a constitutive model is separated into two parts: the volumetric response of the material 119
summarized by a material’s Equation of State (EOS), and the response to deviatoric strains 120
summarized by a strength model. The accuracy of the model predictions depends on how 121
accurately the material models (EOS + strength) replicate material behavior, and how well known 122
the properties included in those models are. Though the conservation equations are consistent 123
across numerical implementations, how they are solved can vary. There are two main methods for 124
solving the equations of motion: an Eulerian solution and a Lagrangian solution. Both methods 125
have historically been used to produce reliable and robust shock codes. 126
The Eulerian solution treats continuum variables (i.e., density, temperature) from a fixed frame 127
of reference. Equations of motion and conservation are solved using a mesh fixed in space so that 128
material moves relative to the mesh. One benefit of the Eulerian method is that it does not suffer 129
from mesh entanglement or oddly-shaped elements. However, Eulerian meshes have historically 130
had difficulty tracking material interfaces, and in a given simulation many cells may include 131
multiple materials; these are called “mixed cells”. Mixed cells require averaging of material 132
properties and state variables within the cell, which can lessen the accuracy of the model’s 133
prediction. Many techniques have been developed to try to deal with this. One such method is 134
adaptive mesh refinement (AMR), which allows areas of high-resolution to be strategically 135
generated within the model that allow better tracking of the shock front and of material interfaces. 136
These regions, and the criteria for increased mesh resolution, are usually pre-defined by the user, 137
and defining appropriate metrics is not always straightforward. These criteria must be carefully 138
chosen in order to avoid introducing other systematic errors into the calculation. 139
In contrast, the Lagrangian method treats continuum variables from a frame of reference fixed 140
with respect to the material. Equations of motion and conservation are solved using a mesh fixed 141
with respect to the material so that the mesh moves through space and deforms along with the 142
material. In general, this can be computationally more efficient than Eulerian solutions. However, 143
care must be taken that the mesh does not distort to the extent that numerical approximations are 144
significantly affected. A variety of approaches has also been developed to deal with strongly 145
distorted meshes. A hybrid approach, which is popular, is referred to as Arbitrary Lagrangian 146
Eulerian (ALE), which allows the computation to remain Lagrangian until some specified 147
condition is met. When that happens, the mesh is allowed to relax according to specified rules as 148
material advects through it. Here, the term “Eulerian” is used to describe this advection process, 149
not necessarily a static grid. Other approaches involve converting strongly distorted elements into 150
Smooth Particle Hydrodynamic (SPH) particles and allowing them to move freely within the mesh. 151
Meshless Lagrangian methods, such as Smooth Particle Hydrodynamics (SPH) and its adaptive 152
versions (e.g., Spheral) use interpolation nodes (particles) to calculate values for parameters of 153
interest. These particles interact through a “kernel function” that has a characteristic radius known 154
as the "smoothing length". The physical quantity of any given particle is obtained by summing the 155
relevant properties of all the particles that lie within the range of the kernel. Because there is no 156
mesh, SPH methods are well-suited to simulate problems with large amounts of deformation, 157
complex boundary dynamics, or for problems where material expands into large volumes. SPH 158
codes can be quite computationally expensive, however, and treating boundary conditions is not 159
always as straightforward as in a gridded code. 160
161
1.5 Sources of Code Variability 162
Variability in code results may arise from the way in which the flow equations are discretized 163
and solved, which differs between codes. Pierazzo et al (2008) performed a study validating 8 164
numerical approaches against each other by looking at impacts into strengthless targets. This initial 165
benchmarking campaign showed some variability in code results stemming from solution 166
algorithms, stability parameters within the codes, and resolutions. For instance, predictions of peak 167
pressures, crater depth, and diameter varied by 10-20% between codes. Additional complicating 168
factors beyond those examined in detail during this initial study, like the effect of material models 169
and how solids behave when they have some strength, are also likely to be important and lead to 170
variation in simulation results. 171
Strength models are used to simulate departures of material response from strictly 172
hydrodynamic behavior. Specific material properties will govern how a material behaves in 173
response to stress, which ultimately leads to differing behaviors of different materials for the same 174
impact conditions. The accuracy of the EOS is especially important early in an impact calculation, 175
when the peak pressures are high and material strength becomes less important near the impact 176
point. As the impact progresses, however, and deformation occurs farther from the point of first 177
contact, material strength (described by the constitutive equation, or, colloquially, material model), 178
becomes important for the cratering process and crater formation. High-fidelity models of material 179
behavior can include things such as, e.g., strain hardening behaviors, rate effects, temperature 180
effects (e.g., thermal softening), porosity, etc. In mechanical testing, geologic materials, including 181
meteoritic material, exhibit all of the above effects, including rate- and temperature-dependent 182
plasticity, and porosity effects [e.g., Kimberley and Ramesh, 2011; Buhl et al., 2013; Zwiessler et 183
al., 2017; Winkler et al., 2018]. How (and if) these effects are accounted for in the numerical codes 184
will affect the predicted impact response of a material. The challenge is to pick appropriate material 185
models that include relevant physics and deformation mechanisms for the materials and problem 186
of interest. 187
In addition to these physical factors, results can also be affected by strictly computational 188
factors. The grid resolution of a given simulation will affect the calculated magnitude of energy 189
deposited into the target during an impact and how that energy propagates through the system. 190
Parameters that are calculated during the simulation are averaged over a given cell (for grid-based 191
solutions), thus a larger cell size (or a lower resolution) will result in increased averaging of 192
parameters across the spatial domain. Therefore, a larger cell size provides less accurate 193
parameters reported for a specific location in the target, and resolution should be closely tracked 194
in simulations. For this study, convergence studies were performed for all of the codes. In impact 195
cratering studies, spatial resolution is often reported in terms of “cells per projectile radius” (cppr), 196
or equivalent. For codes that have adaptively refining mesh (e.g., CTH), the resolution reported is 197
the resolution corresponding to the most highly-refined mesh. For the tests reported here, all 198
projectiles have a diameter of ¼” (6.35-mm). Thus, a resolution of 5 cppr corresponds to a cell 199
size of 0.125 cm, and a resolution of 10, 20, 45, 60 cppr correspond to cell sizes of 0.0625, 0.031, 200
0.007, and 0.005 cm, respectively. 201
202
1.6 The AIDA/DART Benchmarking and Validation Program 203
In order to understand better the behaviors and properties of numerical simulation codes 204
applicable to the DART impact, a benchmarking and validation program using different numerical 205
codes to solve a set of standard problems was designed and implemented. The problems are 206
designed to test the effects of material strength, porosity, damage models, and target geometry on 207
the ejecta following an impact and thus the momentum transfer efficiency. They include 208
simulations of a sphere impacting into a strengthless aluminum target, a strengthless basalt target, 209
an aluminum target with a constant strength (which is easily implementable across codes) and a 210
basalt target with strength, damage, and porosity. A more complicated model, of a basalt sphere 211
impacting a larger basalt sphere is also simulated. All models include standardized equations of 212
state, but, in general, strength and plasticity models are allowed to vary between codes and users. 213
214
2. Methods
215
Impact modeling by numerical simulations is a crucial approach used to interpret the results of the 216
DART kinetic impact deflection experiment, to infer physical properties of the target asteroid, and 217
to advance understanding of impact processes on asteroids. Several distinct types of numerical 218
methods can be used to model the DART deflection experiment, differing in the fundamental 219
approaches to solving flow equations as well as in the modeling of target material properties and 220
responses to impact stresses. Because of the differences in possible code design and method, a 221
benchmarking and validation task was undertaken by the AIDA/DART Impact Modeling and 222
Simulation Working Group in which different numerical codes were applied to solve a set of 223
standard problems (Table 1). The results from these codes were then analyzed and compared to 224
better understand the variability that might be expected in simulations relevant to DART. 225
226 227
Table 1. Summary of the Impact Codes Used in the Study
Code
name Type of mesh Characteristics
Key Code References CTH Eulerian, continuum representation of materials, Adaptive Mesh Refinement 2D and 3D geometry
2-step Eulerian finite difference code Allows multiple materials and rheologies
Strength/damage model usually employed: pressure-dependent yield with Johnson-Cook fracture model to track damage based on plastic strain (scalar damage model)
Porosity: p-alpha porosity model
McGlaun et al. 1990; Crawford et al. 1999 ASPH (Spheral) Smooth Particle Hydrodynamics (meshless) 2D and 3D geometry
Adaptive SPH – smoothing scale varies with direction
Exactly energy conserving
Strength model generally employed: Tensor form of the Benz and Asphaug damage model
Porosity: Strain-alpha porosity model
Owen, et al. 1998; Owen 2014 iSALE-2D Explicit Arbitrary Lagrangian Eulerian, continuum representation of materials
2D geometry; finite difference solutions Allows multiple materials and rheologies
Strength/Damage model generally employed: Pressure-dependent yield based on Collins et al. (2004), which tracks damage based on deviatoric strain Porosity: Epsilon-alpha porosity model (Wünnemann et al. 2006; Collins et al. 2011) Amsden et al. 1980 Wünnemann et al. 2006 RAGE Adaptive Eulerian Grid, Continuous Adaptive Mesh Refinement, continuum representation of materials 1-3D Geometry; Multidimensional simulations
Radiation Adaptive Grid Eulerian Adaptive mesh and time steps Inlcudes: Radiative transfer, heat conduction
SESAME and analytical EOS available Multiple strength models available
Gittings et al. 2008
Porosity: p-alpha porosity model
PAGOSA Eulerian, Continuum
3D, fixed grid, Eulerian Hydrocode 2nd order accurate in time, 3rd order
accurate in space
Adaptive time steps
Allows multiple materials per cell Variety of strength models available, Johnson-Cook damage model usually employed
SESAME and analytical EOS availabel Porosity: p-alpha porosity model
Weseloh,
Clancy, and Painter, 2010
229
Though relevant to modeling for the DART mission, the aim of the presented study is to evaluate 230
the results of several numerical codes against one another in a standard set of cases rather than for 231
the actual DART impact. Basalt and aluminum were chosen as projectile and target materials for 232
many of the cases because of the availability of extensive experimental databases and because 233
these materials are already implemented or can be implemented readily for impact simulations. 234
The EOS was standardized between models so as to remove that as a variable (Table 2, Table 3). 235
Where appropriate, strength parameters for aluminum and basalt were also proscribed (Table 4). 236
The four standard cases (summarized in Figure 1 and Table 5) were intended to isolate the effects 237
of: 1) impact flow field modeling, 2) brittle failure and fracture effects, 3) target porosity effects, 238
and 4) finite size target effects. These were investigated by examining specific variables of interest 239
to the DART project, including: the momentum enhancement factor, β, the ejected mass, the crater 240
size (width and depth), and the peak pressures beneath the impact point. Note that strength changes 241
as a function of porosity were neglected in these cases. This limits the number of parameter 242
changes between models and allows for better understanding of controlling parameters. 243
244
Table 2. Summary of parameters in the Mie-Grüneisen EOS for aluminum 6061
245
Material density for R0 (initial Hugoniot) T0 (initial temp) Sound speed (Cs) S1 Grüneisen parameter Specific heat (cal/g*degC)
Al-6061 2.703 2.59E-2 eV 5.22 km/s 1.37 1.97 1.07E+11 246
Table 3. Summary of parameters for the Tillotson EOS [Benz and Asphaug, 1999; Tillotson, 1962]
Material (kg/mrho0 3) A (J/m3) B (J/m3) E0 (J/g) Eiv (J/g) (J/g) Eev a B alpha β
Basalt 2700 2.60E+10 2.67E+10 4.87E+5 4.72E+3 1.82E+4 0.50 1.50 5.00 5.0a
Aluminum 2700 7.52E+10 6.50E+10 5.00E+3 3.00E+3 1.50E+4 0.5 1.63 5 5 a. Tillotson parameter for lunar gabbroic anorthosite [O’Keefe and Ahrens, 1982], substituting
248
the basalt reference density and bulk modulus as reported by Nakamura and Fujiwara (1991) 249
250
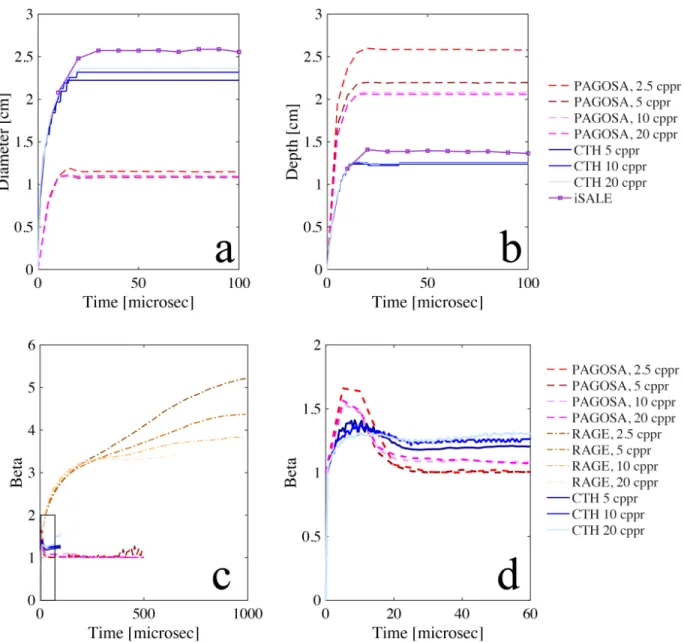
Table 4. Summary of parameters prescribed for basalt and Al-6061
251 Basalt Fully dense 20% porosity 45% porosity 60% porosity Density [kg/m3] 2800 2600 1500 1200
Quasistatic Compressive strength
[MPa] 400 400 400 400
Dynamic Compressive Strength
[MPa] 600 600 600 600
QS Tensile strength [MPa] 30 30 30 30
Dynamic Tensile Strength [MPa] 80 80 80 80
Toughness Mpa √(m) 1.6 1.6 1.6 1.6
Youngs Modulus [GPa] 70 70 70 70
Shear Modulus [GPa] 29 29 29 29
Bulk Modulus [GPa] 49 49 49 49
Coefficient of Friction 0.6 0.6 0.6 0.6
Poisson's ratio 0.25 0.25 0.25 0.25
Aluminum
Al-6061, constant strength
Yield Strength 275 MPa -- -- --
Poisson's ratio 0.33 -- -- --
Porosity 0% -- -- --
253
Figure 1. Schematic of standard benchmarking cases sent to each team. Cases were designed as
254
laboratory-scale simulations and to isolate specific effects. Standard materials and models were 255
assumed across the codes. 256
257 258 259
Table 5. Summary of the initial 4 cases compared across codes and their purpose
260
261 262
A fifth case was designed to validate the numerical simulations against a hypervelocity impact 263
experiment performed at the NASA Ames Vertical Gun Range (AVGR). This case was not 264
simulated using every code. The experiment was a 90° impact, at 2.1 km/s, into a 10 cm x 10 cm 265
x 10 cm block. The block was made of two parts: 1 10 cm x 10 cm x 5 cm basalt block affixed to 266
a 10 cm x 10 cm x 10 cm polymethylmethacrylate (PMMA) block. The PMMA was chosen to 267
match impedance with the basalt and was used as a window to examine crater growth as a function 268
of time following impact (Figure 2A,B). Because the purpose of this case was specifically to 269
Projectile Target Velocity Impact Angle (deg)
Projectile EOS
Target
EOS Projectile Plasticity Model
Target Plasticity
Model Damage model Porosity Model Porosity value Intended to study Resolution (cppr or equivalent) Geometry Case 1a 0.635-cm Al sphere Al halfspace 5 km/s 90 Mie-Grüneisen Al 6061 Mie-Grüneisen Al 6061
none none none none 0 Impact flow field
modeling 3,5,7 (LLNL, 3D) 5,10,20,40 (LLNL, 2D) 2D, 3D Case 1b 0.635-cm basalt sphere basalt
halfspace 5 km/s 90 Tillotson Tillotson none none none none 0
Impact flow field
modeling 2D, 3D Case 2 0.635-cm basalt sphere basalt
halfspace 5 km/s 90 Tillotson Tillotson
user specified/code dependent user specified/code dependent user specified/code dependent
none 0 Brittle failure and
fracture effects 5, 10, 20 2D, 3D Case 3 0.635-cm basalt
sphere basalt
halfspace 5 km/s 90 Tillotson Tillotson
user specified/code dependent user specified/code dependent user specified/code dependent user specified/code dependent 20, 45, 60% Target Porosity effects 2D, 3D Case 4 0.635-cm basalt sphere 30-cm basalt
sphere 5 km/s 90 Tillotson Tillotson
user specified/code dependent user specified/code dependent user specified/code dependent user specified/code dependent
Finite target size
effects 2D, 3D Constant Strength 0.625-cm Al 6061 sphere Al 6061 halfspace 5 km/s 90 Mie-Grüneisen Al 6061 Mie-Grüneisen Al 6061
von Mises von Mises none none none
Impact flow field with simple strength model
compare and validate numerical simulations against experimental results (e.g., Figure 18), the 270
impact geometry and velocity are not required to match the other 4 Cases. Rather, this experiment 271
serves as a “blind” test of the simulations accuracy because the experimental results were not 272
shown to the specific individuals tasked with simulating the experiment prior to running the model 273
and reporting the results. The simulated case modeled the impact of a 0.635-cm Pyrex sphere into 274
a 10-cm x 10-cm x 10-cm basalt block at 2.1 km/s, neglecting the PMMA window for simplicity. 275
The choice of EOS, plasticity, and damage model was left to the user. However, the basalt block 276
was stipulated to have the following properties: quasi-static uniaxial compressive strength = 400 277
MPa; dynamic uniaxial compressive strength = 600 MPa; Quasi-static tensile strength = 30 MPa; 278
Dynamic tensile strength = 80 MPa; Youngs modulus = 70 GPa ; density = 2800 kg/m3; and
279
fracture toughness = 1.6 MPa √m. These parameters were determined from the specific basalt 280
samples used in the experiment (Figure 2C,D). 281
282
283
Figure 2. Setup for the experiment for comparisons in Case 5. a) Schematic of impact geomery;
284
b) setup of the actual impact experiment, showing the basalt block with PMMA window. Impacts 285
were from the top at the center of the block, and the block was set atop two glass slides to minimize 286
interactions with the floor of the vacuum chamber following impact; c) small cutout showing 287
texture of the basalt with visible olivine phenocrysts; d) thin section of the basalt used. The basalt 288
was a fine-grained Columbia River flood basalt. 289
290
2.1 Codes Used in This Study 291
2.1.1 CTH Simulations
292
CTH is an Eulerian shock-physics code developed at Sandia National Laboratories [McGlaun
293
et al., 1990] that has been applied to a wide variety of high speed large deformation problems, e.g. 294
planetary impact cratering. It has the ability to perform multi-dimensional, multi-material 295
calculations for a wide range of material models and EOS. For all benchmark cases both 2D and 296
3D CTH simulations were performed to examine its effect on β as well as the crater dimensions. 297
All simulations were run using CTH version 12.0. 298
The amount of momentum transfer from the impact as a function of time, β(t), was calculated 299
for each simulation. All mass in the simulation moving upward (positive y direction in 2D, positive 300
z direction in 3D) in the plane above the initial impact plane was assigned as “ejecta mass”. The 301
ejecta momentum was then calculated as, 56 = 7686, where pi is the momentum of the ith piece of
302
ejecta, mi is its mass, and vi is the ejecta velocity. The 90% percentile velocity for ejecta at a given
303
time step was calculated and used. To limit computational requirements, the mesh extent was 304
limited. All mass crossing the mesh boundary (and thus leaving the simulation) was tracked. This 305
lost momentum was defined as the lost mass times the 90th percentile of the ejecta velocities at a
306
given time step. The momentum multiplication factor, β, is calculated as the sum of the ejecta 307
momentum and lost momentum divided by the projectile momentum for all pieces of ejecta mass. 308
Impact crater dimensions were calculated using two different algorithms, “simple” and 309
“robust”. For nonporous simulations, the depth and width of the crater were calculated with a 310
“simple” method: The cells of the target material along the projectile velocity vector were tracked, 311
and the minimum absolute value of the height location of any of these cells was assigned as the 312
crater depth. Crater diameter (width) was calculated by tracking the cells along the impact plane. 313
The minimum absolute value of the non-depth dimensions (y in 2D, x and y in 3D) corresponds to 314
the side of the impact crater. Crater diameter was assumed to be the distance between cells along 315
this crater profile on the plane where the projectile first contacted the target. 316
Simulations of impacts into porous targets generated numerical artifacts that disrupted the 317
“simple” algorithm described above, and a more robust algorithm was needed. For example, in 318
2D simulations a small upward moving jet along the centerline was seen, which resulted in an 319
artificially shallow crater being identified using the simple algorithm described above. The 320
“robust” algorithm is defined here: to calculate crater depth, the algorithm was modified and a 321
scan along the dimensions of interest was performed, i.e., along the x-direction in a 2D simulation 322
or along the x and y-direction in a 3D simulation. The minimum absolute value of the height 323
location was recorded for each cell column in these dimensions. The global minimum of these 324
values thus defines the crater depth. Care was taken to ensure that if small vacancies exist in the 325
impacted material, these vacancies were not mistaken for the crater floor. Calculating crater width 326
required a similar scan to be performed in the appropriate dimensions along the impact plane (y=0 327
for 2D, z=0 for 3D). The width was defined as the maximum value of the vector length connecting 328
impacted material. 329
Adaptive Mesh Refinement (AMR) [Crawford, 1999] was utilized in all simulations for
330
computational efficiency, with refinement occurring for all projectile material and at moving 331
interfaces. For 2D simulations, the resolution ranged from 5-20 cppr while for 3D simulations the 332
resolution ranged from 2.5-5.5 cppr. Convergence tests were performed for Case 1a and Case 2 333
(in 2D) and Case 1a (in 3D) to examine the effect of resolution on crater dimensions and 334
momentum transfer. The effect of grid size on the calculation of β was also examined. Resolution 335
studies determined that the calculated β was not dependent on the extent of the mesh so long as 336
the ejecta mass was accurately tracked. 337
338
2.1.2 CTH Parameters
339
Two separate strength and damage models were used within CTH for these benchmarking 340
cases: the “geo” model and the “BDL” model. The “geo” yield surface is a pressure-dependent 341
yield surface incorporating thermal softening and density degradation. This yield behavior was 342
coupled to a Johnson-Cook fracture (JCF) model to track damage within the material. The JCF 343
model is a scalar damage model used to predict failure of materials [Johnson and Cook, 1985]. A 344
damage parameter, D, ranges from 0 (pristine, undamaged material) to 1 (failed material), where 345
D is a function of equivalent plastic strain rate, local value of plastic strain to fracture, pressure, 346
local yield stress, temperature and loading path. Here, D is assumed to be a function of the local 347
value of plastic strain to fracture and material heterogeneity (in the form of Weibull distributed 348
flaws) only. Damage by extensional failure (spallation) occurs when the material undergoes 349
stresses higher than the maximum tensile stress. 350
The second strength and damage model used in CTH benchmarking simulations was the Brittle 351
Damage with Localized Thermal Softening (BDL) model [Crawford et al., 2013; Schultz and 352
Crawford, 2016]. This model includes a pressure-dependent yield and brittle damage model 353
similar to that of Collins et al. [2004], in which the plastic strain at failure increases across the 354
brittle and ductile regimes and the yield strength of fully damaged material follows a Coulomb 355
friction law. The BDL model also incorporates a pressure-dependent melt curve [Senft and 356
Stewart, 2009] to compute thermal softening and a statistical crack model [Schultz and Crawford, 357
2016]. The crack spacing follows a power law in strain rate, and within cracks localized 358
temperature changes are induced by frictional shear heating and heat loss due to thermal 359
conduction. 360
For Case 5, which differs slightly from the prescribed Cases 1-4, CTH simulations were run 361
with the Tilltoson equation of state and the BDL model with stipulated strength parameters for 362
basalt. The Pyrex projectile was simulated using a Mie-Gruneisen equation of state and a pressure-363
dependent yield surfaces with parameters from Stickle and Schultz [2014] and Marsh [1980]. The 364
parameters for the Pyrex were set to mimic the breakup behavior seen in experiments. A Johnson-365
Cook continuum damage model (“Johnson-Cook Fracture, [Johson and Cook, 1985]) was added 366
with a strain-to-failure of 5%, a melting temperature of 2900K, a tensile strength of 1.8 GPa and a 367
Weibull modulus of 10. 368
369
2.1.3 Adaptive Smooth Particle Hydrodynamics
370
Spheral is an open-source Adaptive Smoothed Particle Hydrodynamics (ASPH) code [Owen et al., 371
1998; Owen, 2010], which has been used extensively for small-body cratering studies [Owen et 372
al., 2014; Owen et al., 2015; Bruck Syal et al., 2016a; Bruck Syal et al., 2016b]. Meshless 373
hydrodynamics methods such as ASPH allow for the momentum carried in crater ejecta to be 374
calculated in a relatively straightforward manner as the ejecta particles are automatically tracked 375
as they move. Spheral differs from most standard implementations of SPH in that the smoothing 376
scale between particles can vary with direction, which allows for more realistic treatment of 377
strongly anisotropic strain fields; it is also exactly energy conserving [Owen et al., 2014]. 378
For this study, most Spheral simulations were carried out in a fully 3D geometry, so that damage 379
propagation in the basalt targets could be more accurately tracked. Some axisymmetric (2D) 380
simulation for Case 1 (aluminum target, without damage) were carried out to assess differences 381
between 2D and 3D geometries. Convergence tests were performed for both crater size and 382
momentum transfer in 2D and 3D simulations. Note that Spheral resolution is described by “nrI,” 383
the number of ASPH particles per impactor radius (similar to the cells-per-projectile-radius or 384
“cppr” metric used by meshed codes). 385
Half-space targets (Cases 1, 2, and 3) were modeled using high resolution in the area of crater 386
formation (5-7 particles-per-projectile-radius, out to a radius of 3 cm), with resolution gradually 387
becoming coarser towards the edge of the domain (at a radius of 12 cm). These limits were chosen 388
through an iterative process to determine when simulation results were not affected by interactions 389
at the edge of the target, and through comparisons with constant-resolution targets. Similarly, high 390
resolution (5 particles-per-projectile-radius) was used near the crater in Case 4 (30-cm spherical 391
target), with resolution gradually coarsening beyond 5 cm in radius from the impact point. Uniform 392
resolution (5 particles-per-projectile-radius) was used in Case 5 (10-cm cube target). 393
Tillotson EOS parameters were used for all aluminum and basalt materials (Table 3). For all 394
cases, summaries of parameters used can be seen in Appendix A. For the Pyrex impactor in Case 395
5, Mie-Gruneisen coefficients from Stickle & Schultz (2012) were chosen to represent the Pyrex. 396
Aluminum strength, when used, was represented using the von Mises criterion, using a constant 397
yield strength of Y0 = 275 MPa and a shear modulus of G = 26.5 GPa. Basalt targets also used 398
von Mises strength, with Y0 = 1 GPa and G = 29 GPa. This strength model was coupled to a tensor 399
generalization of the Benz-Asphaug implementation of Grady-Kipp damage for SPH codes [Benz 400
and Asphaug, 1994]. The damage model used a version that is compatible with particles of varying 401
resolution and applied the “pseudo-plastic” strain algorithm, with k = 5e24 cm-3 and m = 9.0 for 402
the Weibull constants. Porosity was modeled using the e-a strain-based model [Collins et al., 403
2011], with values of ee = 0.0, ec=-0.4, and k = 0.8. Case 3 (half-space target) used porosities of 404
f = 0.2 and 0.4 and Case 4 (sphere target) used f = 0.2. For Case 5, which aimed to simulate a real 405
basalt target used in an impact experiment, we assumed that some natural porosity would have 406
been present in the sample (~7%), and used a reference density of 3.01 g/cc so that the bulk density 407
of the block was 2.8 g/cc (the measured value). 408
409
2.1.4 iSALE simulations
410
The iSALE-2D shock physics code [Wünnemann et al., 2006] is based on the SALE hydrocode 411
solution algorithm [Amsden et al., 1980]. SALE was modified to include an elasto-plastic 412
constitutive model, fragmentation models, various EOS, and multiple materials in order to simulate 413
hypervelocity impact processes in solid materials Melosh et al., 1992; Ivanov et al., 1997]. More 414
recent improvements include a modified strength model [Collins et al. 2004] and a porosity 415
compaction model [Wünnemann et al., 2006; Collins et al., 2011]. 416
iSALE was used to simulate Cases 1-4. The Tillotson EOS was used in all cases, the “ROCK” 417
strength model [Collins et al., 2004] was used for basalt in all cases requiring strength, while the 418
Johnson-cook strength model [Johnson and Cook, 1983] was used for aluminum. The “Collins” 419
damage model [Collins et al., 2004] was used where a damage model was present, and has shown 420
accurate results for comparisons with laboratory experiments on competent rocks in previous 421
studies [Güldemeister et al. 2015, 2017, Winkler et al. 2018]. For cases requiring porosity, the ε-422
α [Wünnemann et al., 2006; Collins et al., 2011] was used. A convergence study was performed 423
for Cases 1a’ and 2, with resolutions ranging from 5-60 cppr. 424
The mass and velocity of ejected material is analysed with the help of Lagrangian tracer 425
particles that are initially distributed uniformly across the computational domain, in the centre of 426
each computational cell. These tracers follow the velocity field of the material flow in the Eulerian 427
grid. Upon ejection, which is defined as the moment when the tracer reaches an altitude of one 428
projectile radius, the speed and angle of ejection and the radial launch position is recorded. The 429
upward directed momentum represented by each ejected tracer particle is summed and normalised 430
by the impactor momentum to derive a ! value for the simulation. A significant benefit of this 431
approach is that once the tracer particle has crossed the ejection altitude the material that it 432
represents no-longer needs to be tracked. This ensures accurate recording of even the fastest ejecta 433
and negates the need to record momentum lost from the computational domain. Studies of the 434
effects of target properties on ejecta characteristics that include a more detailed description and a 435
validation of this approach were recently published [Luther et al. 2018, Raducan et al., submitted]. 436
This approach has successfully reproduced the morphometry of ejecta deposits formed in 437
laboratory experiments [Wünnemann et al. 2016] and surrounding lunar craters [Zhu et al., 2015], 438
and was used to quantify momentum enhancement for strength-dominated target materials in low-439
gravity environments applicable to the DART mission scenario [Raducan et al., submitted]. In 440
Case 1a’, β was calculated from the cell momenta (a similar method to that employed in CTH) 441
instead of the tracer method to reduce intercode variability. 442
443
2.1.5 Radiation Adaptive Grid Eulerian (RAGE)
444
RAGE is a multi-dimensional, multi-material Eulerian shock physics code developed by Los 445
Alamos National Laboratories (LANL) [Byrne et al., 1992; Gittings et al., 2008]. The code 446
includes adaptive time steps, adaptive mesh refinement, a p-α porosity model, a variety of strength 447
models, and both SESAME [Lyon and Johnson, 1992] and analytical EOS capabilities. RAGE was 448
used to simulate Case 1a (strengthless models) for impacts in both aluminum and basalt, and Case 449
1b for impacts into aluminum with a Steinburg-Guinan plasticity model [Steinberg et al., 1980]. 450
A resolution test was performed for each case, with the finest resolution of 0.031 cm (20 cppr). 451
Since RAGE is an AMR code, the resolution refers to the finest allowed resolution. The code 452
automatically refines or coarsens cells according to the gradients of the state variables in 453
neighboring cells, so that the mesh is refined to a high resolution in the presence of shocks and 454
coarsened in areas where there is little motion. 455
The simulations were carried out on a 2-D cylindrical axi-symmetric grid, with the impact on 456
the axis of symmetry. Eulerian codes cannot support empty mesh cells, therefore a background 457
atmosphere is included in all cases. A 1 bar SESAME air EOS is used as a background material 458
for models of laboratory experiments in air, and a 100 microbar monatomic ideal gas is used for 459
models of impacts in vacuum. 460
461
2.1.6 PAGOSA
462
PAGOSA [Weseloh et al., 2010] is a massively parallel hydrocode developed by LANL to simulate 463
multi-dimensional dynamic behavior of solid materials subjected to high-strain rates, like those 464
produced by hypervelocity impacts. PAGOSA is an Eulerian finite-difference code, has adaptive 465
time steps, a p-alpha porosity model, multiple strength models, and both SESAME and analytical 466
EOS capabilities. It uses an up-stream weighted, monotonicity-preserving advection scheme that 467
conserves momentum and internal energy. PAGOSA uses a fixed grid mesh throughout the entire 468
simulation. Cell size may be varied spatially so that some regions of the mesh have a higher 469
resolution than others, but the mesh cannot change over the course of the calculation. 470
Homogeneous-sized meshes are used throughout this work, with all cells in the mesh at the 471
reported resolution of the specified model. A resolution test was performed for each case, with the 472
finest resolution of 0.031 cm (20 cppr). PAGOSA was used to simulate Case 1a strengthless 473
models and Case 1b impacts into aluminum with a Steinburg-Guinan plasticity model [Steinberg 474
et al., 1980]. The models were run as 2D axisymmetric models for efficiency. 475
For both RAGE and PAGOSA simulation, the momentum of all material moving in the 476
positive y-direction (up in the images, opposite the impact velocity direction) above the original 477
target surface was tracked and added to the original projectile momentum. This quantity was then 478
divided by the original projectile momentum to determine the momentum enhancement factor, β. 479
480
3. Benchmarking Results
481
Benchmarking impact codes requires identification of standard cases that are repeatable across 482
different codes that allow a comparison of the performance in accuracy, speed, and reliability. This 483
testing requires detailed comparison of simulation results and characteristic quantities across the 484
codes. Here, we compare crater growth and dimensions, peak pressures in the target following 485
impact, and the momentum enhancement factor, β. We present results from the time of impact 486
until the crater size and β have stabilized. Not every case includes results from each numerical 487
method. 488
489
3.1 Case 1 – ¼” sphere into half-space (strengthless) 490
The first benchmarking case was designed to identify how codes behave with respect to one 491
another using the simplest model: a strengthless target. This setup requires no additional material 492
constitutive behavior outside the equation of state. This case was initially broken into two parts: 493
Case 1a, an aluminum sphere impacting into an aluminum target, and Case 1b, a basalt sphere 494
impacting into a basalt target. All material in Case 1a and 1b was simulated using only an EOS 495
with no additional plasticity model. This separation was intended to provide a better understanding 496
of the effects of differing EOS on the β calculation. Following initial simulation tests, a third 497
variant was added to Case 1, called Case1a’ here. This variant included simulations using constant 498
strength (represented using a von Mises plasticity model) for the aluminum block. This simple 499
strength approximation is available in most widely used codes and thus represented an initial 500
baseline to better understanding the natural variability found between codes when strength is 501
included. Because it is implemented widely, this provided a more direct comparison between codes 502
than later cases which include significantly more variation in plasticity and damage model 503
implementation and choices between codes. These results are summarized below. 504
Figure 3 shows the results from Case 1a and 1b using 5 different numerical codes. Spheral, 505
RAGE and PAGOSA performed a convergence test for this case. More detail regarding the results 506
of the RAGE and PAGOSA convergence study are summarized in Heberling et al. [2017]. For 507
both Spheral and PAGOSA simulations, predicted β decreases with increasing resolution. This 508
trend is opposite for RAGE simulations, where β increases as resolution increases. 509
Crater size shows the least variation between codes. Note that because the simulations do not 510
include material strength, there is nothing to stop the crater growth, and the values for depth and 511
diameter do not asymptote. This is expected, so a common stop time was prescribed for these 512
simulations. Here, we chose 400 µsec, as this time would be well beyond the transient crater 513
formation time for a typical laboratory experiment. There is a larger variation in the reported values 514
for momentum enhancement factor, β, thus it is shown until 100 µsec for clarity. A more complete 515
summary of values from each code is shown in Appendix B, however a few noted results are 516
summarized here in Table 6. At 100 µsec following impact, there is a 3-4% difference in crater 517
depth and diameter between codes, while the percent difference between the minimum and 518
maximum β is 37% for comparable resolution. At 400 µsec this difference is 3.5%, 6% and 15% 519
difference in depth, diameter, and β predictions. For comparable resolutions, 2D CTH simulations 520
predict the largest crater and β values at 400 µsec. The large scatter between the CTH and 521
PAGOSA simulations for impacts into a strengthless basalt target is likely due to the fact that the 522
CTH simulations modeled a target with 0% porosity while the PAGOSA and RAGE simulations 523
modeled a basalt target with 50% porosity. Higher porosity will result in deeper, narrower craters, 524
and lower β. This is generally what is seen in all but the lowest resolution PAGOSA models. 525
However, 2.5 cppr is such a coarse resolution that the results are not likely to be accurate. From 526
the CTH simulations, we see that there is not a large difference between predicted crater depth, 527
diameter and β values due to the EOS differences between aluminum and basalt. 528
529
Table 6. Summary of crater size and β for strengthless aluminum targets (Case 1a) at 100 and 400
530
µsec following impact for simulations with comparable resolution. When a given result was not 531
supplied by specific modelers, it is marked as “not provided” in the table. Gridded codes resolution 532
is reported in “cells per projectile radius” (cppr), while the resolution for the ASPH code is reported 533
in “nrI”, which refers to the number of ASPH particles per impactor (projectile) radius. A full 534
summary at all resolutions can be seen in Appendix B. 535
Model Resolution Case Time [us]
Crater Depth [cm] Crater Diameter [cm] b
iSALE 40 cppr 1a 100 3.05 5.37 4.02 CTH (2D) 20 cppr 1a 100 3.20 5.54 4.54 RAGE 20 cppr 1a 100 not provided not provided 5.40 PAGOSA 20 cppr 1a 100 3.17 5.47 6.45 Spheral (2D) nrI = 20 1a 100 not provided not provided 5.92 iSALE 40 cppr 1a 400 4.87 8.87 8.68 CTH (2D) 20 cppr 1a 400 5.18 9.19 10.22 PAGOSA 20 cppr 1a 400 5.10 9.12 10.16 RAGE 20 cppr 1a 400 5.2 8.4 9.14 536 537 538 539
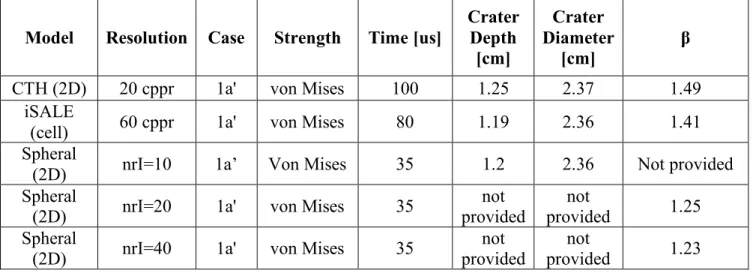
Figure 3. Summary of impacts into strengthless aluminum (a-c) and basalt (d-f) targets. All
540
impacts are in 2D geometry for a 90° impact at 5 km/s. Model parameters are summarized in 541
Tables in Appendix A. Note that because the simulations do not include material strength, the 542
crater sizes and β continue to grow. a) crater diameter, in centimeters, as a function of time for ¼” 543
strengthless aluminum sphere impacting into a strengthless aluminum half-space; b) crater depth, 544
in centimeters, as a function of time for ¼” strengthless aluminum sphere impacting into a 545
strengthless aluminum half-space; d) β as a function of time for ¼” strengthless aluminum sphere 546
impacting into a strengthless aluminum half-space; d) crater diameter as a function of time for ¼” 547
strengthless basalt sphere impacting into a strengthless basalt half-space; e) crater depth as a 548
function of time for ¼” strengthless basalt sphere impacting into a strengthless basalt half-space; 549
f) β as a function of time for ¼” strengthless basalt sphere impacting into a strengthless basalt half-550
space. 551
552
553
Figure 4. Comparison of 3D Spheral and CTH simulations of impacts into strengthless aluminum
554
targets. All impacts are at 90° at 5 km/s. Model parameters are summarized in Appendix A. Note 555
that because the simulations do not include material strength, the crater sizes and β continue to 556
grow. a) crater diameter, b) crater depth, c) β. 557
558
Table 7. Summary of crater size and β at 100 and 400 µsec following impact for simulations with
559
comparable resolution. When a given result was not supplied by specific modelers, it is marked as 560
“not provided” in the table. A full summary at all resolutions can be seen in Appendix B. 561
562
Model Resolution Case Time [us] Crater Depth
[cm] Crater Diameter [cm] β CTH (3D) 6 cppr 1a 100 3.19 5.45 3.68 Spheral (3D) nrI = 3 1a 100 not provided not provided 1.95 Spheral (3D) nrI = 5 1a 100 2.69 4.24 3.12 Spheral (3D) nrI = 7 1a 100 2.80 4.42 3.87 563
Three-dimensional calculations of Case 1a were also run using CTH and Spheral, and the results 564
are shown in Figure 4 and summarized in Table 7 and in Appendix B. An additional convergence 565
study was performed using the Spheral code in 3D. β values converge at slightly finer resolution 566
(20 particles-per-projectile-radius) but converge similarly for 2D and 3D. Crater depths and 567
diameters did not significantly differ between 2D and 3D for the aluminum targets, when run with 568
or without von Mises (constant) strength; values for both were found to be converged at a 569
resolution near 5 particles-per-projectile-radius. For simulations in 3D and at comparable 570
resolution (5 cppr for CTH and nrI=5 for Spheral), CTH consistently predicted larger craters, with 571
a 3% difference in crater diameter and 15% difference in crater depth at 100 µsec following impact. 572
There is a 15% difference in prediction of β as well. 573
574
Another parameter that is commonly analyzed following impact is the peak pressures within the 575
target. Here, peak pressure along a line vertically below the target as well as at depth along a 45° 576
slope was documented for each simulation (Figure 5). This case is similar to what was modeled in 577
the initial benchmarking study by Pierazzo et al. [2008] (an impact into a strengthless aluminum 578
target, though here the impactor is much smaller). For a 5 km/s impact, Pierazzo et al. [2008] 579
reported a 15% difference in slope between codes for the pressure decay region. Here, the 580
difference in slope of the pressure-decay region is dependent on where the peak pressures were 581
measured. For a line at a 45° angle radially from the impact point, the two codes predict peak 582
pressures within 5% of one another (Table 8, 9). However, when the peak pressure is measured 583
directly below the impact point, which is the generally reported direction for pressure decay 584
estimates in vertical impact simulations, there is a much greater difference in slopes (~40%). These 585
differences may be due to a number of things, including internal numerics of the codes themselves, 586
noise from boundary effects along the center-line of 2D simulations, as well as input parameters 587
chosen for each simulation. Though both codes show convergence, one obvious choice may be the 588
resolution of the simulations: the iSALE simulation was run at 40 cppr while CTH was run at 20 589
cppr. Another may be the choice of EOS parameters. Here, iSALE used the EOS for Al-1100, 590
while the CTH simulations used the parameters proscribed in Table 3, which may differ slightly 591
and affect the simulation results at early times or very near the surface (when pressures are high). 592
593
594 595
Figure 5. Pressure as a function of depth for impacts into strengthless aluminum (left) and
596
aluminum with a constant strength (right) for simulations using CTH, iSALE, and Spheral. The 597
offset in the Spheral simulation is likely due to difficulty of defining stationary Eulerian tracer 598
points in a meshless code, which is a relatively new capability in Spheral. 599
601
Table 8. Summary of peak pressure with depth for CTH, Spheral, and iSALE models of impacts
602
into a strengthless aluminum block. “diagonal” refers to tracers along a 45-deg diagonal from the 603
impact point, while “vertical” refers to a vertical line directly below the impact point 604
605
Case 1a
Strengthless Peak Pressure [GPa]
diagonal Depth [cm] CTH iSALE 0.5 11.80 11.87 2 1.91 2.23 3.5 0.76 1.10 4.5 0.50 0.80 5 0.45 0.69
Peak Pressure [GPa]
vertical depth [cm] CTH iSALE 0.5 14.58 17.22 1 5.49 9.32 1.5 3.49 5.96 3 1.80 2.68 3.5 1.57 2.19 4 1.42 1.84 4.5 1.23 1.58 5 1.02 1.37 606
Table 9. Slope of the pressure decay region for simulations of strengthless material
607
Slope iSALE slope
CTH % difference
diagonal -0.52 -0.49 5.34%
vertical -1.99 -1.12 43.84%
608 609
3.2 Case 1a’: ¼” Sphere into Constant Strength Aluminum half-space 610
611
Figure 6. Summary of results of a convergence study for the iSALE-2D (left), Spheral (middle),
612
and CTH (right) codes for an impact of a ¼” aluminum projectile into an aluminum target that is 613
modeled as having constant strength. Panels show crater diameter(top), crater depth (middle) and 614
β (bottom) for all three codes as a function of time and resolution. A comparison for the highest 615
resolution simulations can be seen in Figure 7. 616
617
A modified Case1a in which a simple constant-strength (von Mises) strength model was employed 618
was also run using most of the models (Case 1a’). This case was performed specifically to 619
investigate intercode variability in strength model implementation and resolution dependence. In 620
order to minimize intercode differences resulting from human analysis, β as a function of time was 621
calculated from iSALE simulation results in a similar manner to CTH results, rather than using 622
tracer particle data. The instantaneous upward momentum of all material in the mesh above the 623
preimpact surface was integrated and the momentum of any material leaving the mesh through the 624
top boundary was accounted for. Crater size and momentum enhancement as a function of time 625
were compared for each simulation. Results are shown in Figure 6, Figure 7, and in Table 11 and 626
Table 12. 627
In this particular impact scenario, a significant portion of the uplifted crater rim acquires 628
substantial upward momentum during cratering, before being decelerated to rest by the target’s 629
strength as crater growth is arrested. This acceleration and deceleration implies that the upward 630
momentum (β) of material above the surface first increases to a maximum, before decreasing 631
asymptotically to the residual, ejected momentum. Figure 6 shows results of convergence studies 632
performed using the iSALE-2D code, CTH and Spheral. Note that for crater size, values converge 633
at a spatial resolution of approximately 10-20 cppr; however, convergence of the momentum 634
enhancement factor requires higher spatial resolution of around 20-40 cppr, depending on the code 635
used. This resolution sensitivity may be specific to this particular impact scenario, because the 636
strength values chosen for this set of simulations resulted in a low cratering efficiency and high-637
speed ejecta, which often requires high resolution to track accurately. If the resolution of the 638
simulation is too low, the high-speed ejecta is not well resolved and hence the ejected momentum 639
is underestimated. 640
The von Mises strength model is simple and widely implemented across different codes 641
allowing for informative intermodel comparison. The values to be used in these simulations were 642
prescribed to the modelers (Table 5). Figure 7 shows results for simulations using CTH, iSALE-643
2D, and Spheral. The highest resolution from Figure 6 for each code was plotted as a comparison. 644
The inter-code variability is low. Crater size predictions are within 5% of one another, with the 645
greatest difference between CTH and iSALE-2D crater depth predictions (5%). The β value 646
predictions vary more widely at 17% difference between the different codes (Table 10). 647
648
For Case 1a’, three-dimensional simulations were also considered: CTH simulations were run at 649
5 cppr and Spheral simulations were also run at a variety of resolutions in 3D. In both cases, these 650
simulations predicted lower values for β than the equivalent simulations in 2D, though crater sizes 651
are similar. 652
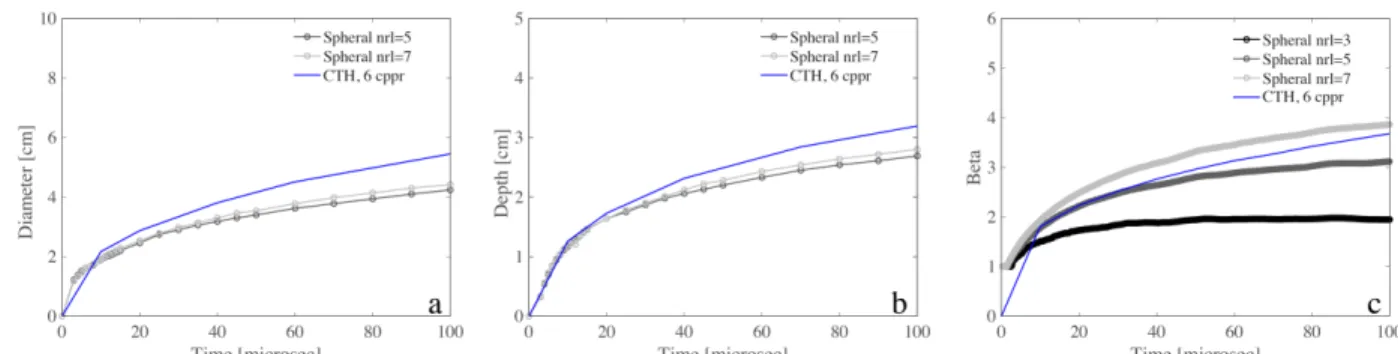
654
Figure 7. Comparisons of converged results between 2D simulations from CTH, iSALE-2D and
655
Spheral for Case 1a’. a) Crater diameter, b) depth, and c) β for impacts into an aluminum block 656
with constant strength. All models are in 2D. 657

![Table 4. Summary of parameters prescribed for basalt and Al-6061 251 Basalt Fully dense 20% porosity 45% porosity 60% porosity Density [kg/m 3 ] 2800 2600 1500 1200](https://thumb-eu.123doks.com/thumbv2/123doknet/13580413.422026/10.918.107.912.109.257/summary-parameters-prescribed-basalt-porosity-porosity-porosity-density.webp)