HAL Id: hal-02975089
https://hal-amu.archives-ouvertes.fr/hal-02975089
Submitted on 22 Oct 2020
HAL is a multi-disciplinary open access
archive for the deposit and dissemination of
sci-entific research documents, whether they are
pub-lished or not. The documents may come from
teaching and research institutions in France or
abroad, or from public or private research centers.
L’archive ouverte pluridisciplinaire HAL, est
destinée au dépôt et à la diffusion de documents
scientifiques de niveau recherche, publiés ou non,
émanant des établissements d’enseignement et de
recherche français ou étrangers, des laboratoires
publics ou privés.
Assessing post-pliocene deformation in a context of slow
tectonic deformation: insights from paleoseismology,
remote sensing and shallow geophysics in Provence,
France
Franck Thomas, Magali Rizza, Olivier Bellier, Jérémy Billant, Philippe
Dussouillez, Jules Fleury, Doriane Delanghe, Vincent Ollivier, Vincent
Godard, Brigitte Talon
To cite this version:
Franck Thomas, Magali Rizza, Olivier Bellier, Jérémy Billant, Philippe Dussouillez, et al.. Assessing
post-pliocene deformation in a context of slow tectonic deformation: insights from paleoseismology,
remote sensing and shallow geophysics in Provence, France. Natural Hazards, Springer Verlag, 2021,
105, pp.1453-1490. �10.1007/s11069-020-04362-5�. �hal-02975089�
https://doi.org/10.1007/s11069-020-04362-5
Assessing post‑pliocene deformation in a context of slow
tectonic deformation: insights from paleoseismology,
remote sensing and shallow geophysics in Provence, France
Franck Thomas, et al. [full author details at the end of the article]Received: 8 May 2020 / Accepted: 28 September 2020
Abstract
The Provence region, located in the south-east of France, has experienced a few destructive earthquakes during the last centuries, such as the 1909 Lambesc earthquake or the 1509 and 1708 Manosque earthquakes. However, faults in the area experience slow slip rates (< 0.1 mm/yr) that preclude quantification of deformation using geodetic measurements. Active faults in Provence have long recurrence intervals, and the region experiences ero-sion under a Mediterranean climate where surface markers of such deformation are rapidly erased. As a consequence, several faults in the region may go unnoticed despite having the potential to generate earthquakes. This work focuses on the Vinon-sur-Verdon area in Provence, where a relatively narrow fault structure, the Maragrate fault, brings into contact Miocene clays and Pliocene conglomerates. Because of its proximity to a major nuclear research facility, this fault poses a potential earthquake hazard that justifies studies aimed at gaining insight into its mechanics and Quaternary seismic activity. In this context, a multi-disciplinary approach has been implemented. A LiDAR campaign was undertaken to generate a 30-cm high-resolution Digital Elevation Model that depicts in detail the cur-rent fault morphology. In parallel, an electrical resistivity campaign was conducted and three trenches were opened. These investigations revealed a fault contact expressed by a fault gouge zone surmounted and sealed by numerous recent Quaternary periglacial and high-energy channel units. Radiocarbon and optically stimulated luminescence dating allowed the chronological reconstruction of sediment deposition and erosion cycles and of the most recent deformation event, older than 20 ka. These investigations did not allow us to demonstrate with certainty that these deformations are of a co-seismic nature. This work highlights the difficulty of identifying faults and studying the seismic hazard in intra-continental contexts.
Keywords Seismic hazard · Slow deformation · Paleoseismology · LiDAR · Electric tomography · Grain size distribution · 14C dating · OSL dating
Electronic supplementary material contains supplementary material, which is available to
1 Introduction
In intra-continental areas, active fault slip rates can be very low (< 0.1 mm/yr), leading to long recurrence intervals (up to several hundreds or thousands of years) for relatively strong earthquakes (Mw > 6). The sub-millimetre faulting rates are usually too low to be quantified by geodetic data. A much longer time span is necessary to observe tectonic deformations (Nocquet 2012; Fuhrman et al. 2014). In such a tectonic setting with slow activity, historic and instrumental seismicity gives a first glance into the recent tectonic activity of a fault system and may provide valuable insight on the location and depth of earthquakes epicentres. Yet, linking the intensities of historical earthquakes to a particular active fault is often challenging and depends on the quality of historical catalogues and the conservation of fault scarps in the landscape. At an intermediate timescale, paleoseis-mology fills the gap between late Holocene surface observations and long-term geological deformations. Paleoseismology studies have been conducted in various areas of slow tec-tonic deformation such as the lower Rhine Embayment in Germany (Vanneste et al. 1999; Vanneste and Verbeek 2001; Meghraoui et al. 2000; Grützner et al. 2016) and the New Madrid seismic zone (e.g. Thompson Jobe et al. 2020).
In the Provence region of southern France, balanced cross sections (Champion et al.
2000; Bestani et al. 2015), offsets of geological markers (Chardon and Bellier, 2003) and geodetic studies (Nocquet, 2012) confirm the slow rates of tectonic deformations (< 0.1 mm/yr) (Cushing et al., 2008; Chardon and Bellier, 2003; Chardon et al., 2005). The region has also not experienced moderate and strong earthquakes (Mw > 5) recorded by seismological networks over the last 60 years. In addition, morphological evidence of activity along active fault segments is subdued because denudation rates are comparable or faster than fault velocities (about 30–60 mm/ka, Siame et al. 2004; Molliex et al. 2011; Godard et al. 2016, 2020; Thomas et al. 2017, 2018). This implies that tectonic geomor-phic markers tend to be rapidly eroded away and that no single stand-alone method can be used to accurately evaluate seismic deformation. For these reasons, the investigation of current and past behaviour of active faults in slow deformation contexts, and more spe-cifically in Provence, necessitates the implementation of a multi-disciplinary methodology addressing various time and spatial scales.
The study area is located in south-eastern Provence, a foreland basin of both the Pyre-nean and Alpine orogens. It is bordered to the south by the MediterraPyre-nean Sea (see Fig. 1). This area is currently undergoing very slow tectonic deformations, the causes of which are still widely debated (e.g. Mazzotti et al. 2020). Various factors have been evoked: conver-gence of the African-European plates, anti-clockwise rotation of the Adriatic block, gravi-tational collapse of the Alps or even a post-glacial visco-elastic re-adjustment (Champion et al. 2000; Baroux et al. 2001; Lacombe and Jollivet 2005; Cushing et al. 2008; Le Pichon et al. 2010; Nocquet 2012; Bellier 2014; Bollinger and Kuperminc 2014; Walpersdorf et al.
2015; Mazzotti et al. 2020). Provence has been the focus of numerous structural, geomor-phological, seismological and paleoseismological studies since the late nineteenth century (e.g. Bertrand 1899; Corroy et al. 1964; Clauzon and Robert 1984; Baroux et al. 2001; Chardon and Bellier 2003; Chardon et al., 2005; Cushing et al. 2008; Molliex et al. 2011; Clauzon et al. 2011; Bestani et al. 2015; Guyonnet-Benaize et al. 2015; Mazzoti et al.
2020). Structural studies have used gravity variation measurements and seismic sections to obtain maps of the main faults and the extent of the region’s sedimentary basins (Ter-rier et al. 2008; Le Pichon et al. 2010; Espurt et al. 2012; Guyonnet-Benaize et al. 2015; Bestani et al. 2016). However, the nature of seismogenic deformations in south-eastern
France remains unclear. For example, the 2019 November 11th Le Teil earthquake (see Fig. 1 for location) raises the question of the seismic loading and seismic source that can trigger such events in very low slip rates/shallow deformation contexts and of faults that have not experienced ruptures during the Late Quaternary (Ampuero et al. 2020; Ritz et al.
2020). This highlights the fact that faults capable of creating surface ruptures can currently remain unnoticed because of very long recurrence intervals. These facts also call into ques-tion aspects of seismogenic behaviour and the concept of a seismic cycle in such contexts.
At the scale of metropolitan France (i.e. not including the French overseas territo-ries, several of which experience significant seismic activity), discriminating whether a fault is considered as active is still not straightforward and may depend on scientific or regulatory issues (Jomard et al. 2017). The database of potentially active faults (BDFA) includes faults showing evidence of Miocene or younger deformation, assuming the tec-tonic stress field has not experienced dramatic changes since the end of the Miocene (Jomard et al. 2017; Mazotti et al. 2020). The BDFA aims at recognizing potential seis-mogenic faults within 50 km of nuclear facilities. Our study site is located in Vinon-sur-Verdon (see Fig. 1), only 4 km away from the major nuclear facilities at Cadarache which host a research centre of the CEA, the French Atomic Agency (Commissariat à l’Énergie Atomique et aux Énergies Alternatives), and the International Thermonu-clear Experimental Reactor (ITER). At the Maragrate site (Fig. 2), a geological contact between Miocene clays and Pliocene conglomerates (Fig. 3) observed on a roadside out-crop raises the question of potential Quaternary deformations associated with tectonic
Fig. 1 Geological map of Provence displaying geology, major faults and mountain ranges ( modified from
Molliex et al. 2011). Historical (SisFrance, e.g. Scotti et al. 2004) and instrumental (SI-Hex catalogue, data from 1963 to 2009, Cara et al. 2015) seismicity is displayed, as well as the location of various paleoseismo-logical studies (Neopal catalogue)
and seismic activity. For these reasons, a key point consists in determining whether this inherited fault zone has possibly registered tectonic deformations during the Plio-Qua-ternary. To achieve this task, we adopted an extended multi-proxy approach that evalu-ates the post-Pliocene activity of this fault in a context of significant natural erosion but also important anthropogenic activity.
Fig. 2 a Digital elevation model (DEM) map displaying the area over which high-resolution LiDAR data
(30 cm per pixel) were generated for this study. b Geological map based on the CEA geological map (Hol-lender et al., 2014). The north–south black line corresponds to the geological section in Fig. 4. The dotted rectangle corresponds to the area displayed in Figs. 3 and 6. The orange star represents the area where two knickpoints are observed on the south Vinon thrust segment
In this work, we first describe the geological history of Provence and present a state of the art of past tectonic studies in the region. At our study site, the main challenge was uncovering potential deformed Quaternary surfaces and fault scarp morphologies, usually found under dense vegetation covers or in urban areas in Provence. To overcome this limi-tation, an airborne LiDAR (Light Detection and Ranging) survey was conducted in order to generate a 30-cm high-resolution Digital Elevation Model (DEM) that enabled a detailed geomorphological mapping of the Maragrate area. Complementary geophysical investiga-tions were carried out to image the extent of the fault contact at depth and to drive the subsequent paleoseismic investigations. Three paleoseismic trenches were opened, and one of them was sampled for sedimentology and age constraints using 14C and luminescence dating, thus providing a deposition chronology. Finally, we discuss these results and obser-vations in the context of the seismic hazard of Provence.
2 Geological setting
2.1 Geology of Provence
The geology of Provence (see Fig. 1) consists of late Cretaceous to Paleogene (i.e. Pyr-enean) north- and south-verging fold-and-thrust belts (Mercier 1979; Tempier 1987; Ter-rier et al. 2008; Espurt et al. 2012; Bestani et al. 2016). In northern Provence, Pyrenean structures were reactivated during the Neogene shortening that led to north- and south-verging thrust faults (Combes 1984; Villeger and Andrieux 1987; Chardon and Bellier
2003). Two NE-trending crustal-scale left-lateral strike-slip fault systems (the Nîmes and Middle Durance fault systems) have significant implications in the differential N-S short-ening during Pyrenean and Neogene shortshort-ening events. These fault systems are inherited from Late Paleozoic strike-slip structures (Arthaud and Matte 1974) and were reactivated
Fig. 3 Maragrate area in Vinon-sur-Verdon. a Geomorphological map of the Maragrate area located near
the centre of Vinon-sur-Verdon. The contour interval is 5 m. Black lines depict the three north–south geo-logical sections (Fig. 5), and the blue dot shows drill hole BSS002HBZG. b Shaded relief LiDAR DEM (30 cm resolution) displaying the Maragrate erosive scarp, indicated by black arrows. c Photograph of the Maragrate contact from the roadside (see B inset for picture location) showing the red Miocene clays in abnormal contact with the Pliocene yellow conglomerates
as strike-slip systems during the late Cretaceous to early Tertiary Pyrenean orogeny (Tem-pier 1987). The Pyrenean orogeny event was also at the origin of east-west ramp anticlines distributed from the Mediterranean coast up north to the Ventoux-Lure mountain (e.g. Clauzon et al. 2011). These were later reactivated as normal faults during the Oligocene regional extension, thus leading to several Oligocene sedimentary basins (Roure et al.
1992; Hyppolite et al. 2012). Subsequently, the Miocene Alpine orogeny (mainly resulting from the collision of the Adriatic block and mainland Europe) led to Provence becoming the foreland basin for both the Pyrenees and the Alps (Champion et al. 2000; Baroux et al.
2001; Chardon and Bellier 2003; Molliex et al. 2011). This orogeny resulted in limited uplift and rejuvenation of pre-existing reliefs (Larroque et al. 2009; Bestani et al. 2016). Provence was further affected during the Messinian by a major Mediterranean sea-level event, the Messinian salinity crisis. This event consisted in a sea-level drop of more than 1500 m (e.g. Clauzon 1982; Gautier et al. 1994; Krijgsman et al. 1999; Mocochain et al.
2009; Tassy et al. 2013) that deeply affected the fluvial network as a result of the variation in base level associated with intense regressive river erosion. The Messinian salinity crisis resulted in the formation of deep canyons that were later filled by marine, then continental sediments once the Mediterranean Sea became connected once again to the Atlantic Ocean approximately 5.32 Ma ago.
The Middle Durance Fault System (MDFS), a major NNE-trending fault system (Fig. 1), divides Provence into two structural domains: the western area consists of a thick Mesozoic to Oligocene sedimentary cover (< 12 km), whereas the eastern area presents a much thinner sedimentary cover (< 2 km) (e.g. Cushing et al. 2008; Le Pichon et al. 2010; Molliex et al. 2011; Bestani et al. 2015). South of the Valensole plateau, the eastern MDFS domain is characterized by a succession of compartmented fold-faults (Fig. 1). Three types of geological structures co-exist in this area: a WNW-trending fold and thrust belt, a NNE-trending strike-slip fault system and N-NNE-trending horst and graben systems (Morabito 1967) (Fig. 1). In addition, the landscape has been affected by several E-trending faults since the late Cretaceous. It is suggested that the MDFS acts as a southward transfer zone of the external Alpine front in Western Provence between the NNW-striking Digne thrust sheet and the south-verging Trevaresse thrust system (Cushing et al. 2008).
During the Plio-Quaternary, tectonic deformations affected Provence but at lower rates (e.g. Cushing et al. 2008, 2014). Various studies provide evidence for late-Quater-nary tectonic activity with relatively high-magnitude earthquakes for metropolitan France (Mw > 5.7) (Baroux et al., 2003; Chardon et al. 2005; Cushing et al. 2008, 2014; Cara et al.
2015; Manchuel et al. 2017). In particular, the Trévaresse fault (TF) is mapped as two main segments and is related to the growth of a fold developed from the Miocene through to the Pleistocene (Chardon and Bellier 2003; Chardon et al. 2005).
2.2 Historical seismicity
The SisFrance catalogue (BRGM, EDF, IRSN, e.g. Scotti et al., 2004) is the main source of information concerning historical seismicity in France (see Fig. 1). Historical seismicity has been documented for the past 500 years in Provence, and it is both weak and sparse. Moderate to strong historical earthquakes are generally spaced in time by more than two centuries. Indeed, historical earthquakes occurred in the Manosque area in 1509 and 1708 (seismic intensities up to VIII, Quenet et al. 2004), and in Volx in 1913 (intensity up to VII-VIII, Cushing et al. 2008) (see location in Fig. 1). These events occurred at rather shallow depths (less than 5 km), are related to the MDFS and attest that this fault system mainly
affects the sedimentary cover, is still currently active and produces earthquakes (Volant et al. 2000; Guignard et al. 2005; Cushing et al. 2008). The Lambesc earthquake on June 11, 1909, the largest in metropolitan France in the twentieth century, struck an area located only 15 km to north-west of the city of Aix-en-Provence (see Fig. 1) with intensities up to IX (VIII-IX after site effects corrections, Baroux et al. 2003). The TF fault is recognized as the seismic source for the 1909 Lambesc earthquake, with an estimated moment magni-tude of about 5.7–6.0 (e.g. Baroux et al. 2003; Chardon and Bellier, 2003; Cara et al. 2015; Manchuel et al. 2017).
2.3 Instrumental seismicity in Provence
Earthquakes with MW > 3 have been rare in Provence since the 1960s. The seismicity of the study area is presented in Fig. 1 (SI-Hex catalogue, Cara et al. 2015). This catalogue documents the seismicity in France from 1963 to 2009. It aims at bringing together seis-mic data from the Bureau Central Sismologique Français (BCSF) and the Laboratoire de Détection et de Géophysique (LDG). Jomard et al. (2017) compiled seismic data on French faults in order to reconstruct a database of potentially active faults in metropolitan France. Manchuel et al. (2017) worked on moment magnitude Mw on both instrumental (SI-Hex catalogue, Cara et al. 2015) and historical seismicity (data extracted from the SisFrance catalogue, www.sisfr ance.net, BRGM, EDF, IRSN, 2017, e.g. Scotti et al. 2004) in conti-nental France to develop a robust and exhaustive seismicity catalogue (FCAT-17).
The most important earthquake referenced in the SI-Hex catalogue in Provence was recorded in February 1984 approximately 15 km south-east of Aix-en-Provence and has been estimated at Mw = 3.6 (Fig. 1). Moreover, a cluster of weak seismicity is observed to the south of Aix-en-Provence, but it is associated with no known fault. Approximately one third of the earthquakes in metropolitan France referenced in the SI-Hex catalogue are related to human activities such as quarry blasts or hydropower dams (Cara et al. 2015), which could explain the presence of this particular cluster. The SI-Hex catalogue also documents seismic activity along the MDFS, with approximately 40 events at MW > 1.8 located in the vicinity of the fault system, the highest being MW = 2.8 in 1963. We can, however, cite two larger seismic events in the MDFS area during the 2010s, both included in the RéNASS (Réseau NAtional de Surveillance Sismique) database: the ML = 2.9 event 3 km from Manosque in 2010 and the ML = 3.3 event 11 km to the north of Manosque in 2012. The immediate surrounding of the TF is characterized by low-magnitude earth-quakes, with only one event at MW > 2.4 recorded in the SI-Hex catalogue, despite the fact that this fault generated the 1909 Lambesc earthquake. Similarly, the Salon-Cavail-lon fault is surrounded by earthquakes with MW < 2.5, while around the Nîmes fault nine earthquakes with MW > 2.5 have been registered during the last 50 years, the largest one at
MW = 3.1 in 1986.
2.4 Previous tectonic and paleoseismic investigations in Provence
Paleoseismologic investigations extend the window of observation of a fault system from the last millennium to the late Quaternary. Various studies using this approach have been conducted in western Europe and France, such as in the Alps (Alasset 2005; Hyppolite et al. 2006; Sanchez et al. 2010), the Jura Mountains (Baize et al. 2002; De La Taille et al.
2015), the Pyrenees (Alasset and Meghraoui, 2005) and the Upper Rhine (Lemeille et al.
paleo-earthquakes during the Late Quaternary and to estimate their maximum magnitude and averaged fault slip rates. With this aim in view, the Neopal online catalogue records neotectonic and paleoseismological indices in France (www.neopa l.net, e.g. Baize et al.
2013), each assigned a quality attribute. In Provence, four paleoseismological events are listed as “certain” in the Neopal catalogue, two of them located on the MDFS and two oth-ers on the TF (see Fig. 1 for location). Trench studies in Provence mainly focus on these two structures because they correspond to the areas with the highest density of historic and instrumental seismicity.
The MDFS has been the centre of various structural and paleoseismological studies (Cushing et al. 2008; Guyonnet-Benaize et al. 2015), most notably at La Brillanne and Valveranne. Concerning La Brillanne, a reverse fault parallel to the MDFS is visible on the western side of the Durance river and is compatible with the deformation pattern deduced from regional observations and focal mechanisms (Terrier 1991; Baize et al. 2002). In Valvéranne, Ghafiri (1995) and Sébrier et al. (1997) described a late Quaternary folded alluvial fan deformed along a N35° axis that they associated with deformation along a sec-ondary fault, parallel to the MDFS. Focal mechanisms were analysed on 27 recent earth-quakes located close to the MDFS between 1999 and 2006 by Cushing et al. (2008). The majority of the 27 mechanisms are consistent with a MDFS left-lateral strike-slip faulting. The focal mechanisms were inverted by the authors using the method proposed by Carey-Gailhardis and Mercier (1987, 1992). It yielded a stress tensor with a strike-slip regime characterized by a N165 ° E-trending σ1 axis.
Several studies have combined microtopography, detailed geomorphological mapping and trenching to investigate the TF responsible for the 1909 Lambesc event (e.g. Chardon and Bellier 2003; Chardon et al. 2005). A first trench opened across the main fault displays a south-verging reverse fault that brings folded Oligocene units in contact with Miocene units (Chardon et al. 2005). A second trench was opened across a 1-m-high scarp, south-ward of the main TF scarp, on an alluvial fan resulting from the erosion of the Trevaresse ridge. In this trench, several fault offsets of more than 10 cm are observed, the most recent surface rupture being associated with the historical 1909 event. However, no available sam-ples were found to date the ages of previous earthquakes. Using the offsets and the fault segment length, Chardon et al. (2005) estimated maximum magnitudes Mw of 6.2–6.4 for earthquakes generated by this fault according to the empiric laws of Wells and Copper-smith (1994).
Other potentially active faults have been studied in the region as well. West of Provence, close to the Nîmes fault, surface rupture evidence of reverse faulting, possibly associated with a strong earthquake (Mw > 6), has been identified (Pascual 1978; Combes et al. 1993; Baize et al. 2002) (location in Fig. 1). The Salon-Cavaillon fault (Fig. 1), located on the western border of Provence, has also been the focus of various studies (Terrier 1991; Vella and Provansal 2000). In particular, Molliex et al. (2011) used balanced cross sections, gravity and seismic reflection data to realize a detailed structural study of this fault sys-tem. Their observations support the fact that this fault is a major structure separating the Alpilles mountain range from the Luberon range.
In conclusion, Provence has a long-standing record of paleoseismic, historical and instrumental earthquakes. However, the MDFS and TF are the only faults in metropolitan France where seismic activity has been documented at these three different timescales.
3 Geometry of the Maragrate fault
Our study site is close to Vinon-sur-Verdon village located 60 km north-east of the city of Marseille (Fig. 1). Vinon-sur-Verdon is 8 km to the east of the MDFS, at the toe of the Vinon thrust, a N90° E-trending south-dipping reverse fault (Morabito 1967; Tempier
1987) sealed by Miocene units (Fig. 2). Fault kinematic measurements were performed on Jurassic limestones from the Vinon thrust (Grellet and Combes 1995; Tassy 2007). The inversion yields three successive tectonic regimes, the relative ages of which were obtained using cross-cutting relationships. The oldest is a compressional tectonic regime character-ized by a N35 °E-trending σ1 axis (normal to the Vinon thrust trend). It is followed by a transtensional tectonic regime characterized by a N110 °E-trending σ3 axis. The young-est is a right-lateral tectonic regime characterized by a N115 °E-trending σ1 axis. These measurements agree with the previously documented geological history of Provence (e.g. Chardon and Bellier 2003): the late-Cretaceous-Tertiary Pyrenean compressional, the Oli-gocene extensional and finally the Miocene Alpine compressional tectonic events.
Our paleoseismic work was carried out 800 m to the south of the Vinon thrust, where an abnormal sub-vertical contact between Miocene sandstones and conglomerates units is evidenced along the D554 roadside (Fig. 3) and hereafter named the Maragrate fault (see Fig. 2). The conglomerates consist of rounded pebbles in a yellow or red-brown matrix and may correspond to the continental Valensole formation. In the region, this stratigraphic formation is interpreted as the Durance-Verdon alluvial fan system prograding south (e.g. Clauzon et al. 1989; Dubar et al. 1998). Chronological data based on mammalian faunas and paleomagnetism date this formation between the Late Miocene (Serravallian to Torto-nian) at its base and up to the early Pleistocene at its top (Clauzon et al. 1989; Dubar et al.
1998). At Maragrate, these conglomerates were more likely deposited during the Pliocene or Early Pleistocene. This geological unit is sheared along the Maragrate fault zone, as attested by oriented and striated pebbles (Tassy 2007 and Fig. 3c). Striae measurements performed on these pebbles are compatible with a dextral Plio-Quaternary movement on the Maragrate fault (Grellet and Combes 1995). These observations suggest that defor-mations may have occurred in this shear zone since the deposition of the conglomerates units, and they raise the question of a potential post-Pliocene tectonic reactivation of this fault segment. Even though instrumental and historical seismicity are documented west of Maragrate along the MDFS (Fig. 1), no seismic event has been recorded in the vicinity of the Maragrate area. Two kilometres to the east of Vinon-sur-Verdon, a 1.5-km-long N180 ° fault segment (called “ramp” in Fig. 2b) connects the north Vinon thrust segment (N090°) to the south Vinon thrust segment (N120 °). The N120 ° Maragrate fault is in geometric continuation with the south Vinon thrust segment (Fig. 2b).
To understand the geometric relationships at depth between the north Vinon thrust seg-ment and the Maragrate fault, a geological cross section has been proposed on the basis of published geological maps from the BRGM (1/50000th geological map of Tavernes, 1966) and the GEOTER/CEA map (2014) (Fig. 4, see Fig. 2 for geological sections location). Our geologic interpretations are speculative because no published seismic cross sections are available in this area. The sedimentary cover is deformed and probably presents thrust-related anticlines and salt tectonic structures (Tempier 1987; Bestani et al. 2015, 2016). From north to south, an east-trending syncline of Jurassic and Cretaceous series is over-thrusted by the north Vinon thrust segment, which exhibits a ~ 20–30 ° south-dipping fault plane. The Vinon thrust décollement level probably occurred at the base of Triassic series (Keuper evaporites). We propose that the thrust may reach the basement approximately
1.5 km below the surface (Fig. 4). The evaporites have probably played a major role in the tectonic deformation and reactivation of fault segments in the area since the beginning of the Jurassic (Bollinger et al. 2010; Bestani et al. 2016); however, this remains speculative because at the surface the Triassic units from the north Vinon thrust segment are described as marly carbonates. The Maragrate fault is located at the border of the Messinian can-yon of the Durance-Verdon hydrographic system. An alternative cross section including Messinian sediments is shown in the supplementary data (Figure S1a).
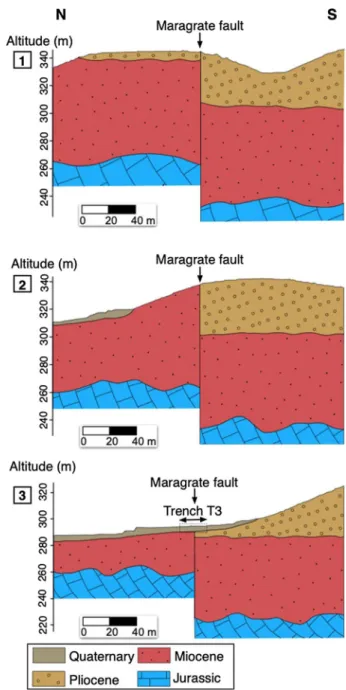
A borehole drilled in Vinon-sur-Verdon (BSS002HBZG, BRGM BSS database, loca-tion in Fig. 3a) indicates that the Miocene units reach at least 260 m a.s.l, which cor-responds to up to 60 m in thickness at the borehole location. Using this observation and the geological map (Fig. 2b), three geological sections at larger scales have been cre-ated (Fig. 5) in order to evaluate the vertical displacement of the Miocene and Pliocene units across the Maragrate fault (location in Fig. 3). Alternative cross sections including Messinian sediments are visible in the supplementary data (Figure S1b). Section 1 dis-plays the Maragrate fault to the south-east of road D554, in an area where Miocene for-mations do not crop out (Fig. 3). Section 2 is located directly to the south-east of Mara-grate and crosses the morphological scarp documented above. The third section cuts across the Maragrate valley. The three geological sections display Jurassic carbonate layers, unconformably overlain by the Miocene clay and sand units as well as the Plio-cene conglomerates. Assuming that the erosional base of the unconformable PlioPlio-cene units is flat (to a first order) and that there is no significant variation in Miocene thick-ness, there is a slight dip towards the north-west because the base of the Pliocene lies at approximately 360 m a.s.l to the south-east and only 270 m a.s.l at the junction with the Verdon alluvial plain to the north-west. Taking this into consideration, we estimate that the base of the Pliocene unit is currently located approximately 30 m deeper to the
Fig. 4 North–south geological cross section of the north Vinon thrust segment and the Maragrate fault. See
south of the Maragrate fault than to the north (Fig. 2). Alternative geological cross sec-tions taking into account assumpsec-tions of sediment infill resulting from the Messinian salinity crisis incision under the Pliocene conglomerates are provided in supplementary data. All our geological interpretations imply a significant apparent vertical component of the Plio-Quaternary movement on this dextral strike-slip fault. The Maragrate fault being subvertical at the surface, it is complicated assessing the vertical component of the faulting.
Fig. 5 North–south geological
cross sections of various scales, centred on the Maragrate fault. See Fig. 3a for location and cor-responding numbering
However, the north Vinon thrust segment does not display any sign of Quaternary tectonic activity, as Miocene and Pliocene units lie unconformably on top of folded Cre-taceous and Jurassic units, sealing the fault plane. From our field observations, we pro-pose that the Maragrate fault is a sub-vertical dip angle fault affecting the sedimentary sequences up to the Pliocene. Concerning its depth anchoring, one possible geometry that can be hypothesized is that this fault is connected to the north Vinon thrust segment approximately 500 m below the surface (Fig. 4). In that case, these faults could, conse-quently, be the expression of strain partitioning between the north Vinon thrust segment to the north and the Maragrate fault to the south.
4 Morphological and geophysical investigations
4.1 High‑resolution LiDAR topographic data
In recent years, high-resolution digital elevation models (DEM) have been extensively used in tectonic and geomorphological studies (Meigs 2013; Gold et al. 2013; Cruz Nunes et al.
2015; Zielke et al. 2015). In this study, we took advantage of the ability of LiDAR technol-ogy to remove, to a certain extent, vegetation and human structures (Fig. 6). This is critical because, in our study area, Mediterranean vegetation and human activities impede satel-lite or field observations (Fig. 6a). In addition, the relative similarity of denudation rates (30–140 mm/ka, e.g. Thomas et al. 2018) and tectonic rates (30–100 mm/ka, e.g. Cushing et al. 2008) in Provence, implies that tectonic fault scarps are rapidly eroded or poorly preserved in the surrounding topography (e.g. McCalpin et al. 2009). A geomorphologic analysis of the Vinon-Verdon area has been performed using an airborne LiDAR sur-vey of a total area of 13.7 km2 and a generated DEM at a resolution of 30 cm/pixel.
4.2 Methodology for electrical geophysical investigations
Geophysical investigations were carried out in the area surrounding the Maragrate morpho-logical scarp (Fig. 7). Following analysis of the LiDAR data, several locations were chosen for an electrical resistivity survey in order to better document the extent of the Maragrate contact.
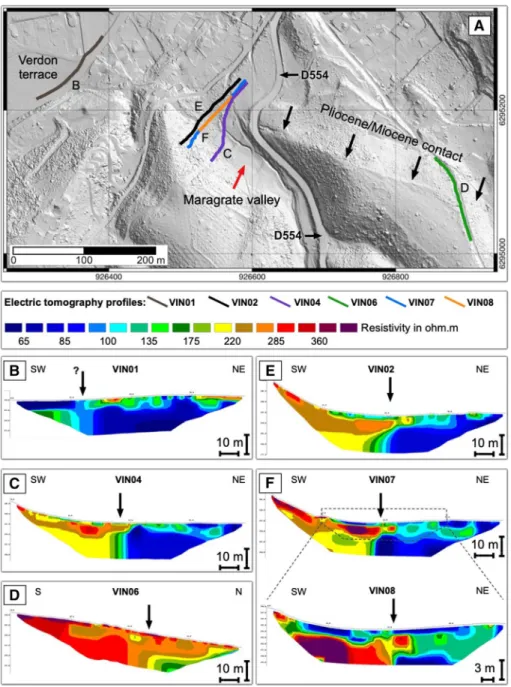
Electrical tomography surveys were carried out for two main purposes: (i) to image the lateral extension to the south-east and north-west of the Maragrate contact observed along the roadside and (ii) to obtain precise mapping of different alluvial/ geological units in the Maragrate valley and enable pinpointing a location for paleo-seismic investigations. 2D-resistivity tomography was used by employing the ABEM Lund Imaging System (SAS4000 + ES1064) with an array of 64 electrodes using a Schlumberger–Wenner reciprocal layout protocol. The electrical profiles were gener-ated using an electrode spacing of 1 or 2 m, resulting in profiles of 63 m and 127 m lengths. The RES2DINV software (Loke 2003) was used to compute a 2D subsurface model representing apparent resistivity before inversion in order to obtain true resistiv-ity. The colour scale for resistivity values has been harmonized between each of the profiles (Fig. 7). In total, six profiles were produced. A first profile (VIN01/profile B) was generated to the north-west of the Maragrate valley, in the most recent abandoned alluvial plain of the Verdon river along road D952. Four additional profiles (VIN02/ profile E, VIN04/ profile C, VIN07/ profile F and VIN08/ profile F) were implemented
within the Maragrate valley. VIN08 was realized with a 1 m electrode spacing instead of 2 m for VIN07, resulting in higher resolution but shallower data. Finally, one last profile (VIN06/ profile D) was obtained to the south-east of the Maragrate morpho-logical scarp, along a path that cuts across the prolongation of the topographic scarp mapped on the LiDAR DEM.
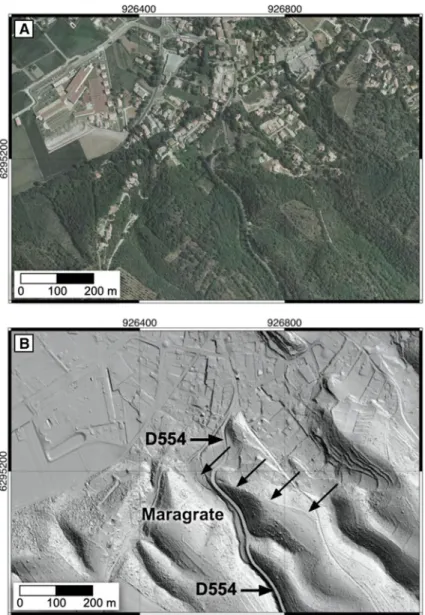
Fig. 6 a Orthophotograph of the Maragrate area in Vinon-sur-Verdon, depicting the dense vegetation and
urbanization. b Shaded relief LiDAR DEM with a 30 cm resolution displaying the N120° orientated Mara-grate fault scarp, as highlighted by black arrows, visible under the vegetation. Same footprint as inset A
Fig. 7 a Electrical tomography profiles in Vinon-sur-Verdon. Black arrows indicate the morphological
scarp of the Maragrate contact. The locations of the six profiles are shown on the LiDAR shaded DEM. Each profile is associated with a letter corresponding to the equivalent inset. VIN01, VIN02, VIN04, VIN06 and VIN07 have an electrode spacing of 2 m and are 127 m in length, whereas VIN08 has an elec-trode spacing of 1 m, resulting in a 63-m-long profile
5 Results
A N120 vertical morphological scarp, 1–2 m high, can be followed for more than 300 m on the LiDAR DEM (not observable on satellite images in Fig. 6a), in the south-eastward continuation of the Miocene/Pliocene contact observed along road D554 (Fig. 6a, b). Its current expression in the morphology probably results from differential erosion between Miocene clays to the north and indurated conglomerates to the south. The north-west continuation of the fault is not seen in the present Verdon alluvial plain and within the Maragrate valley (Fig. 2a). Nevertheless, it is possible that this geologi-cal contact extends towards the south-east, even though it is not visible on the LiDAR DEM because it brings in contact Valensole conglomerates on both sides of the fault, preventing a clear scarp expression in the topography (Figs. 2, 3).~ 1.5 km south-east-ward, in the continuation of the Maragrate morphological scarp, we map two parallel morphological scarps (oriented at N120 °) associated with knick points (geographical coordinates in Lambert 93: 928,403; 6,294,583) in massive Jurassic limestones that could be related to the south Vinon thrust segment (Fig. 2b).
In this urbanized context, alluvial terraces and geological units were also mapped (see Fig. 3). Five levels of alluvial terraces (T0, T1, T2, T3 and T4) were identified, from low to high, respectively, and are mostly located to the north of the Maragrate fault.
Each electrical resistivity profile displays a vertical resistivity contrast (indicated by black arrows in Fig. 7) between lower resistivities (in the 60–130 Ω m range) at depth to the north/north-east and higher resistivities (approximately 200–400 Ω m) to the south/south-west. VIN01 displays lower resistivities on average, which may be linked to the fact that the measurement was carried out in loose and recent alluvial deposits from the Verdon river with possibly higher water and/or clay content. In the Maragrate valley, all profiles display a clear vertical resistivity contrast with conductive and resis-tive units, to the north-east and south-west, respecresis-tively. We interpret this contrast as the rooting at depth of the red clays and conglomerates contact observed along the road; red Miocene clays and conglomerates probably correspond to conductive lay-ers (80 Ω m) and resistive laylay-ers (200–250 Ω m), respectively. On top of this verti-cal contact, we observe between 1 and 5 m of more resistive layers (> 300 Ω m) that we interpret as related to loose sediment deposits. VIN04, located closest to the road, has a thin resistive sediment cover 1–5 m thick, whereas VIN02 and VIN07 display a resistive upper layer of 4–5 m thickness. VIN08 and VIN07 were measured before opening a trench in order to compare resistivity and paleoseismic observations. Both profiles show a 1-m-thick low-resistivity layer directly below the surface and the same resistivity contrast as described in the previous profiles. Besides, a high-resistivity patch (up to 360 Ω m) located just above the main vertical resistivity contrast is vis-ible in VIN08. At approximately the same depth and approximately 10 m to the south-west, we observe a low-resistivity (70 Ω m) channel-like unit. Located eastward of the topographic scarp, VIN06 displays much higher resistivity values compared to the other profiles. However, there is a resistivity contrast at depth similar to that described above. We notice that the different resistivity vertical contrasts observed in all electri-cal profiles are aligned with the topographic scarp visible in the LiDAR DEM and are in continuation of the N120 ° south Vinon thrust segment.
5.1 Paleoseismic investigations in the Maragrate valley
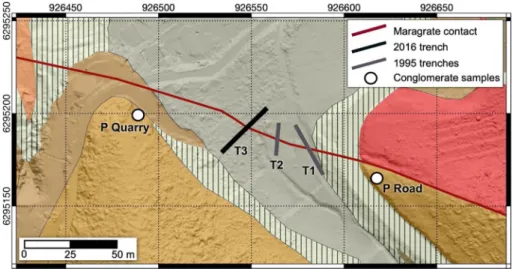
The study site is located in a small town and the potential fault trace at the surface crosses private properties and/or water or underground electricity networks, which limit the pos-sible locations for excavating a trench. To study the nature of past tectonic deformations along the Maragrate fault, two shallow trenches were excavated in the Maragrate valley in 1995 (respectively, called T1 and T2) and a third trench (T3) was opened in 2016 to com-plement the observations (Fig. 8).
5.1.1 Preliminary paleoseismic trenches
Trenches T1 and T2 were excavated on the eastern edge of the Maragrate valley to inves-tigate the lateral extension of the Miocene–Pliocene Maragrate shear zone observed along the roadside. These trenches have a N150 ° and N010 ° orientation, respectively (see Fig. 8
for location). In both trenches, sharp contacts between red clays and conglomerates are observed (Fig. 9), similar to the stratigraphic contact along the road side.
In trench T1, the stratigraphy exposes a well-expressed 50-cm-wide sub-vertical gouge shear zone (SZ), bringing into contact red clays to the north and yellow-beige conglomer-ates to the south (Fig. 9). Miocene red clays (M) dip 70 ° southward and are affected by numerous faults and fractures across a 4-m-wide zone. A sequence of yellow conglomerate beds (P), similar to those observed along the roadside, is observed on the northern wall of T1, dipping 70 ° southward. Sub-vertical layers of orientated pebbles are visible within the conglomeratic unit (darker yellow stripes in Fig. 9), likely related to shear zones in loose sediments. These units are unconformably overlain by a thin organic-rich layer (~ 30 cm thick) made of a brown soil rich in clay and sand.
Trench T2 is located approximately 10 m to the west of T1 and closer to the axis of the present-day Maragrate valley. As observed in T1, red clay layers (M) dip 70 ° to the south and are affected by secondary fractures over a 1-m-wide zone. Fault kinematics analysis performed in T2 revealed right-lateral kinematics along various faults planes (Grellet and
Fig. 8 Map of the Maragrate area showing the extents of trenches T1, T2 and T3. See Fig. 3 for locations
Combes 1995). A 70-cm-wide gouge shear zone (SZ) is visible between the red clays (M) and yellow conglomerate units (P). However, the conglomerates are affected by cracks, do not display subvertical oriented pebbles layers and only broken pebbles are observed. T2 exposes an 80-cm-thick sediment cover made of channel deposits sealing the fault zone. In this sequence, several channel layers made up of rounded pebbles of various sizes were logged. These channels are overlain by up to 70 cm of brown soil rich in clay and sand. The fact that these channel units are not observed within trench T1 may be due to the fact that T2 is located closer to the valley axis and therefore exhibits a thicker recent sediment infill. However, in both trenches, no charcoal samples were found for 14C dating, thus precluding
Fig. 9 T1 and T2 paleo-seismological trenches. a Geological logs of T1 and T2. Dashed boxes correspond
to the pictures on inset B. b Interpreted pictures of trenches T1 and T2 displaying various morphological features such as fractures
the establishment of a chronology for the deposits. Moreover, a lack of recent overlying sediments raises the question of fault reactivation during Late Quaternary, motivating the excavation of a third trench.
5.1.2 Additional paleoseismic trench
Because the VIN07 and VIN08 geophysical surveys (see Sect. 4.3) suggest that a thicker alluvial cover may be found in the axis of the Maragrate valley, we opened a third trench (T3) with a N50 ° orientation (Fig. 8). Detailed logging of stratigraphic units in T3 shows the continuation of the Maragrate fault through the Maragrate valley (Fig. 10). A descrip-tion of each unit is given in Table 1.
We logged three separate units (M, SZ and P) that were visible for up to 150 cm in height at the bottom of both T3 walls and were similar to the units found in T1 and T2. To
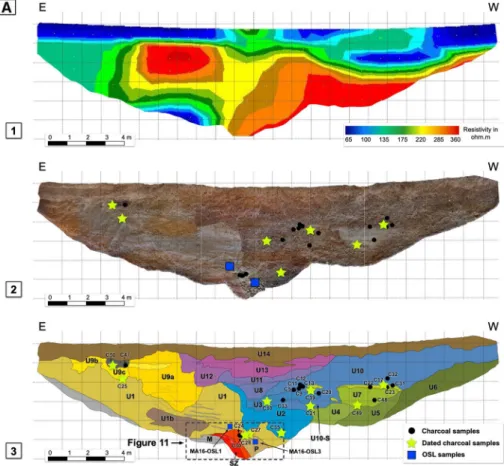
Fig. 10 Trench T3 was opened along a N °50 direction. Both walls of the trench are displayed and are
ref-erenced as the south and north walls, respectively. Stratigraphic units are described in Table 1. A—South wall of the trench. 1: Electrical profile VIN08 (see Fig. 7). 2: Orthophoto-mosaic compiled with Agisoft Photoscan software (https ://www.agiso ft.com) using pictures taken from the trench’s south wall. Locations of 14C and OSL samples are depicted. 3: Geological log of the trench with 14C and OSL sample locations. B—North wall of the trench. 1: Electrical profile VIN08 (see Fig. 7). 2: Orthophoto-mosaic compiled with Agisoft Photoscan using pictures from the trench’s north wall. Locations of 14C and OSL are depicted. 3: Geological log of the trench with 14C and OSL sample locations
the north-east, unit M consists mostly of unconsolidated red/orange sediments rich in clay and silts. To the south-west, unit P is made of yellow/beige conglomerates with rounded pebbles and gravels and numerous oriented or broken pebbles were also observed (Fig. 11). In between, we identified a purplish fault gouge unit (SZ, 80–100 cm lateral thickness), rich in clay and silt. It displayed typical signs of fluid circulation, as well as sheared, angu-lar and broken pebbles (Fig. 11). In the fault gouge, typical indicators (C-S shear criteria) with elongated sigmoid-shaped paleo-soils lenses were observed. The contact between the gouge and the conglomeratic unit P is sharp with a 70 ° south-west dip (see Fig. 11). Con-sistent with the observations on the VIN07 and VIN08 geophysical surveys (Fig. 7), a thick sediment cover sealed the shear zone associated with the fault contact (Fig. 10a, b). On both walls, we logged an erosive base (EB1 in Figs. 11, 12) between the top of the 150-cm-thick shear zone and the base of a fine-grained silt unit with thin inter-beds of angular to sub-rounded red/brown gravels. We propose that the U1 unit consists of fluvio-glacial deposits. On the southern wall, U1 displayed a thickness of up to 3 m, and we observed beds of gravels dipping slightly towards the south and no evidence of recent deformation. This unit is overlain by a channel (U9), up to 3 m thick in its middle portion, with a clear erosional contact at its base (EB2 in Fig. 12). Unit U9 is composed of rounded yellow peb-bles and gravels embedded in a fine-grained silt matrix. This channel displays imbricated
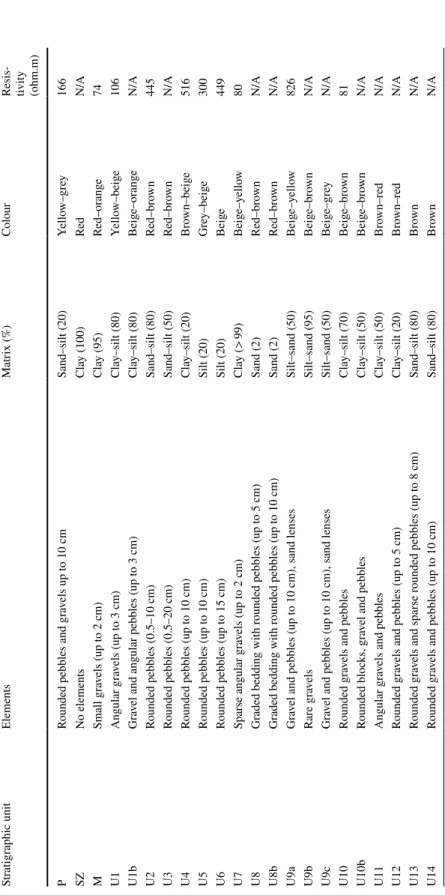
Table 1 Sediment ological descr ip tion of eac h named unit in tr enc h T3. R esults of dir ect r esis tivity measur ements per for med in t he tr enc h ar e displa yed Str atig raphic unit Elements Matr ix (%) Colour
Resis- tivity (ohm.m)
P
Rounded pebbles and g
ra vels up t o 10 cm Sand–silt (20) Yello w–g re y 166 SZ No elements Cla y (100) Re d N/A M Small g ra vels (up t o 2 cm) Cla y (95) Red–or ang e 74 U1 Angular g ra vels (up t o 3 cm) Cla y–silt (80) Yello w–beig e 106 U1b Gr av
el and angular pebbles (up t
o 3 cm) Cla y–silt (80) Beig e–or ang e N/A U2 Rounded pebbles (0.5–10 cm) Sand–silt (80) Red–br own 445 U3 Rounded pebbles (0.5–20 cm) Sand–silt (50) Red–br own N/A U4
Rounded pebbles (up t
o 10 cm) Cla y–silt (20) Br own–beig e 516 U5
Rounded pebbles (up t
o 10 cm) Silt (20) Gr ey–beig e 300 U6
Rounded pebbles (up t
o 15 cm) Silt (20) Beig e 449 U7 Sparse angular g ra vels (up t o 2 cm) Cla y (> 99) Beig e–y ello w 80 U8 Gr
aded bedding wit
h r
ounded pebbles (up t
o 5 cm) Sand (2) Red–br own N/A U8b Gr
aded bedding wit
h r
ounded pebbles (up t
o 10 cm) Sand (2) Red–br own N/A U9a Gr av
el and pebbles (up t
o 10 cm), sand lenses Silt–sand (50) Beig e–y ello w 826 U9b Rar e g ra vels Silt–sand (95) Beig e–br own N/A U9c Gr av
el and pebbles (up t
o 10 cm), sand lenses Silt–sand (50) Beig e–g re y N/A U10 Rounded g ra
vels and pebbles
Cla y–silt (70) Beig e–br own 81 U10b Rounded bloc ks, g ra
vel and pebbles
Cla y–silt (50) Beig e–br own N/A U11 Angular g ra
vels and pebbles
Cla y–silt (50) Br own–r ed N/A U12 Rounded g ra
vels and pebbles (up t
o 5 cm) Cla y–silt (20) Br own–r ed N/A U13 Rounded g ra
vels and sparse r
ounded pebbles (up t
o 8 cm) Sand–silt (80) Br own N/A U14 Rounded g ra
vels and pebbles (up t
o 10 cm)
Sand–silt (80)
Br
own
pebbles with a southward dip in its lowermost part. Towards its upper section, U9 is inter-bedded with a horizontal layer (U9-b, 30 cm thick) consisting of a fine-grained silt lens. We also observed a wooden fire pit approximately 1 m below the ground surface. To the south-west, on both trench walls, several poorly consolidated channel units (U4, U5 and U6) with rounded to angular pebbles and gravels in a sandy and silty matrix were identified as well as another erosive surface (EB3 in Fig. 12). These channel deposits are re-incised by a channel base (EB4 in Fig. 12), later filled by a fine-grained unit (U7) more than 120 cm thick. Another erosional surface (EB5, Fig. 12) was identified above U9 and U1 in the north-east part of the trench. Above the EB4 and EB5 erosive bases, we find several units (U2, U3, U8, U8b, U10, U10b, U11, U12 and U13) consisting of various interbedded loose channel deposits reaching up to 4 m in thickness. They contain brown/beige rounded gravels and pebbles mixed in a silty and sandy matrix, with rare larger boulders (> 75 mm).
Fig. 11 a Zoom on trench T3 south wall shear zone. [1] Photograph of sheared pebbles located in the shear
zone of the trench. [2] Photograph of sigmoid lenses of paleo-soil located in the shear zone of T3. b Inter-pretation and paleoseismic logging
A last erosive base (EB6, Fig. 12) was logged on top of them, marking the transition with the most recent soil layers.
Similarly, the northern wall displays a shear zone, an erosive contact (EB1) and the same stratigraphic sequence of deposition as observed on the southern wall: the U1/U9 fluvio-glacial deposits and channels with EB2 sealing the shear zone with no indication of tectonic deformation, the U4/U5/U6/U7 channels and EB3 to the south-west lying below the EB4 erosional surface and finally the more recent channels (U2, U3, U8, U8b, U10, U10b, U11, U12 and U13) lying above the EB5 surface and below the most recent ero-sional surface EB6.
Additionally, direct resistivity measurements and grain size analysis have been per-formed in the trench (see Table 2). The results, presented in the supplementary data, are coherent with the description above.
5.1.3 Stratigraphic age controls (14C and optically stimulated luminescence)
In order to constrain the chronology of unit deposition in trench T3, three OSL samples were collected in units P and U1 located at the bottom of T3. The preparation and meas-urement protocols of the USGS Denver laboratory were implemented for these samples (Sanderson and Murphy 2010; Rhodes 2011) (see Table 3 and Figure S3 in the supple-mentary data). In addition, 50 charcoal samples were collected, mostly in channel units. Twenty of these samples were selected for 14C AMS measurements performed by the Poznan Radiocarbon laboratory in Poland (see Table 4). All radiocarbon age intervals
Fig. 12 a South wall of the Vinon-sur-Verdon trench, with 14C and OSL sample ages in cal. BP and ka,
respectively. Refer to Fig. 10 for units name. (b) North wall of the Vinon-sur-Verdon trench, with 14C and OSL sample ages in cal. BP and ka, respectively. Refer to Fig. 10 for unit names
have been calibrated using the OxCal software, and the cal. BP ages were calculated using IntCal 2013 calibration curves (Reimer et al. 2013) at 95.4% probability.
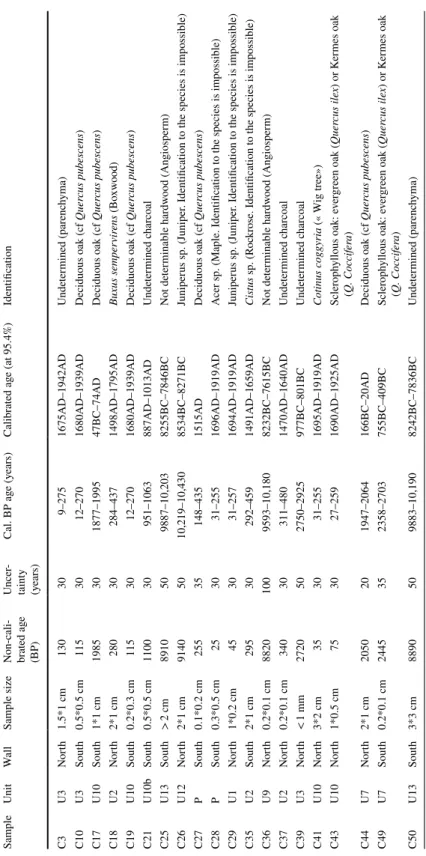
Various OSL and 14C ages bring out six main chronological groups of stratigraphic units for T3, highlighted in the log interpretation by their colour schemes (Fig. 12). One OSL sample (MA16-OSL3) collected within the conglomeratic unit P gives an estimated age of 195.9 ± 30.8 ka, providing a minimum age for the deposition of this unit (see supple-mentary data for more details). Until now, this unit was described as related to Pliocene deposits. However, this new age raises the question of potential Late Quaternary reworking of Pliocene pebbles filling the Maragrate valley channels. Nonetheless, this age is derived from a single sample, and without further geochronological constraints on the surround-ing conglomeratic outcrops we cannot remove this uncertainty. OSL samples MA16-OSL1 and MA16-OSL2, both collected in the fine-grained fluvio-glacial U1 unit, yield Central Age Model (CAM) ages of 19.4 ± 1.0 ka and 17.9 ± 0.7 ka, respectively. Unit U1 could be correlated with one of the glacial periods identified in the region (MIS 1, estimated at 17,000–16,000 cal. BP using absolute dating by Ollivier 2006). These two OSL ages indicate a chronological gap between the deposition of the conglomeratic (P) and U1 units, consistent with the presence of the EB1 erosive surface in our paleoseismic log. Charcoal sample C29, collected in unit U1, yields a calibrated age of 31–257 cal. BP. Similarly, two samples (C27 and C28), collected in unit P, yield ages between 31 and 455 cal. BP. These three samples are not in the correct stratigraphic order when compared to the OSL ages and the ages of detrital charcoals located in upper stratigraphic positions (Fig. 12). We therefore suspect that these samples may be related to roots and we consider them as outliers. Four charcoal samples (C25 and C50 on the southern wall, C26 and C36 on the northern wall), collected in the U9 channel, yield ages between 9593 and 10,430 cal. BP, indicating that the channel was filled at the end of the last glacial period (Lisiecki and Raymo 2005). Four
Table 2 Weight percentages of
the clay, silt and sand fractions for the 19 grain size samples tested in this study (locations in figure A). In order to obtain comparable percentages, the total weight of each sample has been brought to 100 g
Sample Clay Silt Sand
G-P 10.99 30.64 58.37 P Quarry 5.35 32.86 61.79 P Road 10.11 37.12 52.78 G-SZ 24.66 38.74 36.60 G-M 23.41 36.46 40.13 G-U1-a 15.97 46.65 37.38 G-U1-b 14.05 47.84 38.11 G-U1-c 8.44 50.98 40.58 G-U1-d 14.39 27.33 58.28 G-U1b 6.45 41.31 52.24 G-U2 9.57 29.80 60.64 G-U3 16.05 44.98 38.97 G-U4 8.74 35.18 56.08 G-U5 16.39 45.00 38.61 G-U6 4.66 34.49 60.86 G-U7 22.49 57.84 19.67 G-U9 9.29 67.50 23.21 G-U10-a 10.36 31.77 57.87 G-U10-b 14.35 59.61 26.04
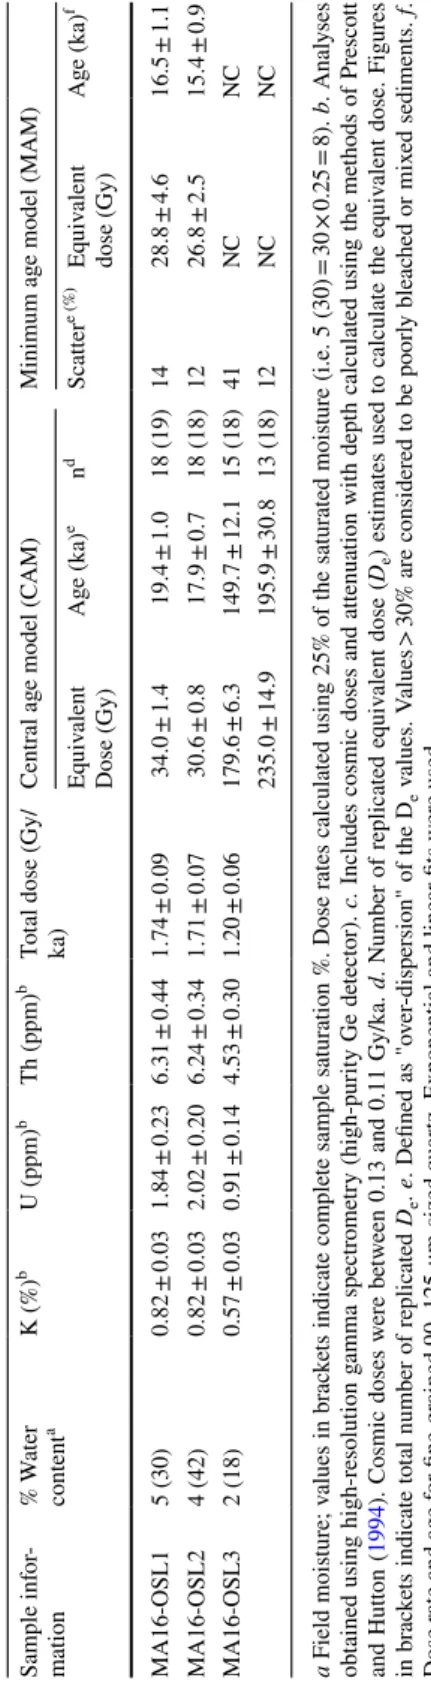
Table 3 Quar tz OSL dat a and ag es measur ed fr om tr enc h T3. N C means t hat Minimum A ge Model ag es w er e no t calculated f or OSL3 a F ield mois tur e; v alues in br ac ke ts indicate com ple te sam ple satur ation %. Dose r
ates calculated using 25% of t
he satur ated mois tur e (i.e. 5 (30) = 30 × 0.25 = 8). b. Anal yses obt
ained using high-r
esolution g amma spectr ome try (high-pur ity Ge de tect or).
c. Includes cosmic doses and attenuation wit
h dep th calculated using t he me thods of Pr esco tt and Hutt on ( 1994 ). Cosmic doses w er e be tw een 0.13 and 0.11 Gy/k a. d. N umber of r eplicated eq uiv alent dose ( De ) es timates used t o calculate t he eq uiv alent dose. F igur es in br ac ke ts indicate t ot al number of r eplicated De . e . Defined as "o ver -dispersion" of t he De v alues. V alues > 30% ar e consider ed t o be poor ly bleac hed or mix ed sediments. f. Dose r ate and ag e f or fine-g rained 90–125-μm-sized q uar
tz. Exponential and linear fits w
er e used Sam ple inf or -mation % W ater content a K (%) b U (ppm) b Th (ppm) b To
tal dose (Gy/
ka) Centr al ag e model (C AM) Minimum ag e model (MAM) Eq uiv alent Dose (Gy) Ag e (k a) e n d Scatter e (%) Eq uiv alent dose (Gy) Ag e (k a) f MA16-OSL1 5 (30) 0.82 ± 0.03 1.84 ± 0.23 6.31 ± 0.44 1.74 ± 0.09 34.0 ± 1.4 19.4 ± 1.0 18 (19) 14 28.8 ± 4.6 16.5 ± 1.1 MA16-OSL2 4 (42) 0.82 ± 0.03 2.02 ± 0.20 6.24 ± 0.34 1.71 ± 0.07 30.6 ± 0.8 17.9 ± 0.7 18 (18) 12 26.8 ± 2.5 15.4 ± 0.9 MA16-OSL3 2 (18) 0.57 ± 0.03 0.91 ± 0.14 4.53 ± 0.30 1.20 ± 0.06 179.6 ± 6.3 149.7 ± 12.1 15 (18) 41 NC NC 235.0 ± 14.9 195.9 ± 30.8 13 (18) 12 NC NC
Table 4 14C sam ples collected in t he V inon-sur -V er don tr enc h Char coal or igin species ha ve been de ter
mined using a micr
oscope Sam ple Unit W all Sam ple size Non-cali- brated ag e (BP) Uncer -tainty (years) Cal. BP ag e (y ears) Calibr ated ag e (at 95.4%) Identification C3 U3 No rth 1.5*1 cm 130 30 9–275 1675AD–1942AD Unde ter mined (par enc hyma) C10 U3 Sout h 0.5*0.5 cm 115 30 12–270 1680AD–1939AD Deciduous oak (cf Quer cus pubescens ) C17 U10 Sout h 1*1 cm 1985 30 1877–1995 47BC–74AD Deciduous oak (cf Quer cus pubescens ) C18 U2 No rth 2*1 cm 280 30 284–437 1498AD–1795AD Buxus sem per vir ens (Bo xw ood) C19 U10 Sout h 0.2*0.3 cm 115 30 12–270 1680AD–1939AD Deciduous oak (cf Quer cus pubescens ) C21 U10b Sout h 0.5*0.5 cm 1100 30 951–1063 887AD–1013AD Unde ter mined c har coal C25 U13 Sout h > 2 cm 8910 50 9887–10,203 8255BC–7846BC No t de ter minable har dw ood (Angiosper m) C26 U12 No rth 2*1 cm 9140 50 10,219–10,430 8534BC–8271BC Juniper us sp. (Juniper . Identification t o t he species is im possible) C27 P Sout h 0.1*0.2 cm 255 35 148–435 1515AD Deciduous oak (cf Quer cus pubescens ) C28 P Sout h 0.3*0.5 cm 25 30 31–255 1696AD–1919AD A
cer sp. (Maple. Identification t
o t he species is im possible) C29 U1 No rth 1*0.2 cm 45 30 31–257 1694AD–1919AD Juniper us sp. (Juniper . Identification t o t he species is im possible) C35 U2 Sout h 2*1 cm 295 30 292–459 1491AD–1659AD Cis tus sp. (R oc kr ose. Identification t o t he species is im possible) C36 U9 No rth 0.2*0.1 cm 8820 100 9593–10,180 8232BC–7615BC No t de ter minable har dw ood (Angiosper m) C37 U2 No rth 0.2*0.1 cm 340 30 311–480 1470AD–1640AD Unde ter mined c har coal C39 U3 No rth < 1 mm 2720 50 2750–2925 977BC–801BC Unde ter mined c har coal C41 U10 No rth 3*2 cm 35 30 31–255 1695AD–1919AD Co tinus coggyr ia (« W ig tr ee») C43 U10 No rth 1*0.5 cm 75 30 27–259 1690AD–1925AD Scler oph yllous oak: e ver gr een oak ( Quer cus ile x) or K er mes oak (Q. Coccif er a) C44 U7 No rth 2*1 cm 2050 20 1947–2064 166BC–20AD Deciduous oak (cf Quer cus pubescens ) C49 U7 Sout h 0.2*0.1 cm 2445 35 2358–2703 755BC–409BC Scler oph yllous oak: e ver gr een oak ( Quer cus ile x) or K er mes oak (Q. Coccif er a) C50 U13 Sout h 3*3 cm 8890 50 9883–10,190 8242BC–7836BC Unde ter mined (par enc hyma)
detrital charcoals (C17, C39, C44, C49) collected within the channel units U7 and U4 yield ages between 1877 and 2925 cal. BP. Another set of 8 charcoals, collected in the channels units U2, U3, U10, U10b and U14, suggest that a recent (< 500 years) sediment infill rich in sand, gravel and boulders took place in the Maragrate watershed above erosive bases EB4 and EB5. Only one sample collected in unit U10 (C21) gives an age between 951 and 1063 cal. BP, which does not correspond to the expected stratigraphic order. Indeed, this detrital charcoal is located stratigraphically higher than the C35 sample (292–459 cal. BP) and stratigraphically lower than C19 (12–270 cal. BP) (Fig. 12). Considering the radiocar-bon sample set is closely consistent with our interpretation, we suggest that sample C21 may contain some 14C inheritance and/or has been reworked before deposition. Finally, one sample (C41) at an age of 31–255 cal. BP confirms that the uppermost soil layer consists of recent deposits, again in agreement with our preliminary paleoseismic interpretations.
6 Discussion
6.1 Geometry and chronology of sediment deposition: implications for deformation in the Maragrate area
Trenches T1, T2 and T3 display the same sequence of deposits: at the bottom we observe red clays (M) in contact with yellow conglomerates (P) via a shear zone (SZ). The shear zone is observed in all trenches, suggesting a continuity of the fault plane for at least a hun-dred metres. The fault planes (dipping 70 °S) exhibit characteristics of deformation such as red clay material typical of fault gouges, C-S shear sigmoids. Moreover, we notice numer-ous oriented or sheared pebbles along the fault plane, resulting from stress and deformation following deposition. Also, fault kinematics measurements in trenches T1 and T2 and C-S criteria in T3 suggest that this fault contact is characterized by strike-slip kinematics with a slight reverse component, which remains compatible with the geometry of the fault system. The top of unit SZ from trench T3 (Fig. 11) presents a dome shape. It is, however, difficult to evaluate if this preserved topography is the remnant of a topographic scarp later erased by the EB1 erosive base (Fig. 12). For this reason, we are unable to identify any co-seismic activity associated with the Quaternary deformation observed in the Maragrate fault in the paleoseismic trenches.
The sediment thickness on top of the shear zone drops from 5 m in T3 to 1 m and 20 cm in T2 and T1, respectively, which confirms our geophysical interpretations. Moreover, the most recent trench T3 yields unique geochronological data that were not available for T1 and T2. Fifty charcoal samples were collected in T3 and twenty were dated, along with three OSL samples. This dataset allows a better constraint on the chronology of sediment deposition and tectonic activity in Maragrate valley (Fig. 12). The yellow conglomerates visible in all the three trenches were described until now as Pliocene conglomerates (between 2 and 5 Ma). Our dating for MA16-OSL 3 provides a minimum age of 195.9 ± 30.8 ka for these conglomerates, implying that this unit had been deposited at least by the end of Marine Isotopic Stage 6 (MIS 6) and could correspond, in trench T3, to a channel deposit containing reworked Pliocene pebbles. However, we are aware that this age is only based on a single sample with 18 meas-ured aliquots (see supplementary data) and that this sample may be saturated or may have suffered from partial bleaching since its deposition. In addition, the sedimento-logical analysis from which the MA16-OSL3 sample was extracted shows very strong
similarities to samples taken from undisturbed Pliocene outcrops, whereas one would expect a sedimentological change in the case of reworking (see supplementary Figure S2). Without further analysis, we cannot resolve this chronological discrepancy and we therefore exclude this sample in predating the age of the fault activity in the trench.
Unit U1 lying directly above the shear zone was dated at 19.4 ± 1.0 ka and 17.9 ± 0.7 ka (MA16-OSL1 and MA16-OSL2, respectively). This chronological con-trol shows that U1 was deposited before the Holocene and confirms that we may have a long stratigraphic gap between the fault activity and the first deposits on top of the EB1 erosive level. U1 is not affected by tectonic features (fault, cracks, oriented peb-bles), implying that this unit seals the past activity of the shear zone. We propose that the Maragrate fault has been reactivated at least once after the deposition of the con-glomeratic unit P, thus post-dating the tectonic activity of the Maragrate contact at a minimum of 18 ka, which implies a long recurrence for this fault segment.
6.2 Geomorphological and tectonic relationship between the Maragrate fault and the Vinon thrust
The lateral extension of the Maragrate fault remains uncertain. Using LiDAR, trenches and geophysical techniques, it is possible to map with certainty the N120 ° Maragrate fault over a length of approximately 700 m. While this length corresponds to the small-est possible extension of this fault, several hypotheses have to be postulated in order to estimate a larger extension. In its south-eastward continuation, this fault may be con-nected to the south Vinon thrust segment, thus extending the fault to 2.2 km in length (dotted line in Fig. 2). As suggested by our geophysical survey (profile B in Fig. 7), the fault could also continue to the north-west in the current Verdon alluvial plain, extending the segment for an additional kilometre, although more geophysical data are needed to corroborate this hypothesis.
In our geological cross section (Fig. 4), we connect the Maragrate fault segment to the northern Vinon thrust segment at~ 500 m depth below the surface. While the Maragrate fault displays potential Quaternary (post-Pliocene) deformation as observed along a fault contact on a roadside and in paleoseismic trenches, the northern Vinon thrust segment provides no evidence for tectonic reactivation since the end of the Mio-cene. However, we noticed that the Maragrate fault is in geometric continuation with the south Vinon thrust segment (Fig. 2b). We therefore propose that the Maragrate fault could be related to a local fault partitioning, inhibiting the north Vinon thrust segment since the Miocene. Such a configuration is compatible with fault kinematic analyses and consistent with a strike-slip regime.
The Maragrate segment remains a short and shallow fault and, if reactivated, has only produced earthquakes of moderate magnitude (i.e. Mw ∼ 4) for a potential maxi-mum length of 2 km and a depth between 0.5 and 1.2 km (Fig. 4, if the fault is not con-nected to the north Vinon thrust segment) according to the empirical laws of Wells and Coppersmith (1994). In case of connection to the south Vinon thrust segment as well, the total surface fault trace could reach up to 5 km and the subsurface rupture length up to 2 km, resulting in maximum magnitudes of Mw ∼ 5 according to the empirical laws of Wells and Coppersmith (1994).
6.3 Local and regional long‑term slip rate estimations
From interpretative geological cross sections (Fig. 5) and using the base of the Valensole formation as a stratigraphic marker, we estimate that the cumulative apparent vertical offset may reach up to 30 m along the Maragrate contact. This observation implies that the total geological offset has accumulated through a series of earthquakes since the deposition of the Valensole units. Because quantified tectonic offsets are missing in the most recent Qua-ternary formations, we extrapolate a long-term slip rate using the Valensole stratigraphic marker and assuming that the regional stress field has not experienced dramatic changes since the Miocene (Jomard et al. 2017). Given the loose chronological age for the Valen-sole formation dated between 2.6 and 1 Ma (Clauzon et al. 1989; Dubar et al. 1998), we deduce a slip rate ranging from 0.01 to 0.03 mm/yr. Yet, several limitations have to be con-sidered regarding this slip rate estimation. First, we are unable to estimate horizontal cumu-lative displacements due to the lack of preserved offset markers. Besides, it is currently not possible to estimate when and over how long this cumulative slip has been recorded.
Nevertheless, this vertical rate is coherent with published slip rates in western Provence. For example, Godard et al. (2020) identified similar rock uplift rates in the Digne-Valensole basin only 35 km to the north of Maragrate. There, the authors deduced a ∼ 0.021 mm/yr differential uplift velocity along a 10 km-transect, which is interpreted as related to active thrusting. Other slip rates ranging around 0.02 mm/yr (Siame et al. 2004) to 0.05–0.3 mm/ yr (Chardon et al. 2005) have been proposed for the Middle Durance Fault system and the Trévaresse Fault, respectively.
6.4 Shear zone thickness and past tectonic activity
As previously proposed in our geological cross sections, the Maragrate fault is poten-tially short (less than 700 m) and shallow (500 m). We also were unable to measure co-seismic slips in post-Pliocene units because the fault zone is sealed by erosive bases in each trench. However, the 80 to 100 cm lateral thickness of the shear zone (SZ) raises the question of the recurrence and intensity of past deformation on this fault, and its compat-ibility with already documented empirical estimations for potential seismic events. Several studies compared fault displacements and fault thicknesses to total fault lengths (e.g. Rob-ertson 1983; Shipton et al. 2006). Hull (1988) presented empirical relationships between thickness of the fault gouge and displacement for various types of deformation zones in quartzofeldspathic rocks. The author found a linear correlation between these two param-eters. These relationships illustrate the role of strain during displacement as well as the growth of fault zones with time. Kim et al. (2004) developed the concept of fault dam-age zones, thus not restraining the study of the impact of faults to their surface trace. This concept relates localized zones of deformation to the structures forming them (Choi et al.
2015; Peacock et al. 2017). The damage zones usually form to accommodate strain or dis-placement variations along, around and between faults. Childs et al. (2009) compiled fault zone thicknesses against the displacement generated by seismic events produced on these faults. The relationship depends on the types of rocks involved, but the authors demonstrate an overall clear increase in displacement with fault zone thicknesses. In the case of the Maragrate fault, the shear zone SZ (Fig. 12) consists of 80–100-cm-thick unconsolidated rocks and, according to the empirical study of Childs et al. (2009), this fault could generate coseismic slips ranging between 1 and 10 cm approximately.
![Fig. 11 a Zoom on trench T3 south wall shear zone. [1] Photograph of sheared pebbles located in the shear zone of the trench](https://thumb-eu.123doks.com/thumbv2/123doknet/13694291.432732/22.659.118.542.86.640/zoom-trench-south-photograph-sheared-pebbles-located-trench.webp)