HAL Id: hal-02651150
https://hal.inrae.fr/hal-02651150
Submitted on 29 May 2020
HAL is a multi-disciplinary open access
archive for the deposit and dissemination of
sci-entific research documents, whether they are
pub-lished or not. The documents may come from
teaching and research institutions in France or
abroad, or from public or private research centers.
L’archive ouverte pluridisciplinaire HAL, est
destinée au dépôt et à la diffusion de documents
scientifiques de niveau recherche, publiés ou non,
émanant des établissements d’enseignement et de
recherche français ou étrangers, des laboratoires
publics ou privés.
Alexandre Fournier-Level, Philippe Hugueney, Clotilde Verries, Patrice This,
Agnes Ageorges
To cite this version:
Alexandre Fournier-Level, Philippe Hugueney, Clotilde Verries, Patrice This, Agnes Ageorges. Genetic
mechanisms underlying the methylation level of anthocyanins in grape (Vitis vinifera L.). BMC Plant
Biology, BioMed Central, 2011, 11, pp.1-14. �10.1186/1471-2229-11-179�. �hal-02651150�
R E S E A R C H A R T I C L E
Open Access
Genetic mechanisms underlying the methylation
level of anthocyanins in grape (Vitis vinifera L.)
Alexandre Fournier-Level
1,4, Philippe Hugueney
2, Clotilde Verriès
3, Patrice This
1and Agnès Ageorges
3*Abstract
Background: Plant color variation is due not only to the global pigment concentration but also to the proportion of different types of pigment. Variation in the color spectrum may arise from secondary modifications, such as hydroxylation and methylation, affecting the chromatic properties of pigments. In grapes (Vitis vinifera L.), the level of methylation modifies the stability and reactivity of anthocyanin, which directly influence the color of the berry. Anthocyanin methylation, as a complex trait, is controlled by multiple molecular factors likely to involve multiple regulatory steps.
Results: In a Syrah × Grenache progeny, two QTLs were detected for variation in level of anthocyanin methylation. The first one, explaining up to 27% of variance, colocalized with a cluster of Myb-type transcription factor genes. The second one, explaining up to 20% of variance, colocalized with a cluster of O-methyltransferase coding genes (AOMT). In a collection of 32 unrelated cultivars, MybA and AOMT expression profiles correlated with the level of methylated anthocyanin. In addition, the newly characterized AOMT2 gene presented two SNPs associated with methylation level. These mutations, probably leading to a structural change of the AOMT2 protein significantly affected the enzyme specific catalytic efficiency for the 3’-O-methylation of delphinidin 3-glucoside.
Conclusion: We demonstrated that variation in methylated anthocyanin accumulation is susceptible to involve both transcriptional regulation and structural variation. We report here the identification of novel AOMT variants likely to cause methylated anthocyanin variation. The integration of QTL mapping and molecular approaches enabled a better understanding of how variation in gene expression and catalytic efficiency of the resulting enzyme may influence the grape anthocyanin profile.
Background
Anthocyanins represent a major group of the flavonoid family, consisting of small water-soluble molecules stored in vacuoles. As widespread plant secondary metabolites, they are responsible for red and blue colors of many plant tissues [1]. Anthocyanins, as major pigments, play important roles in plant reproduction by attracting polli-nators and seed dispersers and in protection from photo-oxidative stress [2]. In crops, ornamental plants, and fruits, they constitute a key trait for the aesthetic quality of the product. In grape, they play a crucial role as they participate in both wine color and organoleptic proper-ties due to their complex interactions with other phenolic compounds, as well as with proteins and polysaccharides [3].
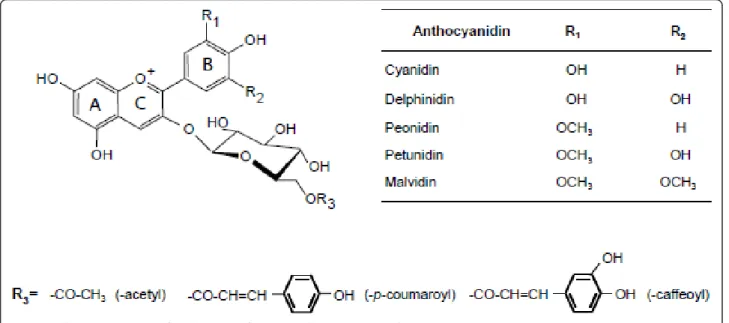
The anthocyanins identified in Vitis vinifera are 3-O-monoglucosides (3-glc) and 3-O-acyl 3-O-monoglucosides derived from the five main anthocyanidins–delphinidin (Dp), cyanidin (Cy), peonidin (Pn), petunidin (Pt) and malvidin (Mv)–, which differ from each other in the number and position of the hydroxyl and methoxyl groups located on their B-ring (Figure 1): delphinidin and cyanidin being unmethylated, peonidin and petunidin mono-methylated and malvidin di-methylated. Methyla-tion by S-adenosyl-L-methionine (SAM) dependent-O-methyltransferase plays an important role in modifying the structure of plant secondary metabolites. For antho-cyanins, methylation stabilizes the phenolic B ring, thus reducing the reactivity of the overall molecule [4], and increases water solubility, thus reinforcing its color prop-erties [5,6]. The color of anthocyanins greatly depends on the number of hydroxyl groups: the larger the number of
* Correspondence: [email protected]
3INRA, UMR 1083 Sciences pour l’OEnologie, 34060 Montpellier, France
Full list of author information is available at the end of the article
© 2011 Fournier-Level et al; licensee BioMed Central Ltd. This is an Open Access article distributed under the terms of the Creative Commons Attribution License (http://creativecommons.org/licenses/by/2.0), which permits unrestricted use, distribution, and reproduction in any medium, provided the original work is properly cited.
groups, the bluer the color. On the other hand, the O-methylation of anthocyanins has a reddening effect.
The anthocyanin biosynthesis pathway has been exten-sively characterized in numerous plant species [7,8]. In grapevine, the core structural genes of the anthocyanin pathway leading to the synthesis of Dp 3-glc and Cy 3-glc have been cloned and characterized [9,10]. Recently, two anthocyanin O-methyltransferases (AOMT and FAOMT) able to methylate anthocyanins in vitro and in vivo have been identified [11,12]. Anthocyanin biosynthesis is con-trolled by Myb-bHLH transcriptional complexes that acti-vate the expression of structural genes involved in the late steps of the pathway [7,13-16]. In particular, the VvMybA genes induce the transcription of UFGT and AOMT in colored tissues [17-19] and were shown to control antho-cyanin accumulation in grape [20,21]. While anthoantho-cyanin methylation in grapes is altered by environmental and cul-tural conditions [22,23], it is also strongly affected by genetic factors. Indeed, both the total amount of anthocya-nins and the relative abundance of single anthocyaanthocya-nins are extremely variable among red–to blue-skinned cultivars. In spite of this variability, mono–and di-methyl derivatives are largely predominant [24,25], malvidin 3-glucoside being the main anthocyanin in most cultivars and peoni-din 3-glucoside usually being less abundant [26,27]. Genes encoding flavonoid 3’–and 3’5’–hydroxylases involved in anthocyanins hydroxylation [28,29] or genes encoding O-methyltransferase involved in anthocyanins methylation [11,12,30] can potentially generate differences in anthocya-nin composition. The availability of the full genome sequence [31,32] as well as broad genetic resources will help us to further clarify the mechanisms involved in anthocyanin biosynthesis in grape.
The objective of this study was to understand the architecture of the genetic control of anthocyanin methylation in grape and to improve our understanding of the complex factors involved in the regulation of anthocyanin methylation. Two QTLs for anthocyanin methylation variation were identified: one colocalized with a MybA gene cluster and the second colocalized with a cluster of three putative AOMT genes. This work aims to validate the role of the latter in anthocyanin methylation and to identify the molecular factors under-lying genetic variation. The combination of forward genetic approaches (pedigree and population-based) with functional genomics and enzymology allowed the description of the complex regulation of an anthocya-nin-O-methyltansferase gene cluster as a major player for the control of anthocyanin methylation in grape.
Results
Variation in methylated anthocyanin content
In order to investigate the genetic bases of anthocyanin methylation, three plant collections were analyzed: (1) a Syrah × Grenache (SxG) progeny of 191 genotypes repli-cated in two blocks, (2) a collection of 50 colored geno-types from the Vassal germplasm collection (Coll 50 cv, INRA, Domaine de Vassal, France), and (3) a subset of 32 genotypes selected to optimally represent the diversity in anthocyanin methylation level of the original 50 indivi-duals sample with a smaller number of indiviindivi-duals (Core-Coll 32 cv). Anthocyanin composition differed dramati-cally both in the SxG progeny (Additional file 1) and in the collection of natural diversity (data presented for Core-Coll 32 cv, Additional file 2). After a log-transfor-mation, distribution of methylated anthocyanin (MT)
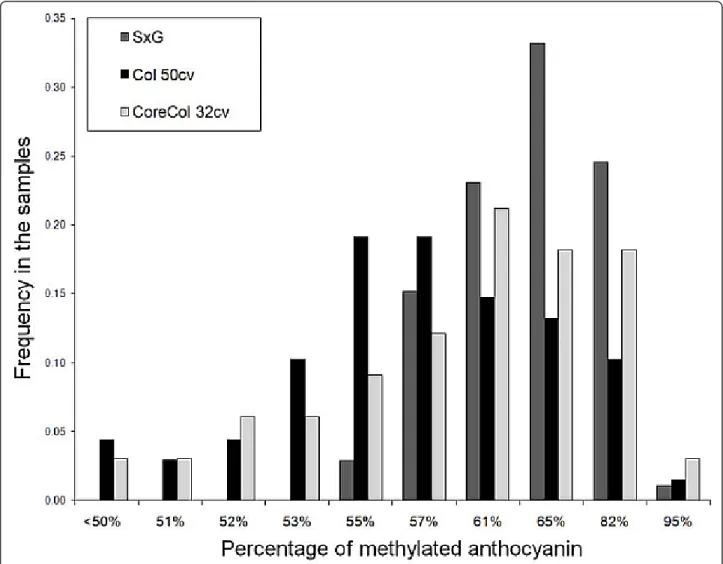
was normal in the three samples (P-val > 0.05). The SxG progeny showed extensive variation in levels of MT, ran-ging from 50% to 97% of methylated anthocyanins with a MT variance ofs2MT SxG = 0.42 (Figure 2). The collec-tion of 50 colored grape varieties (Coll 50 cv) showed variation ranging from 31% to 97% of methylated antho-cyanins with a MT variance ofs2MT 50 cv= 0.58. The var-iance was increased tos2MT 32 cv= 0.89 in the Core-Coll 32 cv.
QTL mapping of anthocyanin methylation level
QTL detection was performed either on the two field blocks taken separately or combined using a multi-trait procedure. In both cases, this allowed the consistent iden-tification of two QTLs for the anthocyanin methylation level. The first QTL, explaining 27% of the phenotypic
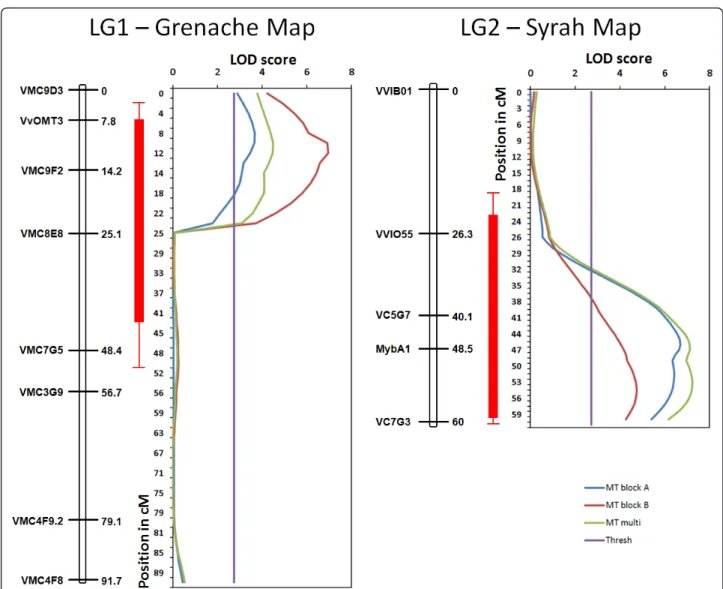
variance for anthocyanin methylation, was located on Linkage Group 2 (LG2) between the markers VMC5G7 and VMC8C2 (Figure 3). This QTL was detected on the Syrah parental map and supported with a maximum LOD of 7.49 for the multi-trait detection. It was also detected on both blocks taken separately. This QTL, which coloca-lized with a QTL previously identified as controlling the content of anthocyanins in grape berry [20], corresponded to the VvMybA genes cluster, thus controlling together anthocyanin methylation and total accumulation. The sec-ond QTL was identified on LG1 of the Grenache parental map between markers VMC9E3 and VMC8E8, explaining up to 20% of the phenotypic variance with a maximum LOD of 6.96 (Figure 3). In the present study, we focused on this second QTL, which was specific to anthocyanin methylation. The marker pOMT2, the closest to the LG1
Figure 2 Distribution of theMT variable in the samples used in QTL and association mapping. The MT variable is expressed as the logarithm of the ratio of methylated/non-methylated anthocyanins in mg of anthocyanin per g of fresh berry skin. SxG: 191 individuals from the Syrah × Grenache progeny used in QTL mapping. Coll 50 cv: random sampling of 50 colorful grape cultivars from the original
agromorphological core-collection (Barnaud et al. [33]). Core-Coll 32 cv: core-collection designed from the Coll 50 cv to optimize the capture of MT variability.
QTL, showed a difference of 11.8% between homozygous combination of alleles leading to high level of MT and het-erozygous combination at pOMT2 leading to low level of MT (Additional file 3).
Candidate genes selection in the QTL on LG1
The physical interval of 1 Mbp surrounding the maxi-mum LOD of the QTL of LG1 encompassed 46 predicted unigenes with an identity score superior to 5 (Additional file 4). Among this unigenes set, a cluster of three genes encoding putative anthocyanin O-methyltransferases (AOMT) within a 33 Kbp region was identified, referred to hereafter as VvAOMT1, VvAOMT2 and VvAOMT3 (Figure 4). VvAOMT1 encoded a protein that is identical to the AOMT from Syrah shown to methylate anthocya-nin both in vitro and in planta [11] and similar to the
FAOMT from Cabernet Sauvignon shown to methylate anthocyanin in vitro [12]; therefore, we narrowed the study to these three candidate genes. The three genes have similar structures, with five small exons ranging from 51 bp to 294 bp and four introns (Figure 4). The deduced amino acid sequences of the three OMTs showed high sequence similarity (Additional file 5) with a minimum pairwise identity score of 90% at the genomic level and of 96% at the transcript level. In addition, there was no other protein showing more than 20 amino acids with 80% similarity to AOMT in the grape genome, showing evidence for VvAOMT being a single family of paralogs. The corresponding transcripts were 708 bp long and very similar to VvAOMT1. All three genes were thus potentially functional. The 3’ non-coding ends of VvAOMT genes appeared less conserved than the coding
Figure 3 Position and linkage intensity of the QTL associated with the MT trait. The two QTLs were detected on the SXG mapping population on the Grenache parental map and on the Syrah parental map, respectively. Confidence intervals correspond to the 90% and 99% probability of presence of the QTLs after 1000 bootstrap resamplings. The QTLs presented were found for the A and B blocks and using multi-trait detection.
region, and the only robust distinction between the three isogenes thus relied on divergent non-coding 3’ ends. Iso-gene-specific primers could be designed for VvAOMT2 and VvAOMT3 cDNA, but not for VvAOMT1 cDNA, due to sequence homology with the two other isogenes and a shorter 3’ end. Using specific primers for VvAOMT3, no expression could be detected in mature berries of Syrah, Joubertin and Petit Bouschet, suggesting that this isogene was not expressed in mature red berries (Additional file 6). Although this does not demonstrate the non-functionality of VvAOMT3, it justified the further consideration of VvAOMT1 and VvAOMT2, as candidate genes in association genetic analysis both expressed in mature berries.
Effect of theVvAOMT and VvMybA expression on methylated anthocyanins
To assess the relative influence of VvAOMT and VvMybA genes, which potentially underlie the QTLs on LG1 and LG2, respectively, we measured their respective transcript accumulation in the Core-Coll 32 cv, maximiz-ing the diversity for methylated anthocyanins. We ana-lyzed the level of expression of VvAOMT (eAOMT), which combines the expression of the three isogenes VvAOMT1, VvAOMT2 and VvAOMT3 and of VvMybA (eMybA), which combines the expression of the two iso-genes VvMybA1 and VvMybA2. Both eAOMT and eMybA appeared to follow continuous variation among the 32 cultivars, showing no evidence of regulation by a single major polymorphism. eAOMT appeared to be
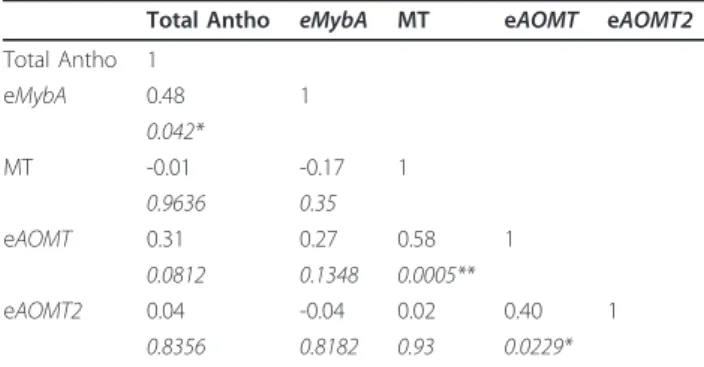
highly correlated with the methylated anthocyanin con-tent of the berry skin (r = 0.58, P-val < 0.001; Table 1). eMybA appeared correlated with total anthocyanin con-tent, but not with the methylated anthocyanin content (Table 1). Finally, the methylated anthocyanin content was better predicted when the effects of eAOMT and eMybA were considered jointly in a multivariate regres-sion model (Table 2), suggesting that the expresregres-sion level of both genes had an effect on anthocyanin methylation, probably with a direct influence of eAOMT and an indir-ect influence of eMybA.
VvAOMT3
GSVIVT01010466001VvAOMT2
GSVIVT01010468001VvAOMT1
GSVIVT01010469001 8.3Kbp 19.6Kbp 2.17Kbp 2.14Kbp 1.45Kbp 5’ 5’ 5’Sequenced on genomic DNA for the Col 50cv
Sequenced on coding DNA for the CoreCol 32cv
700bp 850bp
700bp
Figure 4 Genomic structure of the open reading frames of theVvAOMT genes cluster on chromosome 1. The continuous lines represent sections drawn at the right scale; dashed lines represent change in scale. Lines between dots represent the sequenced fragments. The filled boxes indicate the exons. Data correspond to the 12X genome annotation available from the Genoscope Grape Genome Browser database http://www.genoscope.cns.fr/externe/GenomeBrowser/Vitis/.
Table 1 Correlation between the anthocyanin content andVvMybA, VvAOMT and specific VvAOMT2 expression
Total Antho eMybA MT eAOMT eAOMT2 Total Antho 1 eMybA 0.48 1 0.042* MT -0.01 -0.17 1 0.9636 0.35 eAOMT 0.31 0.27 0.58 1 0.0812 0.1348 0.0005** eAOMT2 0.04 -0.04 0.02 0.40 1 0.8356 0.8182 0.93 0.0229*
Total Antho: total anthocyanin content, MT: level of methylated anthocyanin, eMybA: global VvMybA expression level, eAOMT: global VvAOMT expression and eAOMT2: specific VvAOMT2 expression in the Core-Coll 32 cv sample. The Pearson’s r values are presented in plain text while their associated P-values are shown in italic (* < 5% and ** < 1%)
Association mapping withVvAOMT1 and VvAOMT2 To isolate the particular effect of the two VvAOMT can-didate genes, we partially sequenced both genes in the collection of 50 colored varieties (genomic DNA frag-ments corresponding to 700 bp of 3’end of VvAOMT1 and 850 bp of 3’end of VvAOMT2; Figure 4). This allowed detecting polymorphisms on genomic DNA in the two last exons and in the 3’UTR specifically for both VvAOMT candidates (high sequence homology and shorter 3’UTR for VvAOMT1 did not allow specific amplification at the complete coding sequences). On VvAOMT1, we identified 15 SNPs and 2 InDels, and, on VvAOMT2, we identified 19 SNPs and 1 InDel, giving rise to 9 non-synonymous mutations. We tested the asso-ciation of these polymorphisms with the level of methy-lated anthocyanins using the EMMA software [34]. Six SNPs were identified as associated with variation in anthocyanin methylation in VvAOMT2 and none in VvAOMT1. The significantly associated polymorphisms with P-value < 0.05 and the test statistics are presented in Table 3. SNP Y522 did not change the amino acid sequence of the gene, and the five other associated poly-morphisms were located in the 3’UTR part of the VvAOMT2 gene, thus not affecting the protein structure. All six associated SNPs showed significant LD, with one LD block, including SNPs Y522, Y717, Y741 and W774 (pairwise r2= 0.5-1), and another LD block, including M843 and InDel909 (pairwise r2= 0.6). However, given the high level of polymorphism at both loci, we expected that if there was functional variation elsewhere in the
VvAOMT1 sequence, we would have genotyped at least one SNP significantly associated through LD with the causal variation. In addition to the two blocks of LD reported for VvAOMT2, two blocks of high LD were identified on VvAOMT1 (Additional file 7). However, no intergenic LD was significant between VvAOMT1 and VvAOMT2, showing a rapid decay of LD in the genomic fragment including these genes. As VvAOMT2 was the only isogene showing polymorphism association with anthocyanin methylation level, we only retained VvAOMT2 as candidate gene.
Specific expression ofVvAOMT2
Isogene-specific primers were designed to measure the specific expression of the candidate gene VvAOMT2 in (1) MybA1 transformed grapevine hairy roots accumu-lating anthocyanin [18] and in (2) the Core-Coll 32 cv (Additional file 2). As we did not succeed in designing specific primers for AOMT1, we could only compare the global expression eAOMT (VvAOMT1 plus VvAOMT2) using non specific primers with the specific expression VvAOMT2. In hairy roots over-expressing MybA1, the expression of VvAOMT2 showed a 5.5-fold increase compared to the control, while the level of eAOMT, showed a 75-fold increase (Additional file 8). Although the effect of VvMybA1 on VvAOMT2 cannot be neglected, these results suggest that the effect of VvMybA1 on VvAOMT2 is limited. In the 32 cultivars subcore-collection, no significant correlation was found between the expression level of VvAOMT2 and the ratio of methylated anthocyanins. Moreover, no significant effect of eMybA was observed on the expression of VvAOMT2 (Table 1). However, even if the specific expression level of VvAOMT2 is correlated with global eAOMT (r = 0.40, P-val = 0.023) and has a significant regulatory effect of eAOMT on the level of methylation, in the absence of correlation between VvAOMT2 expression and MT, we concluded that VvAOMT2 expression had no direct regulatory effect on anthocya-nin methylation.
Table 2 Effects ofVvAOMT and VvMybA global expression on theMT variable in the Core-Coll 32 cv
N of variables ajusted R2 BIC Variables in the model
1 0.31 -23.17 eOMT
2 0.41 -26.72 eOMT eMybA
0.31 0.1
Both variables (eAOMT and eMybA, respectively) show independent significant effect in a multiple regression test, the number in italic corresponds to the partial R-squared of each effect tested
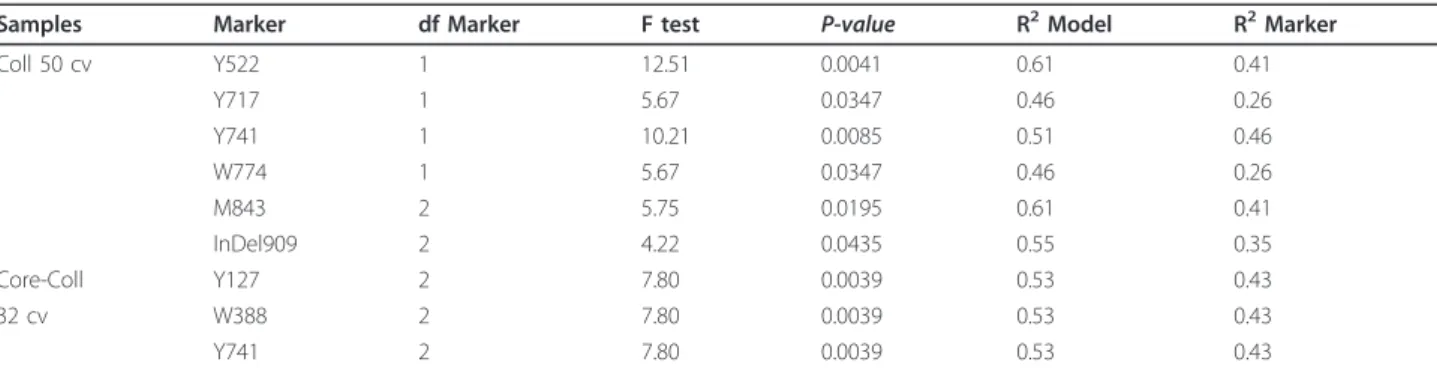
Table 3 Association genetics tests performed onVvAOMT2 polymorphisms for the level of methylated anthocyanin
Samples Marker df Marker F test P-value R2Model R2Marker
Coll 50 cv Y522 1 12.51 0.0041 0.61 0.41 Y717 1 5.67 0.0347 0.46 0.26 Y741 1 10.21 0.0085 0.51 0.46 W774 1 5.67 0.0347 0.46 0.26 M843 2 5.75 0.0195 0.61 0.41 InDel909 2 4.22 0.0435 0.55 0.35 Core-Coll Y127 2 7.80 0.0039 0.53 0.43 32 cv W388 2 7.80 0.0039 0.53 0.43 Y741 2 7.80 0.0039 0.53 0.43
Tests were performed using genomic DNA sequence fragments in the Coll 50 cv and coding DNA sequence in the Core-Coll 32 cv. Only the significant tests are shown. Df: degree of freedom, R2
Sequence analysis of theVvAOMT2 gene
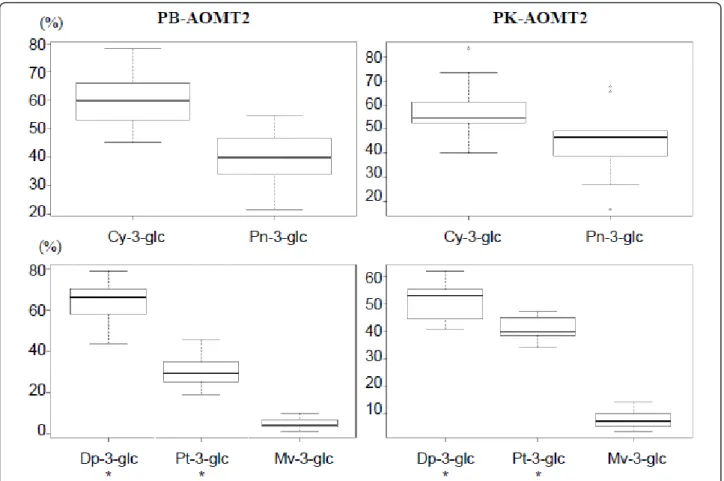
We fully sequenced the VvAOMT2 cDNA of the Core-Coll 32 cv and identified 30 polymorphisms in the ORF, including 26 SNPs and 4 InDels (Additional file 9). As the genomic and cDNA fragments sequenced for VvAOMT2 partially overlapped, 8 were common to those already identified in the 50 cultivars sample, including the 4 most associated SNPs presented in Table 3. This new poly-morphism set was tested again for association with methy-lated anthocyanin level in the Core-Coll 32 cv and only three associations were found to be significant: Y741 was again strongly associated, as well as two new SNPs, Y127 and W388. These three SNPs showed complete linkage disequilibrium (r2= 1) and their effects were thus con-founded. In addition, the VvOMT2 sequence for the par-ents of the SxG population showed to be homozygous for the strong allele of W388 and Y741 in the Syrah parent and heterozygous in the Grenache parent, following the same segregation as the pOMT2 marker. This supported that the Grenache QTL on LG1 could be attributed to the segregation of VvOMT2 alleles in the mapping population. Finally, in the best model including only expression pro-files, eAOMT explained 31% of the variance while the sin-gle SNP Y127 or W388 in the association model explained 43% of variance for the same sample (Table 2 and Table 3). This strong effect was associated with a highly signifi-cant difference in anthocyanin methylation between the groups carrying the strong or the weak allele at SNPs Y127 and W388 (MT being on average 94.7% and 76.5% respectively). The SNPs Y127 and W388 corresponded to non-synonymous changes affecting the primary structure of the AOMT protein. Y127 led to a substitution from H to Y in position 43 of the amino acid chain and W388 led to a substitution from S to T in position 130 of the amino acid chain. Y127 appeared to generate a mutation within the seconda-helix of the predicted protein secondary structure and W388, within the sixth predicteda-helix. Characterization of the allelic variants ofVvAOMT2 Two grape varieties were selected for the homozygous pre-sence of contrasting SNPs Y127 and W388 at the VvAOMT2 locus, representing two allelic variants of the corresponding AOMT2 protein.‘Petit Bouschet × Aramon n°4’ (PB) presented the weak alleles T at Y127 and A at W388 and‘Papadiko’ (PK) presented the strong alleles C at Y127 and T at W388. No other difference was detected in the coding region. Enzymatic tests performed with PB-AOMT2 and PK-PB-AOMT2 indicated that both enzymes catalyzed in vitro the 3’ O-methylation of anthocyanins with a catechol B-ring (3’,4’ di-OH) and the 3’ and 5’ O-methylation for those showing a pyrogallol (3’,4’,5’ tri-OH) B-ring. However detailed analysis of PB-AOMT2 and PK-AOMT2 activity revealed substrate-specific differences in catalytic efficiency (Table 4). Indeed, when Cy 3-glc was
used as a substrate, both PB-AOMT2 and PK-AOMT2 appeared to catalyze equally well the methylation of Cy 3-glc into Pn 3-3-glc. By contrast, when Dp 3-3-glc was used as a substrate, PB-AOMT2 showed a significantly reduced efficiency compared to PK-AOMT2 in producing Pt 3-glc (mean difference in relative final Pt 3-glc proportion of 9.7%, P-val = 0.02, Figure 5). Finally, both enzymes were able to convert Dp 3-glc in Mv 3-glc with similar efficiency although in small proportion.
Discussion
Combining molecular physiology and genetics to dissect complex traits in plants
Major steps forward in the study of plant anthocyanin synthesis were made through molecular physiology and forward genetics experiments [7]. However, QTL and association mapping techniques have also proven to be relevant tools in the dissection of complex physiological traits, in particular for anthocyanin metabolism [35]. Since their large scale application in maize, only a few attempts to clone and validate the polymorphisms of the genes underlying variation have been successful [36]. In this work, we propose different approaches to draw a global picture of the regulation of anthocyanin methylation in grape. As a starting point, we performed a rational sam-pling of highly diversified phenotypes present in the Vassal germplasm repository (INRA, Domaine de Vassal, France) by using the M-method [37,38]. This method ensures the optimal capture of phenotypic diversity suitable to detect contrasted genetic effects. The use of QTL mapping and the colocalization of a VvAOMT cluster on chromosome 1, provided independent evidence supporting that the VvAOMT genes may play a key role in determining the level of methylated anthocyanins in grape. The availability Table 4 Substrate specificity of the recombinant AOMT2 proteins from Papadiko (PK-AOMT2) and from Petit-Bouschet × Aramon n°4 (PB-AOMT2)
Enzyme Substrate Products relative amounts (%) PK-AOMT2 Dp 3-glc Dp 3-glc 51.1 (± 6.9) * Pt 3-glc 40.8 (± 4.0) * Mv 3-glc 8.1 (± 3.3) Cy 3-glc Cy 3-glc 58.4 (± 12.2) Pn 3-glc 44.9 (± 15.4) PB-AOMT2 Dp 3-glc Dp 3-glc 63.6 (± 11.1) * Pt 3-glc 31.2 (± 8.6) * Mv 3-glc 5.3 (± 2.6) Cy 3-glc Cy 3-glc 60.6 (± 9.3) Pn 3-glc 39.4 (± 9.2)
Reaction were essayed in vitro and products were identified according to their UV visible absorption spectra and retention time. Quantifications were based on peak areas at 520 nm. The data presented are the mean of 10 experiments performed with 3 independent protein preparations (± standard deviation), * indicates significance in ANOVA test (P-values < 0.05). Dp, delphinidin; Cy, cyanidin; Pt, petunidin; Pn, peonidin; Mv, malvidin; glc, glucoside
of broad genetic resources together with the use of grape genomic tools [31] helped refine our QTL detection through gene expression and association mapping studies, demonstrating the likely involvement of both cis-regula-tion and newly characterized allelic variacis-regula-tion in shaping a complex phenotype.
The pleiotropic influence ofVvMybA genes
The QTL for MT level detected on LG2 (explaining 35% of the variance) co-localized with a VvMybA genes cluster, supporting that VvMybA genes have an important effect on anthocyanin methylation. The results found in previous work with the same experimental design [20] showed nonetheless that this region better explained the total anthocyanin content (64% of variance explained) than the level of methylated anthocyanins. This suggested that this QTL, cosegregating with VvMybA genes cluster, mostly had an effect on total anthocyanin accumulation and by consequence, an indirect effect on anthocyanin methyla-tion. The VvMybA genes control the transcription of key genes of the late steps of the anthocyanin biosynthesis: UFGT and AOMT [18]. Our study showed that VvMybA1 has a significant effect on global VvAOMTs expression
level. VvUFGT catalyzes the glycosyl transfer on C3 of the anthocyanidin aglycone [19,39]. VvAOMT catalyzes the methylation of Dp 3-glc into both Pt 3-glc and Mv 3-glc, and that of Cy 3-glc into Pn 3-glc [11]. This pleiotropic effect of the VvMybA locus explains the relationship between the amount and the nature of the synthesized anthocyanins. This effect could also explain why black grape berries always contain large amounts of malvidin, the most methylated form of anthocyanidins [24-26]. UFGT and AOMT genes showed similar expression pro-files [18,40] and to date, polymorphisms in their sequence were never associated with variation in anthocyanin con-tent [9,11,13]. Thus, these genes were considered so far to be purely cis-regulated and to have no regulatory control on the anthocyanin pathway.
Determining the influence ofVvAOMT genes independently ofVvMybA genes
We intended to identify regulation factors specific to the anthocyanin methylation level and independent of the total anthocyanin content. The MT variable and the total anthocyanin content were statistically independent, so the cosegregation of the QTLs for the two traits and
Figure 5 Difference in catalytic efficiency between the PB-AOMT2 and PK-AOMT2 allelic variants. Specific catalytic efficiency in performing 3’-and 3’5’-O-methylation was measured on either cyanidin 3-O-glucoside (Cy 3-glc) and delphinidin 3-O-glucoside (Dp 3-glc). Box plots indicate 5, 25, 50, 75 and 95 percentile, respectively. * indicates significant ANOVA test (P-value < 0.05).
the correlation between the VvMybA1 expression and MT were thus strictly due to biological effects. Nonethe-less, genes specifically inducing differences in anthocya-nin composition should either be independent of the expression of VvMybA or show trans-regulation or structural variation associated with anthocyanin methy-lation. In the search for such specific factors of the anthocyanin methylation process, the key was to find elements of variation that were significantly independent of the global anthocyanin VvMybA cis-regulated chan-nel. Recently, a similar example was shown in Ipomoea for a dihydroxyflavonol reductase (a gene also involved in the anthocyanin pathway) where duplicated genes escaped the control network for greater adaptation [41]. We might also suspect this to be the case of VvAOMT2 and anthocyanin methylation.
TheVvAOMT genes cluster, the fate of a duplicated gene family
Grape varieties accumulating only non-methylated anthocyanins have never been described [24-26] and were also not identified in our study on a very diverse sample, necessarily involving the persistency of functional AOMT in the grape genome. Two mechanisms can gen-erate such a pattern: a strong selective constraint on AOMT activity and a functional redundancy limiting the effect of deleterious mutations at VvAOMT locus. We identified 3 candidate genes encoding OMTs located on chromosome 1 in the confidence interval of the QTL, potentially all coding for functional proteins, which sup-ports initial functional redundancy. In three genotypes with very contrasting MT phenotypes, only VvAOMT1 and VvAOMT2 were expressed in mature grape berries, no expression of VvAOMT3 being detected. The total expression of VvAOMT (VvAOMT1 and VvAOMT2 together) showed a high correlation with the level of methylation, while the specific expression of VvAOMT2 did not. We may thus hypothesize that VvAOMT1 is cis-regulated by the VvMybA genes, as reported in Ageorges et al. [17] and Cutanda-Perez et al. [18], and broadly determines the level of methylated anthocyanins. Conver-sely, VvAOMT2 expression was only marginally affected by VvMybA genes and showed structural variation, affecting anthocyanin methylation: the functional redun-dancy is decreasing as mutations accumulate. Although many other elements of variation may be involved in anthocyanin methylation, we may hypothesize a model as follows: VvAOMT1 is the fundamental isogene for anthocyanin methylation under strict functional con-straint, while VvAOMT2 undergoing lesser functional constraint is responsible for fine and specific differences in the level of methylated anthocyanins (see proposed model Figure 6).
The complex base of anthocyanin methylation in grape Previous works in petunia and grape suggested that dif-ferent OMTs were responsible for the O-methylation of anthocyanins at either 3’ or 5’ positions [42,43]. In con-trast, Hugueney et al. [11] identified a bifunctional AOMT catalyzing 3’ and 5’ O-methylation, suggesting that AOMT alone would be sufficient to perform both methylation steps in grape berries. In this study, we showed that the two proteins encoded by allelic variants of VvAOMT2 were also able to perform in vitro 3’ or 3’,5’ methylation on Cy 3-glc and Dp 3-glc but in addi-tion, we identified two SNPs associated with variation in the level of methylated anthocyanins. We showed that this polymorphism led to changes in substrate-specific catalytic efficiency, which only affects Dp 3-glc methyla-tion into Pt 3-glc. Differential 3’ O-methylation on trihy-droxylated anthocyanin substrate due to protein variants may explain the quantitative differences observed in planta, after removing the effect of VvAOMT1. Further-more, the comparison with the AOMT1 and FAOMT characterized previously [11,12] showed that AOMT2 variants characterized in this study tend to produce a lower proportion of Mv 3-glc, with a preferential cataly-sis of the 3’ O-methylation. Indeed, both AOMT2 var-iants synthesized the same low relative proportion of Mv 3-glc (8.1% and 5.3%, respectively) while in similar conditions, AOMT1 was able to synthesize up to 34% of Mv 3-glc [11]. Finally, variation in catalytic properties together with potential differential expression is defi-nitely capable of creating the complex pattern of methy-lated anthocyanin variation we observe in different grapes cultivars.
Conclusions
The aim of this work was to identify and quantify the effect of molecular factors controlling the variation of anthocyanin methylation in grape by combining genetic mapping and functional study. Most previous studies regarding the accumulation of anthocyanin in grape have pointed to the main involvement of the VvMybA locus [16,18-21,44]. Our findings confirmed the effect of this locus, but we made an important step forward by reveal-ing the influence of novel factors other than Myb type genes involved in variation of anthocyanin composition. We quantitatively assessed the effect of the VvAOMT genes cluster on anthocyanin methylation. Furthermore, we identified new gene variants encoding proteins with slight differences in catalytic properties from other AOMTs described so far, showing allele-guided substrate specificity. This study improves our knowledge on how differences in methylated anthocyanin level may exist independently of total anthocyanin content. The relative independence of these two traits is possible because of
the partial functional redundancy between the VvAOMT isogenes, among which VvAOMT2“escaped” the control of VvMybA. Finally, with a relaxed functional constraint on VvAOMT2 while VvAOMT1 is still ensuring the per-sistency of the activity, variation could arise, giving rise to novel phenotypes.
Methods
Plant materials
The plant material consisted of three populations: one cross-derived mapping population for QTL mapping and two nested natural populations for the association study. The mapping population (SxG) was a F1 progeny
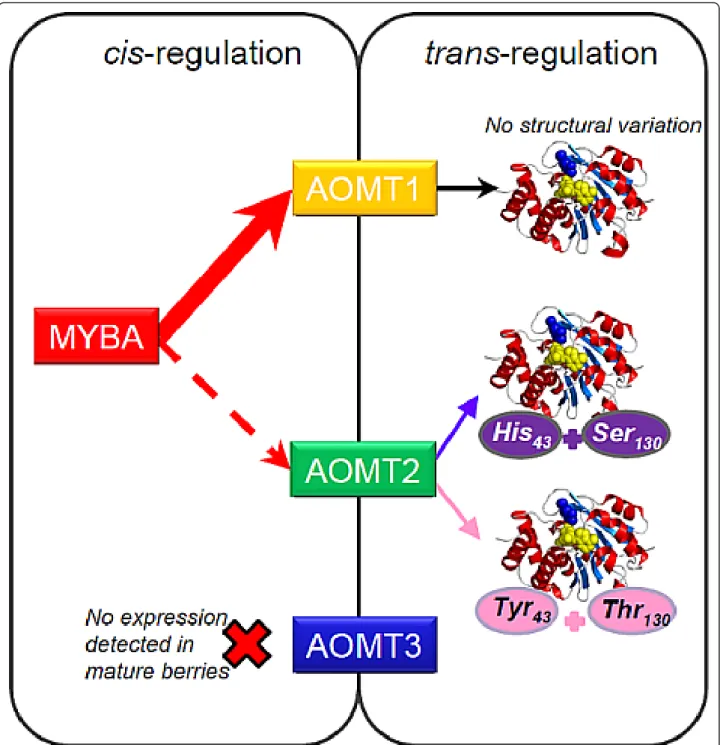
Figure 6 Synthetic scheme of the regulation of anthocyanin methylation in grape berry. The red arrows present the main influence of MybA protein cis-regulating AOMT1, the key enzyme involved in anthocyanin methylation. In addition, AOMT2, less influenced by MybA, trans-regulate anthocyanin methylation through allelic structural variation influencing enzymatic efficiency. Finally, AOMT3 expression was not detected in mature berries.
of 191 individuals from a reciprocal cross between clone 73 of Syrah (S) and clone 516 of Grenache (G) repli-cated in two blocks (A and B) as previously described [20]. Fifty colorful genotypes from the agromorphologi-cal core-collection defined by Barnaud et al. [33] were selected to optimally represent the diversity in anthocya-nin methylation level. All genomic DNA analyses pre-sented in the study were realized on this collection of 50 colorful cultivars. Within these 50 genotypes, we selected a subset of 32 individuals (listed in Additional file 2) designed through the M-method [37,38] to opti-mize the variability of the level of anthocyanins methyla-tion. All transcriptomic analyses and sequencing of cDNA performed in the study were realized on this 32 subcore-collection. Mature berries of each genotype were harvested 32 days after véraison.
Traits analyzed
Grape berries were harvested at the same level of matur-ity (20° Brix) in 2006 for the SxG progeny and in 2008 for the colorful genotypes and the subcore-collection. The anthocyanin composition of samples was analyzed as described in Fournand et al. [45]. The concentration of delphinidin (Dp), cyanidin (Cy), peonidin (Pn), petunidin (Pt) and malvidin (Mv) derivatives was expressed in mg of malvidin 3-O-glucoside equivalent per gram of fresh berry skin. Level of anthocyanin methylation (MT) was calculated as the ratio of methylated/non-methylated anthocyanins. The methylated/non-methylated ratio was log-transformed in order to unskew their distribution. In the SxG sample, the normality of the distribution was checked using the Shapiro-Wilks test for individuals con-taining anthocyanins (non-white cultivars). The total anthocyanin content was calculated as ln(1 + x) where × is the sum of all anthocyanin compounds. The HPLC data and the MT variable for the subcore-collection are presented in Additional file 2.
DNA extraction, genotyping and sequencing
Two square centimeters (80-100 mg) discs of fresh young leaves were collected for each genotype. DNA was extracted using a Qiagen DNA Plant Mini Kit (QIAGEN S.A., Courtaboeuf, France) with slight modifications as described in Adam-Blondon et al. (2004). The 191 SxG offsprings have been previously genotyped for 97 SSR markers to cover the genome with minimal inter-marker space (maximum of 10 cM) with the most informative polymorphisms (priority given to 1:1:1:1 segregating mar-kers). An additional marker corresponding to a 200 bp insertion/deletion polymorphism (InDel) in the VvAOMT2 locus promoter was genotyped. PCR conditions were 95°C for 7 min, 35 cycles of 95°C (30 s), 58°C (30 s), 72°C (1 min) and a final cycle of 72°C for 5 min. Amplified frag-ments were run on a 1% agarose gel, stained with
ethidium-bromide and photographed under UV light. Amplification primers were designed using the Primer 3 software and are listed in Additional file 10. PCR frag-ments were amplified, sequenced, and analyzed as described by Le Cunff et al. [46].
RNA extraction, sequencing and quantitative real-time PCR
For transcriptomic assays, berries were sorted by density on salt gradient between 100 and 120 g/L to ensure homo-genous maturity stage within and across all samples and immediately frozen in liquid nitrogen. RNA was extracted from 200 mg of berry powder using RNeasy Plant Mini Kit (QIAGEN S.A., Courtaboeuf, France) following the manufacturer’s protocol and then quantified with Ribo-green (Molecular probes, Leiden, The Netherlands). Reverse transcription was performed in triplicate from each sample from 500 ng of purified RNA as described in Fournier-Level et al. [20]. Amplification primers were designed using the Primer 3 software and are listed in Additional file 10. PCR fragments were amplified, sequenced and analyzed as described in Le Cunff et al. [46]. The expression of VvAOMT and VvAOMT2 was measured for the 32 cultivars showing contrasted methy-lated anthocyanin berry content. PCR was performed as described in Fernandez et al. [47] by comparing the cycle threshold (CT) of the target gene with that of VvEF-1 alpha gene used as an internal standard.
Framework genetic maps and QTL detection
Framework genetic maps were constructed according to the pseudo-testcross strategy [48] using Carthagene 0.999R software [49] as described in Fournier-Level et al. [20] with an additional marker added corresponding to a 200 bp InDel in VvAOMT2 of chromosome 1 seg-regating in the SxG cross. QTL detection was performed on both parents and consensus maps. Composite inter-val mapping (CIM) on MT was performed separately on the A and B blocks for the consensus map using MapQTL 4.0 [50], and both blocks together for parental maps using the multi-trait option QTL Cartographer [51]. For CIM on the parental maps, we used the For-ward & BackFor-ward regression method for cofactor selec-tion with 0.1 as the in-and-out threshold for the P-value of the partial F-test. Then, a genome scan was per-formed with a maximum of five cofactors within a 10 cM window. LOD thresholds corresponding to an experimentwise error rate of 5% were then determined through 1000 permutations. For CIM on the consensus map, we determined the simple interval mapping LOD thresholds through 1000 permutations with a genome-wide error rate of 5%. 99% and 90% confidence intervals were determined through 1000 bootstrap resampling using the R/qtl package.
Statistical tests
Statistical tests were performed using R software (The R project, USA) following the Shapiro-Wilks method for normality tests and Pearson’s for correlation tests. Candi-date genes were selected on the grape reference genome sequence according to (1) their presence in the QTL inter-vals and (2) their homology with genes involved in antho-cyanin metabolism. Association tests were carried out using R following the Efficient Mixed Model Association method [34] with kinship matrix estimated using 20 SSR markers scattered along the 19 grape linkage groups [52]. Association tests were performed on each gene in order to determine the highly associated polymorphisms based on P-values and adjusted R2
of a mixed linear model using the kinship matrix as the variance-covariance matrix to control for the genetic background“structure” effect. Cloning ofVvAOMT2 and characterization of recombinant VvAOMT2
The full-length cDNA of VvAOMT2 was amplified from cDNA of mature berries from two cultivars, Petit Bouschet × Aramon n°4 (PB) and Papadiko (PK), with high-fidelity Taq polymerase (Advantage-HF 2 PCR kit; Clonetech) using the upstream primer 5’-GTGGATCCTCTTCAAC-CATGTCCAGCTCAAGTCA-3’ and the downstream pri-mer 5’-TTGCGGCCGCATAGATTTAGGCTAATAGA GGCGC-3’. The corresponding amplified cDNAs were named PK-AOMT2 (cv. Papadiko) and PB-OMT2 (cv. Petit Bouschet × Aramon n°4). Both amplified cDNAs for VvAOMT2 were cloned into the pGEM-T easy vector (Promega) and the resulting plasmids were sequenced to verify that no mutation had been introduced. The recom-binant plasmids were then digested by the BamH1/Not1 enzymes, and the resulting restriction fragments were ligated into the pGEX-4 T-2 recombinant vector (GE Healthcare) digested by BamH1/Not1. The AOMT2 pro-teins were expressed as GST fusion propro-teins. Recombinant proteins were purified using glutathion Sepharose affinity resin following the pGEX instruction’s manual. The char-acterization of the recombinant proteins was performed after the cleavage of the GST moiety using a site-specific protease whose recognition sequence was located immedi-ately upstream from the multiple cloning sites on the pGEX plasmid and then quantified by SDS-PAGE (Addi-tional file 11). The activity of both PB-AOMT2 and PK-AOMT2 enzymes was then tested in vitro using anthocya-nins as substrate in the presence of S-adenosyl-L-methio-nine (SAM) as described in Hugueney et al. [11]. The enzymatic reactions were incubated at 30°C for 1 h 30. For AOMT2 characterization, three independent recombinant protein preparations were tested, and four enzymatic assays were performed with each preparation. Reaction products were analyzed by HPLC-DAD as previously described [45]. Anthocyanins were identified according to
their UV-visible absorption spectra and retention time; quantifications were based on peak areas at 520 nm using external calibration with malvidin 3-glucoside.
Accession numbers
Sequence data from this article have been deposited with the EMBL/GenBank data libraries under accession number # HQ702997 (AOMT2 from Petit Bouschet × Aramon n°4). The sequence Papadiko differs from Petit Bouschet × Aramon n°4 in two SNPs (T127 to C and A388 to T).
Additional material
Additional file 1: Summary statistics describing the anthocyanin profiles in the SxG progeny. The anthocyanin content is expressed in mg of aglycone anthocyanin per g of fresh berry skin. Key: Min, minimum; Qu, quantile; Max, maximum.
Additional file 2: Anthocyanin content and expression profile of VvMybA, VvAOMT and VvAOMT2 in the Core-coll 32 cv.
Anthocyanins content is expressed in mg of anthocyanin per g of fresh skin and expression profile for VvMybA, VvAOMT and VvAOMT2 expressed as–2ΔCt.
Additional file 3: Comparison of the MT variation between the two alleles of the SxG progeny measured in the block B. The Syrah parent is homozygote for the“strong” allele of VvOMT2 while the Grenache parent is heterozygous with the“weak” and"strong” combination of alleles.
Additional file 4: List of the unigene from the NCBI Vitis EST database present in 1.05 Mbp surrounding the position of maximum LOD for the QTL on the LG1.
Additional file 5: Comparison of the AOMT1, AOMT2 and AOMT3 amino acid sequences. Amino acid sequences were aligned using CLUSTAL W. Residues identical to the VvAOMT1 sequence were shaded. Additional file 6: Specific amplification of AOMT, AOMT2 and AOMT3 on both (A) genomic DNA and (B) coding DNA. (A) Amplification on genomic DNA (cv. Syrah). (B) Amplification on cDNA of cv. Joubertin (1; 2; 3), cv. Molinara (4; 5; 6) and cv. Petit Bouschet (7; 8; 9) mature berries of AOMT (1; 4; 7), AOMT2 (2; 5; 8) and AOMT3 (3; 6; 9). Additional file 7: Linkage disequilibrium between polymorphisms in the VvAOMT1 and VvAOMT2 genes for the collection of 50 cv. R2 are reported on the lower diagonal and P-val from chi-square test for independence are reported on the upper diagonal.
Additional file 8: Quantitative real-time PCR expression profiling of AOMT (black) and AOMT2 (grey) in hairy roots (control and VlmybA1-2 transformed). All data are the mean (± SD) of three replicates on two (control) and four (VlmybA1-2 transformed) independent lines. Expression values have been normalized with VvEF1alpha and expressed as relative abundance.
Additional file 9: Polymorphisms in the VvAOMT2 cDNA. The name of the SNPs corresponds to the nature of the mutation in IUB code followed by the position on the coding sequence. Non-synonymous mutations are presented in bold with a red arrow, mutations in the 3’UTR non-coding sequence are presented with dashed arrows and not reported at the right scale.
Additional file 10: PCR primers used for real-time PCR and expected size for amplified fragments. Key: gDNA (genomic DNA); cDNA (coding DNA).
Additional file 11: SDS-PAGE of the recombinant AOMTs obtained from cv. Papadiko (PK-AOMT) and cv. Petit Bouschet × Aramon n°4 (PB-AOMT). Lanes: (1) protein size markers; (2) purified PK-AOMT after GST cleavage. (3) purified PB-AOMT after GST cleavage. The molecular weights of the markers are indicated in kDa.
Acknowledgements
We thank the technical staff for the sample preparation and phenotypic analysis, in particular, Yves Bertrand, Patrick Ortigosa, Marc Farnos and Michel Grolier (INRA Montpellier) and the staff of Domaine de Vassal for grape cultivation. We also thank Sandrine Vialet (INRA Montpellier) for excellent support in quantitative RT-PCR analysis, Cecile Morel and Jean-Marc Souquet for performing the HPLC analysis. We are indebted to Peter Beyer (Center for Applied Biosciences, Freiburg, Germany), for the use of his laboratory facility. Finally, we thank Véronique Cheynier (INRA Montpellier) and Loic Le Cunff (IFV Montpellier) for critically reading the manuscript and Jonathan Wang for English editing.
This work was financially supported in part by the European project program FLAVO 2005-51396, by the French Genoplante project,
COREGRAPGEN (Trilat 017), by INRA and by the Languedoc-Roussillon region. Author details
1
INRA, UMR 1097 Diversité et Adaptation des Plantes Cultivées, 34060 Montpellier, France.2INRA, UMR 1131 Santé de la Vigne et Qualité du Vin,
F-68000 Colmar, France. Université de Strasbourg, UMR 1131, 67000 Strasbourg, France.3INRA, UMR 1083 Sciences pour l’OEnologie, 34060
Montpellier, France.4Department of Ecology and Evolutionary Biology,
Brown University, Providence, RI 02912, USA. Authors’ contributions
AFL and AA wrote the manuscript. AFL, AA, PT and PH designed the study. AFL, AA, CV and PH performed the experiments. PT and PH revised the manuscript. All authors read and approved the final manuscript. All authors declare no conflict of interest.
Competing interests
The authors declare that they have no competing interests. Received: 21 June 2011 Accepted: 15 December 2011 Published: 15 December 2011
References
1. Harborne JB, Williams CA: Advances in flavonoid research since 1992. Phytochemistry 2000, 55(6):481-504.
2. Winkel BSJ: Metabolic channeling in plants. Annu Rev Plant Biol 2004, 55:85-107.
3. Vidal S, Francis L, Williams P, Kwiatkowski M, Gawel R, Cheynier W, Waters E: The mouth-feel properties of polysaccharides and anthocyanins in a wine like medium. Food Chem 2004, 85(4):519-525.
4. Sarni P, Fulcrand H, Souillol V, Souquet JM, Cheynier V: Mechanisms of anthocyanin degradation in grape must-like model solutions. Journal of the Science of Food and Agriculture 1995, 69(3):385-391.
5. Brouillard R, Iacobucci GA, Sweeny JG: Chemistry of anthocyanin pigments .9. Uv visible spectrophotometric determination of the acidity constants of apigeninidin and 3 related 3-deoxyflavylium salts. J Am Chem Soc 1982, 104(26):7585-7590.
6. Dangles O, Saito N, Brouillard R: Anthocyanin intramolecular copigment effect. Phytochemistry 1993, 34(1):119-124.
7. Holton TA, Cornish EC: Genetics and biochemistry of anthocyanin biosynthesis. Plant Cell 1995, 7(7):1071-1083.
8. Mol J, Grotewold E, Koes R: How genes paint flowers. Plant Biotechnol in Vitro Biol in the 21st Century 1999, 36:597-600.
9. Boss PK, Davies C, Robinson SP: Expression of anthocyanin biosynthesis pathway genes in red and white grapes. Plant Mol Biol 1996, 32(3):565-569.
10. Sparvoli F, Martin C, Scienza A, Gavazzi G, Tonelli C: Cloning and molecular analysis of structural genes involved in flavonoid and stilbene biosynthesis in grape (Vitis-Vinifera L). Plant Mol Biol 1994, 24(5):743-755. 11. Hugueney P, Provenzano S, Verries C, Ferrandino A, Meudec E, Batelli G,
Merdinoglu D, Cheynier V, Schubert A, Ageorges A: A novel cation-dependent O-methyltransferase involved in anthocyanin methylation in grapevine. Plant Physiol 2009, 150(4):2057-2070.
12. Lucker J, Martens S, Lund ST: Characterization of a Vitis vinifera cv. Cabernet Sauvignon 3’, 5’-O-methyltransferase showing strong preference for anthocyanins and glycosylated flavonols. Phytochemistry 2010, 71(13):1474-1484.
13. Kobayashi S, Ishimaru M, Hiraoka K, Honda C: Myb-related genes of the Kyoho grape (Vitis labruscana) regulate anthocyanin biosynthesis. Planta 2002, 215(6):924-933.
14. Koes R, Verweij W, Quattrocchio F: Flavonoids: a colorful model for the regulation and evolution of biochemical pathways. Trends Plant Sci 2005, 10(5):236-242.
15. Ramsay NA, Glover BJ: MYB-bHLH-WD40 protein complex and the evolution of cellular diversity. Trends Plant Sci 2005, 10(2):63-70. 16. Walker AR, Lee E, Bogs J, McDavid DAJ, Thomas MR, Robinson SP: White
grapes arose through the mutation of two similar and adjacent regulatory genes. Plant J 2007, 49(5):772-785.
17. Ageorges A, Fernandez L, Vialet S, Merdinoglu D, Terrier N, Romieu C: Four specific isogenes of the anthocyanin metabolic pathway are
systematically co-expressed with the red colour of grape berries. Plant Sci 2006, 170(2):372-383.
18. Cutanda-Perez MC, Ageorges A, Gomez C, Vialet S, Terrier N, Romieu C, Torregrosa L: Ectopic expression of VlmybA1 in grapevine activates a narrow set of genes involved in anthocyanin synthesis and transport. Plant Mol Biol 2009, 69(6):633-648.
19. Kobayashi S, Goto-Yamamoto N, Hirochika H: Association of VvmybA1 gene expression with anthocyanin production in grape (Vitis vinifera) skin-color mutants. J Jpn Soc Hortic Sci 2005, 74(3):196-203.
20. Fournier-Level A, Le Cunff L, Gomez C, Doligez A, Ageorges A, Roux C, Bertrand Y, Souquet JM, Cheynier V, This P: Quantitative genetic bases of anthocyanin variation in grape (Vitis vinifera L. ssp sativa) berry: a quantitative trait locus to quantitative trait nucleotide integrated study. Genetics 2009, 183(3):1127-1139.
21. This P, Lacombe T, Cadle-Davidson M, Owens CL: Wine grape (Vitis viniferaL.) color associates with allelic variation in the domestication gene VvmybA1. Theor Appl Genet 2007, 114(4):723-730.
22. Downey MO, Dokoozlian NK, Krstic MP: Cultural practice and environmental impacts on the flavonoid composition of grapes and wine: a review of recent research. Am J Enol Viticult 2006, 57(3):257-268. 23. Olle D, Guiraud JL, Souquet JM, Terrier N, Ageorges A, Cheynier V, Verries C:
Effect of pre- and post-veraison water deficit on proanthocyanidin and anthocyanin accumulation during Shiraz berry development. Aust J Grape Wine R 2011, 17(1):90-100.
24. Mazza G: Anthocyanins in grapes and grapes products. Crc Cr Rev Food Sc 1995, 35(4):341-371.
25. Pomar F, Novo M, Masa A: Varietal differences among the anthocyanin profiles of 50 red table grape cultivars studied by high performance liquid chromatography. J Chromatogr A 2005, 1094(1-2):34-41. 26. Mattivi F, Guzzon R, Vrhovsek U, Stefanini M, Velasco R: Metabolite
profiling of grape: flavonols and anthocyanins. J Agric Food Chem 2006, 54(20):7692-7702.
27. Roggero JP, Larice JL, Rocheville-Divorne C, Archier P, Coen S: Composition anthocyanique des cépages: essai de classification par analyse en composantes principales et par analyse factorielle discriminante. RFOE cahiers scientifiques 1988, 112:41-48.
28. Castellarin SD, Di Gaspero G, Marconi R, Nonis A, Peterlunger E, Paillard S, Adam-Blondon AF, Testolin R: Colour variation in red grapevines (Vitis vinifera L.): genomic organisation, expression of flavonoid 3’-hydroxylase, flavonoid 3’, 5’-hydroxylase genes and related metabolite profiling of red cyanidin-/blue delphinidin-based anthocyanins in berry skin. Bmc Genomics 2006, 7.
29. Jeong ST, Goto-Yamamoto N, Hashizume K, Esaka M: Expression of the flavonoid 3’-hydroxylase and flavonoid 3’, 5’-hydroxylase genes and flavonoid composition in grape (Vitis vinifera). Plant Sci 2006, 170(1):61-69. 30. Castellarin SD, Pfeiffer A, Sivilotti P, Degan M, Peterlunger E, Di Gaspero G:
Transcriptional regulation of anthocyanin biosynthesis in ripening fruits of grapevine under seasonal water deficit. Plant Cell Environ 2007, 30(11):1381-1399.
31. Jaillon O, Aury JM, Noel B, Policriti A, Clepet C, Casagrande A, Choisne N, Aubourg S, Vitulo N, Jubin C, et al: The grapevine genome sequence suggests ancestral hexaploidization in major angiosperm phyla. Nature 2007, 449(7161):463-U465.
32. Velasco R, Zharkikh A, Troggio M, Cartwright DA, Cestaro A, Pruss D, Pindo M, FitzGerald LM, Vezzulli S, Reid J, et al: A high quality draft consensus sequence of the genome of a heterozygous grapevine variety. Plos One 2007, 2(12):e1326.
33. Barnaud A, Lacombe T, Doligez A: Linkage disequilibrium in cultivated grapevine, Vitis vinifera L. Theor Appl Genet 2006, 112(4):708-716. 34. Kang HM, Zaitlen NA, Wade CM, Kirby A, Heckerman D, Daly MJ, Eskin E:
Efficient control of population structure in model organism association mapping. Genetics 2008, 178(3):1709-1723.
35. McMullen MD, Byrne PF, Snook ME, Wiseman BR, Lee EA, Widstrom NW, Coe EH: Quantitative trait loci and metabolic pathways. Proceedings of the National Academy of Sciences of the United States of America 1998, 95(5):1996-2000.
36. Chopra S, Cocciolone SM, Bushman S, Sangar V, McMullen MD, Peterson T: The maize unstable factor for orange1 is a dominant epigenetic modifier of a tissue specifically silent allele of pericarp color1. Genetics 2003, 163(3):1135-1146.
37. Gouesnard B, Bataillon TM, Decoux G, Rozale C, Schoen DJ, David JL: MSTRAT: An algorithm for building germ plasm core collections by maximizing allelic or phenotypic richness. J Hered 2001, 92(1):93-94. 38. Schoen DJ, Brown AHD: Conservation of Allelic Richness in Wild Crop
Relatives Is Aided by Assessment of Genetic-Markers. Proceedings of the National Academy of Sciences of the United States of America 1993, 90(22):10623-10627.
39. Boss PK, Davies C, Robinson SP: Analysis of the expression of anthocyanin pathway genes in developing Vitis vinifera L cv Shiraz grape berries and the implications for pathway regulation. Plant Physiol 1996,
111(4):1059-1066.
40. Castellarin SD, Di Gaspero G: Transcriptional control of anthocyanin biosynthetic genes in extreme phenotypes for berry pigmentation of naturally occurring grapevines. Bmc Plant Biol 2007, 7.
41. Des Marais DL, Rausher MD: Escape from adaptive conflict after duplication in an anthocyanin pathway gene. Nature 2008, 454(7205):762-U785.
42. Bailly C, Cormier F, Do CB: Characterization and activities of S-adenosyl-L-methionine:cyanidin 3-glucoside 3’-O-methyltransferase in relation to anthocyanin accumulation in Vitis vinifera cell suspension cultures. Plant Sci 1997, 122:81-89.
43. Wiering H, deVlaming P: Glycosylation and methylation patterns of anthocyanins in Petunia hybrida. II. The genes Mr1 and Mf2. Pflanzenzucht 1977, 78:113-123.
44. Lijavetzky D, Ruiz-Garcia L, Cabezas JA, De Andres MT, Bravo G, Ibanez A, Carreno J, Cabello F, Ibanez J, Martinez-Zapater JM: Molecular genetics of berry colour variation in table grape. Mol Genet Genomics 2006, 276(5):427-435.
45. Fournand D, Vicens A, Sidhoum L, Souquet JM, Moutounet M, Cheynier V: Accumulation and extractability of grape skin tannins and anthocyanins at different advanced physiological stages. J Agric Food Chem 2006, 54(19):7331-7338.
46. Le Cunff L, Fournier-Level A, Laucou V, Vezzulli S, Lacombe T, Adam-Blondon AF, Boursiquot JM, This P: Construction of nested genetic core collections to optimize the exploitation of natural diversity in Vitis vinifera L. subsp sativa. Bmc Plant Biol 2008, 8.
47. Fernandez L, Torregrosa L, Terrier N, Sreekantan L, Grimplet J, Davies C, Thomas MR, Romieu C, Ageorges A: Identification of genes associated with flesh morphogenesis during grapevine fruit development. Plant Mol Biol 2007, 63(3):307-323.
48. Grattapaglia D, Bertolucci FLG, Penchel R, Sederoff RR: Genetic mapping of quantitative trait loci controlling growth and wood quality traits in Eucalyptus grandis using a maternal half-sib family and RAPD markers. Genetics 1996, 144(3):1205-1214.
49. De Givry S, Bouchez M, Chabrier P, Milan D, Schiex T: CAR(H)(T)AGene: multipopulation integrated genetic and radiation hybrid mapping. Bioinformatics 2005, 21(8):1703-1704.
50. Van Ooijen JW: Accuracy of Mapping Quantitative Trait Loci in Autogamous Species. Theor Appl Genet 1992, 84(7-8):803-811. 51. Basten CJ, Weir BS, Zeng ZB: QTL cartographer.Edited by: Statistics Do.
North Carolina State University, Raleigh, N.C; 2001:.
52. Lacombe T, Boursiquot JM, Laucou V, Dechesne F, Vares D, This P: Relationships and genetic diversity within the accessions related to malvasia held in the Domaine de Vassal grape germplasm repository. Am J Enol Viticult 2007, 58(1):124-131.
doi:10.1186/1471-2229-11-179
Cite this article as: Fournier-Level et al.: Genetic mechanisms underlying the methylation level of anthocyanins in grape (Vitis vinifera L.). BMC Plant Biology 2011 11:179.
Submit your next manuscript to BioMed Central and take full advantage of:
• Convenient online submission
• Thorough peer review
• No space constraints or color figure charges
• Immediate publication on acceptance
• Inclusion in PubMed, CAS, Scopus and Google Scholar
• Research which is freely available for redistribution
Submit your manuscript at www.biomedcentral.com/submit