HAL Id: hal-02665865
https://hal.inrae.fr/hal-02665865
Submitted on 31 May 2020
HAL is a multi-disciplinary open access
archive for the deposit and dissemination of
sci-entific research documents, whether they are
pub-lished or not. The documents may come from
teaching and research institutions in France or
abroad, or from public or private research centers.
L’archive ouverte pluridisciplinaire HAL, est
destinée au dépôt et à la diffusion de documents
scientifiques de niveau recherche, publiés ou non,
émanant des établissements d’enseignement et de
recherche français ou étrangers, des laboratoires
publics ou privés.
Metapopulation Dynamics and Biological Invasions: A
Spatially Explicit Model Applied to a Freshwater Snail
Benoit Facon, Patrice David
To cite this version:
Benoit Facon, Patrice David. Metapopulation Dynamics and Biological Invasions: A Spatially Explicit
Model Applied to a Freshwater Snail. American Naturalist, University of Chicago Press, 2006, 168
(6), pp.769-783. �10.1086/508669�. �hal-02665865�
Metapopulation Dynamics and Biological Invasions: A Spatially
Explicit Model Applied to a Freshwater Snail
Benoıˆt Facon1,*and Patrice David2,†
1. Department of Ecology and Evolution, Biology Building, University of Lausanne, 1015 Lausanne, Switzerland;
2. Centre d’Ecologie Fonctionnelle et Evolutive, Centre National de la Recherche Scientifique, 1919 route de Mende, 34293 Montpellier Cedex, France
Submitted January 24, 2005; Accepted June 22, 2006; Electronically published October 18, 2006
Online enhancements: appendixes.
abstract: The spatial spread of invading organisms is a major contemporary concern. We focus here on invasions in inherently fragmented habitats, such as freshwater systems, and explore the usefulness of metapopulation models in this context. Maximum-likelihood methods allow the estimation of colonization and extinc-tion rates, as funcextinc-tions of habitat patch sizes and posiextinc-tions, from time series of presence/absence data. This framework also provides confidence intervals of these estimates and hypotheses tests. We an-alyze a previously unpublished 12-year survey of the spread of the introduced snail Tarebia granifera in 47 Martinican rivers. Simple metapopulation models reproduce with reasonable accuracy several quantitative aspects of the invasion, including regional abundance, spatiotemporal structure, and site-by-site colonization dates. Sensi-tivity analysis reveals that the invasion sequence depended strongly on metapopulation size (number of sites) and spatial structure (dis-tances among sites). The invasion history has also been accelerated by stochastic events, as illustrated by a large, central river that hap-pened to be colonized very early and served as an invasion pool. Finally, we discuss the benefits of this approach for the understanding of invasions in fragmented landscapes.
Keywords: fragmented habitats, geographic spread, biological
inva-sion, stochasticity, thiarid mollusks.
Predicting the spatial spread of introduced species has become a critical task for ecologists (Shigesada and
Ka-* Corresponding author; e-mail: [email protected].
† E-mail: [email protected].
Am. Nat. 2006. Vol. 168, pp. 769–783.䉷 2006 by The University of Chicago. 0003-0147/2006/16806-40861$15.00. All rights reserved.
wasaki 1997). Most current models are based on reaction-diffusion equations (Hastings 1996; Hastings et al. 2005), the use of which was initiated by Fisher (1937) and Skellam (1951). The simplest model, with exponential population growth, radially symmetrical spread into a uniform en-vironment, and asymptotically constant wave speed, pre-dicts that the square root of the occupied area increases linearly with time (Hastings 1996). Recent theoretical de-velopments have considered more realistic situations (re-view in Hastings et al. 2005), for example, including en-vironmental heterogeneity (Cantrell and Cosner 2001; Kinezaki et al. 2003). Integrodifference equation models have also been developed recently to examine the conse-quences of temporal variability in reproduction (Neubert and Caswell 2000) and fluctuating environments (Neubert et al. 2000) on invasion speed.
Empirical studies have usually not gone that far. Al-though the square root of the invaded area increases lin-early with time in some classical examples (Skellam 1951; Lubina and Levin 1988; Reeves and Usher 1989), real in-vasions often appear more complex, especially in hetero-geneous environments (Bossenbroeck et al. 2001; Hastings et al. 2005). In highly fragmented populations where dis-persal is affected by landscape patterns (Johnson et al. 1992; Bergelson et al. 1993; Gardner and Gustafson 2004), implementing spatial-diffusion models requires a detailed knowledge of spatial variation in dispersal rates and pop-ulation growth rate or habitat suitability (Cantrell and Cosner 2001; Kinezaki et al. 2003). In fragmented habitats, the spatial resolution of data is often limited to discrete patches of favorable habitat (e.g., forest fragments or water bodies), a level at which basic information on presence/ absence and connectivity may be relatively easy to collect. In this context, different approaches, such as gravity mod-els, have been developed to predict the spread of invasive species (Hastings et al. 2005). Gravity models, notably used to study the invasion of North American lakes and rivers by zebra mussels (Schneider et al. 1998; Bossenbroeck et al. 2001; Leung et al. 2004), estimate a force of attraction between an origin and a destination, with movement rates being a function of this force (Bossenbroeck et al. 2001).
770 The American Naturalist
Habitat fragmentation, when discrete patches of suitable habitat are separated by an unsuitable matrix, is also rep-resented in metapopulation models (Levins 1969; Higgins and Richardson 1996; Hanski 1999; Collingham and Hunt-ley 2000; for a review, see Hanski and Gaggiotti 2004). Many real invasions combine rapid within-patch dynam-ics, slow between-patch dynamdynam-ics, and intermediate con-nectivity between patches, so that population structure can be reduced to binary patch states (occupied or empty) without loss of crucial information. At a given time, not all favorable patches are actually occupied, and the pattern of occupancy depends on stochastic colonization and ex-tinction processes comparable to birth and death processes at the patch level. Such cases lend themselves to meta-population modeling. Metameta-population dynamics has been extensively studied with respect to equilibrium or quasi-stationary distributions and long-term probabilities of per-sistence (e.g., Foley 1994; Hanski 1999; Etienne and Hees-terbeek 2001; Hanski and Ovaskainen 2003). However, nonequilibrium stages of the metapopulation growth have seldom been described in detail (but see Hanski and Thomas 1994; Etienne and Nagelkerke 2002; Ovaskainen and Hanski 2002). Estimates of metapopulation parame-ters are typically based on snapshot data of presence and absence, assuming quasi equilibrium (Hanski 1994) and/ or on turnover data (review in Etienne et al. 2004).
The first aim of this article is to investigate whether the metapopulation framework can be used to adequately model the invasion dynamics in a fragmented landscape using temporal series typical of invasions. We first give a brief account of theoretical expectations of metapopula-tion models regarding invasion dynamics, using a sto-chastic model based on classical metapopulation theory (Hanski 1994; Hanski et al. 1996c). We then use a maximum-likelihood framework to estimate the meta-population model parameters, using real invasion data. This framework allows us to study the spread of the trop-ical freshwater snail Tarebia granifera into a naturally highly fragmented habitat (the rivers of the island of Mar-tinique), based on a previously unpublished 12-year ex-haustive survey of Martinique basins starting from the initial introduction event (1991). We first examine whether parameter estimates capture enough information in the data to explain the observed dynamics, both at the meta-population scale and on a site-by-site basis. The model is then used to determine the extent to which invasion speed depends on landscape features, such as the size distribution and spatial configuration of Martinique basins. Finally, the advantages of the metapopulation approach to investigate invasions are discussed.
Material and Methods
The Metapopulation Model
We consider a finite metapopulation of patches of favor-able habitat separated by a matrix of unfavorfavor-able habitat. Our model is a discrete-time, spatially explicit model in-spired by incidence function models (IFMs) derived by Hanski (1994).
The determinants of patch occupancy in metapopula-tion models are patch colonizametapopula-tion and extincmetapopula-tion rates. We model the probability of extinction of patch i as
Pr (i) p e exp (e ⫺bn ),i (1)
where e and b are the model parameters. The exponential
term modulates the effect of population size ni on
ex-tinction rate. The probability of colonization of patch i by propagules from patch j during one time step is
g
Pr p 1ij ⫺ exp [⫺cA n exp (⫺dd )],i j ij (2)
where c is a colonization parameter, Ai is the measured
size of patch i, dijis the distance between patches, and d
sets the migration range of the species. The exponential
term exp(⫺ddij) represents the probability of traveling
dis-tance dijfor a propagule under a Laplace dispersion kernel,
assuming homogeneous dispersion throughout the area (as traditionally used in the IFM; Hanski 1999).
The rationale behind equation (2) is as follows. Given
a recipient patch i with a fixed area of reception Ri, we
assume that each propagule from patch j has a fixed, and
small, probability of reaching i proportional to Riand to
the migration function exp (⫺dd )ij . Then the probability
f(i, j) of noncolonization, that is, that no propagule from j reaches i, satisfies
⭸f(i, j)
p⫺cf(i, j) exp (⫺dd )R . (3)
ij i
⭸nj
Symmetrically, given a fixed population size nj, we
as-sume that each small area ⭸Rj in the recipient patch has
a fixed probability of receiving a propagule from i
pro-portional to njand to exp(⫺ddij), so
⭸f(i, j)
p⫺cf(i, j) exp (⫺dd )n . (4)
ij j
⭸Ri
The area of reception of patch i is written as a power
function of its measured size,R p Ag, because measures
i i
of patch size are often only indirect indicators of their effective receiving area (e.g., maximum dimension instead
of area). With this assumption, and noting that Pr pij
, equation (2) satisfies conditions (3) and (4) as
well as the limit max (Pr ) p 1ij . Because most available
data sets do not provide estimates of population size nj
for each patch, it is usually approximated as
0 if empty,
n pj
{
Aa if occupied. (5)j
The power functionAa allows for an allometric
rela-j
tionship between measured patch size and population size. The exponent a is not constrained to equal g because we do not assume a priori that patch carrying capacity is exactly proportional to its area of reception. Equation (5) implicitly assumes that within-patch dynamics is fast com-pared to metapopulation dynamics. Otherwise, metapop-ulation invasion will be slower because the first patches take some time to fill up. In simulated dynamics, this delay is detectable only in the unlikely case when reaching car-rying capacity within a patch takes much longer than the next colonization event.
Equation (2) differs slightly from the colonization func-tion of the IFM. Both models incorporate the effects of distance and of the size of the source patch. However, con-trary to our model, colonization did not depend on the size of the recipient patch in the original IFM (Hanski et al. 1996c). This assumption had little consequence when fitting snapshot data because quasi-stationary patch occupancy de-pends only on the colonization-to-extinction ratio. Because extinction was already a power function of patch size in the IFM, another power function for colonization could not be estimated independently. In contrast, when fitting a dy-namic sequence of colonizations and extinctions, recipient patch size matters, and it was included in later versions of the IFM (Moilanen and Nieminen 2002).
In addition, a saturating function to constrain coloni-zation probabilities below 1 is used in the IFM (eq. [3a] in Hanski et al. 1996c). In our model, this is not needed because equation (2) is intrinsically constrained within [0, 1]. This property also motivates our choice of an expo-nential (eq. [1]) rather than a power function (Hanski et al. 1996c) to model extinction rates.
The properties of our model with regard to invasion dynamics can be investigated with analytical and simu-lation approaches (app. A in the online edition of the
American Naturalist). In summary, the model has four
properties. (1) The general form of metapopulation growth is logistic because the dynamics depends on the product of the numbers of empty and occupied patches. (2) Stochasticity is observed in both the probability and the time needed for the metapopulation to reach a given number of occupied patches. Analytical approximations for these quantities can be obtained for simple cases
(a p b p g p 0; app. A). Invasions become more
cer-tain and less variable when the total number of patches
is large and when the colonization rate is much greater than the extinction rate. Most of the extinction risks and variance in invasion times are generated during the initial steps of invasion dynamics. (3) Variation in patch size positively influences invasion success and speed, because it introduces a positive correlation between immigration and emigration rates (large patches are colonized easily and produce many propagules) as well as a negative cor-relation between extinction and colonization (large patches are easy to colonize but protected from extinction). (4) Because of the distance effect, the expected time at which a patch is colonized depends on its distance from the introduction point. The first three properties are basic components of classic metapopulation models, and the fourth applies to spatially explicit ones. In the remaining sections of the article, we assess their relative importance in explaining actual invasion patterns in fragmented hab-itats. This task requires the use of appropriate estimation procedures for nonstationary temporal series typical of invasions.
Application to Real Data Sets
Various statistical methods can be used to parameterize stochastic patch occupancy models using field data (Etienne et al. 2004). Most rely on maximum-likelihood or Bayesian methods and use snapshot data (assuming quasi equilibrium), turnover data, or both. The specificity of invasions is such that quasi equilibrium cannot be as-sumed, so that only turnover data are reliable. Such data usually consist of time series of population censuses (or presence/absence) of the invasive species in a metapop-ulation monitored at regular intervals (e.g., yearly). Esti-mates or reasonable surrogates of patch sizes, such as di-ameters or areas, are also needed in order to test their effects. We used the maximum-likelihood regression on turnover data described by Etienne et al. (2004, pp. 114– 115), except that likelihood functions have been changed according to our equations (1)–(5). Patches are considered empty (state 0, species absent or too rare to be detected) or occupied (state 1, species detected). During the time
interval [t, t⫹ 1], each patch can be allocated to one of
four transitions: newly occupied (0 r 1), still empty (0 r 0), newly extinct (1 r 0), and still occupied (1 r 1). The
likelihood Li, t of the transition observed in site i during
the interval [t,t⫹ 1], given the initial state of the patch,
can be derived from the colonization and extinction prob-abilities (eqq. [1]–[5]) as
772 The American Naturalist
L (c, e, a, b, g, d) pi, t g
1⫺ exp [⫺cAi
冘
n exp (j ⫺dd )] if newly occupied,ijj(i
exp [⫺cAg冘
n exp (⫺dd )] if still empty,i j ij
j(i (6)
e exp (⫺bn )i if newly extinct,
1⫺ e exp (⫺bn ) if still occupied. i
The overall log likelihood is the sum of all log likelihoods across patches and time intervals, assuming independent transitions:
log L(c, e, a, b, g, d) p
冘冘
log L (c, e, a, b, g, d).i, t (7)t i
The vector (ˆ ˆc, e, a, g, b, dˆ ˆ ˆ ˆ) of parameters maximizing
the log likelihood cannot be obtained analytically. How-ever, log L can be maximized numerically. Confidence in-tervals and hypothesis tests are obtained using standard likelihood ratios and model simplification procedures (McCullagh and Nelder 1989; Hilborn and Mangel 1997).
Study System
This framework was applied to the invasion of Martinique (Lesser Antilles) by the freshwater snail Tarebia granifera. A number of tropical aquatic snails of the Thiaridae family have invaded most of the Neotropics (from Florida and Texas to Argentina) and the Pacific area during the second half of the twentieth century (Murray 1971; Pointier 1999). These snails consume periphyton and/or deposited organic matter. They are parthenogenetic, viviparous, and well adapted to productive downstream parts of tropical rivers, including polluted canals and sewers in urban environ-ments. They often reach spectacular densities in invaded
areas (up to 104 m⫺2; Pointier et al. 1998; B. Facon,
per-sonal observation). They have important effects ranging from positive ones on human health (competitive exclu-sion of schistosome-transmitting snails Biomphalaria
gla-brata; Pointier 1999) to negative ones on biodiversity
(ex-clusion of various species; Quintana et al. 2000; Pointier 2001). Their dispersal vectors are thought to be aquarium plants for long-range introduction (Madsen and Frandsen 1989) and birds, cars, or cattle for local dispersal among watersheds (Maguire 1963). As for other invasive fresh-water mollusks, such as Dreissena polymorpha (Ricciardi et al. 1995), T. granifera can resist long periods of desic-cation (on average, 6 days; Facon et al. 2004), which may facilitate dispersal among watersheds.
Tarebia granifera, of southeast Asian origin, is one of
the most invasive thiarid species. It was first detected in the 1940s in North America and later was found in various
places in the Neotropics (Pointier 1999). Its spread has been thoroughly monitored in Martinique since its first mention in 1991 (Pointier et al. 1998). Our data set relies on an annual survey of presence/absence at 110 sites dis-tributed in the 47 permanent watersheds of the island from 1991 to 2002. A watershed was considered to be occupied when at least one of its sites was occupied. We surveyed several sites in larger watersheds to standardize the sam-pling effort per unit size, and hence the detection thresh-olds, among watersheds. Characteristics of the watersheds (location, size, and colonization date) are given in figure 1A and table 1. Tarebia granifera was present in one wa-tershed in 1991 and in 33 in 2002. Wawa-tershed sizes were estimated on a map (1 : 25,000-scale map from the French National Geographic Institute) as the length in kilometers of the main river and all its tributaries from sea level up to an altitude of 300 m, above which river slopes, water velocity, and low productivity make the habitat unsuitable for thiarids. Watershed sizes have been scaled, dividing them by the average size (7.28 km), which is more con-venient for numerical estimation. All portions where water is not permanent were excluded. The geographic position of watersheds corresponds to the longitude and latitude coordinates of the main site of each watershed (i.e., the lowest-altitude suitable site).
Model Selection and Parameterization. We applied our
maximum-likelihood method to estimate metapopulation parameters. No population extinction was observed over the survey period (1991–2002). The data set therefore does not allow discrimination between an extinction rate of
exactly zero (e p 0) and a very low extinction rate.
Pre-dictions would be very similar in these two cases, so for
convenience we hereafter consider thate p 0. The
appli-cation of our metapopulation model to the invasion of Martinique by T. granifera therefore corresponds to a col-onization model. Other parameters (c, a, g, and d) were numerically estimated by maximizing likelihood using a steepest-ascent algorithm implemented in Mathematica (Wolfram 1991). Because this algorithm can be trapped on local maxima, the consistency of the results was checked by running it from various initial values. A series of nested models was fitted, starting with the four parameters c, a, g, and d (model 1). Simplified models included various combinations of hypothetical constraints such as produc-tion and recepproduc-tion of propagules equally affected by
mea-sured patch size (a p g; model 2) and production and
reception of propagules constrained to be proportional to
measured patch size (a p g p 1; model 3) or
indepen-dent of patch size (a p g p 0; model 4). We also fitted
the same four models but with no effect of spatial position
of patches (d p 0; models 5–8). Likelihood ratios were
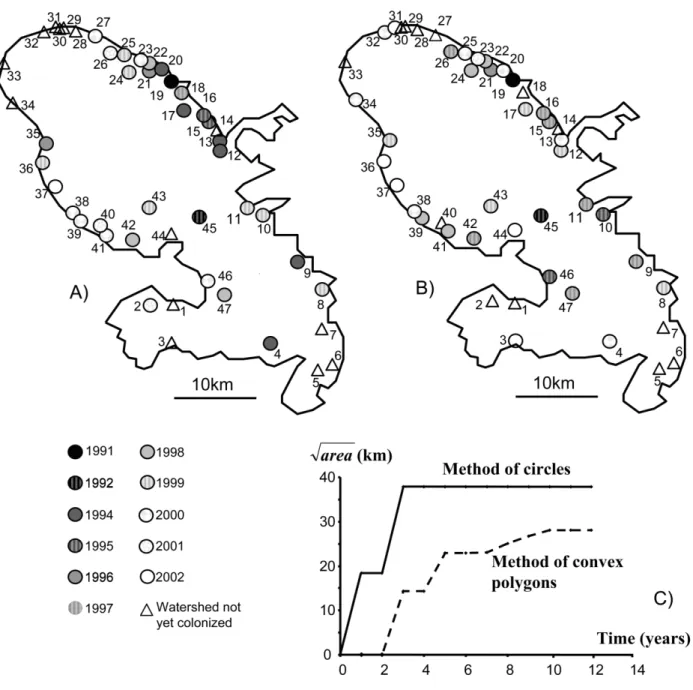
mod-Figure 1:A, Map of Martinique (Lesser Antilles) illustrating the locations of the 47 watersheds in Martinique and the time at which each site was colonized. The first occupied site is in black, and the following ones go from black to white in a grayscale variation. Finally, the sites not yet occupied are represented by triangles. B, Map representing the predicted date of colonization for each site generated from a single realization of model 2. C, Increase of the square root of area occupied by Tarebia granifera with time for area estimated by the methods of circles (solid line) and convex polygons (dashed line). These data were first used to check the main prediction of diffusion models: the square root of the area invaded by T. granifera should increase linearly with time. To achieve this, we used two different methods of interpolation. We first estimated the occupied area each year as that of the smallest circle centered on the first colonized site and including all other occupied sites (circles method). Second, we considered that the occupied area was that of the smallest convex polygon including all the occupied sites (convex polygon method).
els, and confidence intervals were obtained using the profile-likelihood method (McCullagh and Nelder 1989; Hilborn and Mangel 1997). In addition to these estima-tions of parameters based on the entire survey period (1991–2002), we also estimated metapopulation
parame-ters using only the first years (3, 4, 5, or 6 years) to test the predictive power of our approach.
Model Validation. We compared the original data to results
774 The American Naturalist
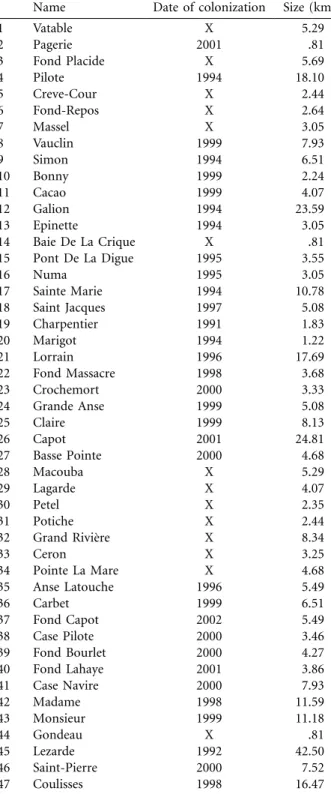
Table 1: Date of colonization and size of the 47 watersheds, numbered counterclockwise around the island, as in figure 1
Name Date of colonization Size (km)
1 Vatable X 5.29 2 Pagerie 2001 .81 3 Fond Placide X 5.69 4 Pilote 1994 18.10 5 Creve-Cour X 2.44 6 Fond-Repos X 2.64 7 Massel X 3.05 8 Vauclin 1999 7.93 9 Simon 1994 6.51 10 Bonny 1999 2.24 11 Cacao 1999 4.07 12 Galion 1994 23.59 13 Epinette 1994 3.05 14 Baie De La Crique X .81 15 Pont De La Digue 1995 3.55 16 Numa 1995 3.05 17 Sainte Marie 1994 10.78 18 Saint Jacques 1997 5.08 19 Charpentier 1991 1.83 20 Marigot 1994 1.22 21 Lorrain 1996 17.69 22 Fond Massacre 1998 3.68 23 Crochemort 2000 3.33 24 Grande Anse 1999 5.08 25 Claire 1999 8.13 26 Capot 2001 24.81 27 Basse Pointe 2000 4.68 28 Macouba X 5.29 29 Lagarde X 4.07 30 Petel X 2.35 31 Potiche X 2.44 32 Grand Rivie`re X 8.34 33 Ceron X 3.25 34 Pointe La Mare X 4.68 35 Anse Latouche 1996 5.49 36 Carbet 1999 6.51 37 Fond Capot 2002 5.49 38 Case Pilote 2000 3.46 39 Fond Bourlet 2000 4.27 40 Fond Lahaye 2001 3.86 41 Case Navire 2000 7.93 42 Madame 1998 11.59 43 Monsieur 1999 11.18 44 Gondeau X .81 45 Lezarde 1992 42.50 46 Saint-Pierre 2000 7.52 47 Coulisses 1998 16.47
Note: “X” indicates watersheds not yet colonized in 2002.
with respect to three important characteristics. The first is the regional abundance, that is, the dynamics of the proportion of occupied habitat in the whole metapopu-lation. The second is the spatiotemporal structure of the
invasion, that is, the geometry of the metapopulation in-vasion over the whole temporal series. The third corre-sponds to the site-by-site description of the invasion. To describe the spatiotemporal structure of the invasion, we applied classical spatial autocorrelation techniques (Cliff and Ord 1981) to the variable “date of first appearance in a watershed,” considering all 47 watersheds. Those wa-tersheds that were not yet colonized at the end of the data set (first appearance later than 12 years after introduction in Martinique) were given the value 13 years. This pro-cedure is conservative because it minimizes contrasts be-tween invaded and noninvaded sites. Because the distri-bution of noninvaded sites is expected to be aggregated, giving them a value greater than 13 years would increase the mean and variance of autocorrelation statistics. Spatial autocorrelograms were constructed based on Moran’s I statistic (Moran 1950) with 10-km distance classes. The last two classes (40–50 and 50–60 km) were pooled in order to avoid small sample sizes. Nonparametric per-mutation tests based on 1,000 random perper-mutations of watershed coordinates were used to provide a robust as-sessment of the significance of observed values (Good 1993). For the site-by-site description of the invasion, we estimated the mean predicted date of colonization for each site from simulations based on various models and compared it to the observed date. The deviances
(
冘
2) or the mean errors (i.e., the[expected⫺ observed]
square root of the deviances divided by the number of observations) characterize the lack of fit of the models.
Sensitivity Analysis. Several authors underlined the
diffi-culties of identifying incipient invasions because detecting a species present at low densities is often challenging (e.g., Fagan et al. 2002). Tarebia granifera was first recorded in the Charpentier basin (1991; no. 19 in table 1); then, 1 year later, in the Lezarde basin (no. 45), the largest on Martinique. Given the stochasticity inherent in initial steps of metapopulation invasion and the possibility that the presence of T. granifera remained unnoticed for 1 year in the Lezarde basin, we chose to initialize the simulations from two different initial conditions: 1991 with one site (Charpentier) colonized and 1992 with two sites (Char-pentier and Lezarde) colonized. Once the best model was identified, the roles of landscape structure (e.g., number of sites or location of the introduction sites) and model parameters (e.g., colonization rate, patch size, or distance effect) were investigated through sensitivity analysis. We ran simulations starting with the set of parameters of the best model and altering one parameter or characteristic of the metapopulation at a time. Simulations were thus run
assuming a halved colonization rate (model 9, c p c/2ˆ ),
a halved effect of distance on immigration and emigration
mean size of the actual metapopulation, model 11), that the first two sites colonized were in the north of the island (nos. 31 and 32, model 12), and that the metapopulation had half the actual number of sites (model 13). For the last, in order to avoid any effect due to the characteristics of the sites kept in the metapopulation, we built 10 halved metapopulations using randomly sampled sites, simulated the dynamics of invasion, and computed the average. All simulations were performed using a program written in Delphi implementing equations (1)–(3) in discrete time and incorporating the measured sizes and distance matrix of Martinican watersheds (app. A).
Results
The sequence of colonization of Martinique by Tarebia
granifera is given in table 1 and figures 1A and 2. The
number of sites occupied increased very rapidly, reaching approximately two-thirds of the basins in 2002 and show-ing no apparent saturation (fig. 2). However, the frag-mented nature of the habitat and the lack of contiguity in occupied sites make it impractical to map the progress of an invasion front, as is usually done. When the distribution area was represented by circles or polygons drawn around observed records, this area stopped growing 3–5 years after the first record of T. granifera, while new watersheds were still being colonized (fig. 1). Pilote River (no. 4), the col-onized site most distant from the source population Char-pentier (no. 19), was reached in the third year, while many closer sites were still vacant (all dates later than 1994 in table 1). The data set is, however, not devoid of spatial structure. A strongly significant U-shaped autocorrelo-gram is observed for colonization dates (fig. 3).
Model Selection and Parameterization
Table 2 gives estimates of invasion parameters in the meta-population model. According to the complete model (model 1 in table 2), the colonization rate of propagules from an occupied site j to empty site i is estimated as per year, where A is a
ba-0.49 0.71 ⫺0.182dij
1⫺ exp (⫺0.170A A ei j )
sin size in kilometers scaled by the average patch size (7.28
km) and dij is in kilometers. This formula gives a very
high colonization rate (0.13) for two average-sized sites separated by a small distance (1 km) and a steady decrease in colonization rate with distance (rate is approximately halved when distance increases by 4 km). Colonization rates for both emission and reception of propagules appear to be roughly proportional to the square root of basin size. The large confidence intervals (especially for a and g) suggest that the complete model is overparameterized. The
constraint a p g, that is, identical size dependence for
propagule emission and reception, does not significantly
reduce the likelihood (1 vs. 2 in table 2) or change the estimates, although this constraint strongly reduces the confidence interval on a. Model 2 should be preferred as being more parsimonious than model 1 (table 2) with an
equal fit. In contrast, the null hypothesesa p g p 0(no
size dependence, 2 vs. 4) and a p g p 1 (colonization
proportional to size, 2 vs. 3) significantly decrease the likelihood and should be rejected. The hypothesis of no
effect of distance (d p 0, 2 vs. 6) is also strongly rejected.
Model Validation
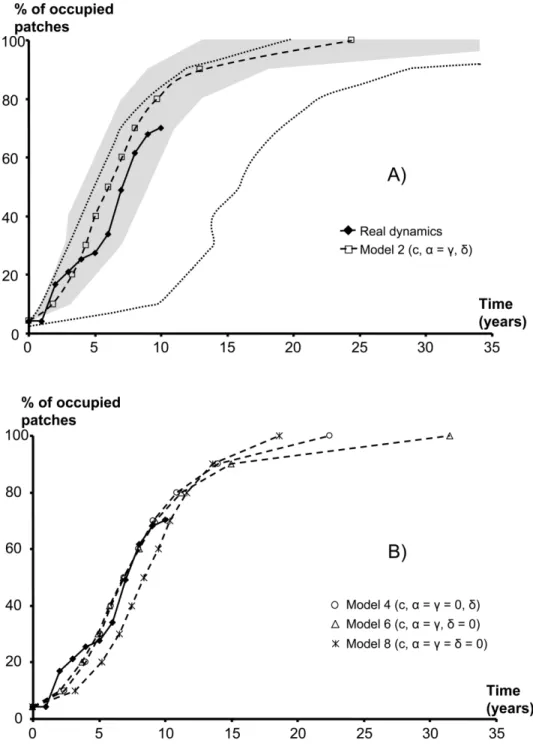
Figure 2 shows a comparison between observed invasion dynamics and simulations using the estimated parameters for different models. As mentioned above, most of the stochastic variance in invasion times builds up during the first steps. The simulations starting with only one site (Charpentier) initially occupied have extremely large con-fidence intervals because the time to the second coloni-zation and the identity of the site colonized vary among replicates. After the first steps, the predicted dynamics is quasi-deterministic until a large majority of patches are occupied. Variance again increases at the end of the vasion, when the dynamics slows down. Using 1992 in-stead of 1991 (two sites occupied, Charpentier [19] and Lezarde [45]) to initialize the simulations, the confidence intervals become much smaller (fig. 2). The mean of these simulations is very close to the real invasion sequence whatever the model used (fig. 2). Even as simple a model as model 8, with constant colonization rates, remains very close to the data.
Still, not all models are equivalent in reproducing the spatiotemporal structure of the data. Autocorrelograms based on simulated dynamics with no distance effect
(d p 0) are flat, while the inclusion of a distance effect
(d10) yields a U shape similar to that of data (fig. 3).
Moreover, the inclusion of both distance and size effects considerably improves the prediction of the date of col-onization for each site (table 3; fig. 1B).
Sensitivity Analysis
Restricting the data set used for estimation (3–6 years of data instead of 12) does not modify the estimate of a, but
c and d values tend to be lower than when the whole data
set is used, although confidence intervals strongly overlap (table B1 in the online edition of the American Naturalist). The changes in c and d partly compensate for each other, so that the predicted dynamics of regional abundance us-ing 4 or more years stays close to that predicted with the complete data set (fig. B1 in the online edition of the
Figure 2:A, Real invasion dynamics of Martinique by Tarebia granifera (diamonds) and mean simulated dynamics using the estimated parameters of model 2 (squares). The shaded zone contains 95% of the simulations (out of 3,000 simulations) for model 2 (c,a p g, d). The simulations have been done with two sites initially occupied. The zone delimited by dotted lines contains 95% of the simulations for model 2 but with one site initially occupied. B, Real invasion dynamics of Martinique by T. granifera (diamonds) and mean simulated dynamics using the estimated parameters of models 4 (circles), 6 (triangles), and 8 (crosses) with two sites initially occupied.
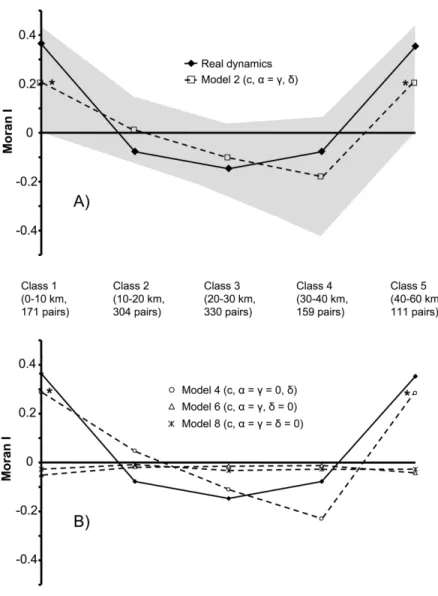
Figure 3:A, Autocorrelograms illustrating the spatial autocorrelation of the time of colonization between sites of the metapopulation. The real autocorrelogram is represented by diamonds, and the simulated autocorrelogram of model 2 is represented by empty squares. The shaded zone contains 95% of the simulations (out of 3,000 simulations) for model 2. The simulations have been done for two sites initially occupied (the same results were obtained with one site initially occupied). An asterisk indicates that the Moran’s I estimated from model 2 is significantly different from 0 (P!.01). The Moran’s I of classes 1 and 5 estimated from the data are also significantly different from 0 (P!.01). B, Autocorrelograms illustrating the spatial autocorrelation of the time of colonization between sites of the metapopulation. The real autocorrelogram is represented by diamonds, and the simulated autocorrelograms are represented by circles (model 4), triangles (model 6), and crosses (model 8). An asterisk indicates that the Moran’s I estimated from model 4 is significantly different from 0 (P!.01).
the invasion is weaker when restricted data sets are used but remains within the stochastic variation (fig. B1).
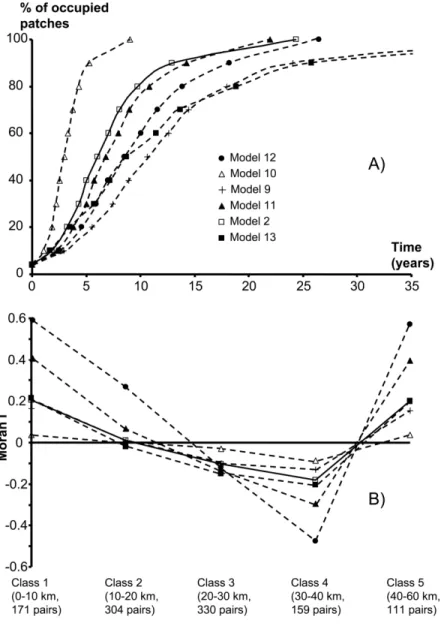
Figure 4A shows the sensitivity of regional abundance dynamics to the model parameters and landscape struc-ture. Invasion dynamics is slowed down when using a
lower colonization rate (c p c/2ˆ ), a smaller
metapopula-tion, or introduction sites far from the center (north of the island). On the contrary, using a lower decrease in
mi-gration rates with distance (d p d/2ˆ ) speeds up the
in-vasion dynamics. Finally, suppressing size variation among patches makes the invasion slightly slower.
Figure 4B shows the dependence of the spatiotemporal structure of the invasion on landscape structure and model parameters. The autocorrelogram of the invasion is nearly independent of the colonization rate and the number of available sites in the metapopulation. Stronger spatial au-tocorrelation is observed when all sites are given the same size and when starting with the two northern sites.
At-778 The American Naturalist
Table 2: Estimates of invasion parameters of Tarebia granifera in Martinique derived using maximum likelihood
Model, parameters ln L ˆc aˆ ˆg ˆd Test P
1 (c, d, a, g) ⫺90.001 .170 (.117, .238) .49 (⫺.06, .89) .71 (.34, 1.12) .182 (.160, .216) 2 (c, d, a p g) ⫺90.223 .157 (.108, .219) .63 (.31, .94) .182 (.152, .219) 1 vs. 2 NS 3 (c, d, a p g p 1) ⫺92.271 .117 (.081, .164) .176 (.147, .212) 2 vs. 3 .04 4 (c, d, a p g p 0) ⫺97.017 .095 (.065, .132) .147 (.120, .181) 2 vs. 4 .0002 5 (c, a, g, d p 0) ⫺100.563 .010 (.007, .013) .75 (⫺.94, 1.10) .81 (.36, 1.27) 1 vs. 5 4 # 10⫺6 6 (c, a p g, d p 0) ⫺100.571 .009 (.007, .013) .79 (.40, 1.07) 5 vs. 6 NS 6 (c, a p g, d p 0) ⫺100.571 .009 (.007, .013) .79 (.40, 1.07) 2 vs. 6 5 # 10⫺6 7 (c, a p g p 1, d p 0) ⫺101.160 .008 (.006, .013) 6 vs. 7 NS 8 (c, a p g p d p 0) ⫺107.322 .009 (.006, .013) 7 vs. 8 .0004
Note: Log likelihoods (ln L) and parameter estimates with 95% confidence intervals (in parentheses) are given for each model. Models were compared on the basis of likelihood ratio tests. P values were obtained by comparing the difference in deviance (⫺2 ln L) with the x2with 1 df
(Hilborn and Mangel 1997),NS p notsignificant.
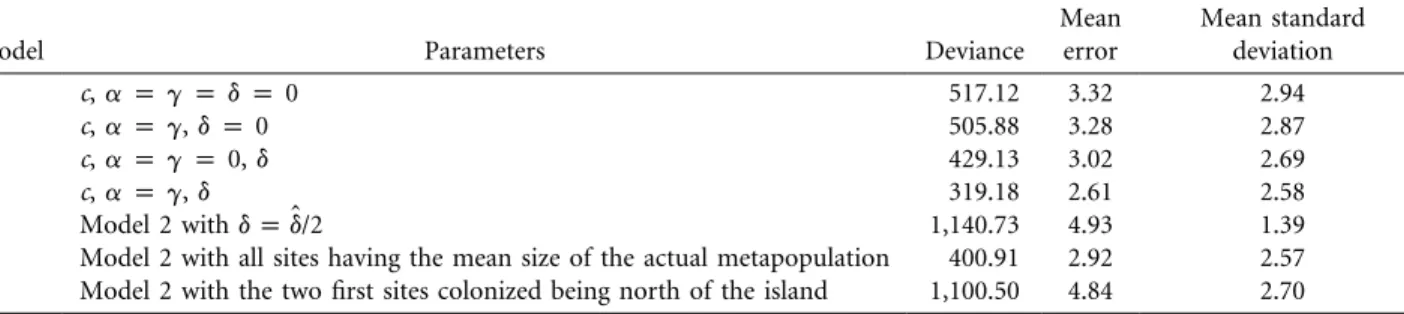
Table 3: Comparisons between actual site colonization times and those predicted by models
Model Parameters Deviance
Mean error Mean standard deviation 8 c, a p g p d p 0 517.12 3.32 2.94 6 c, a p g, d p 0 505.88 3.28 2.87 4 c, a p g p 0, d 429.13 3.02 2.69 2 c, a p g, d 319.18 2.61 2.58 10 Model 2 withd p d/2ˆ 1,140.73 4.93 1.39
11 Model 2 with all sites having the mean size of the actual metapopulation 400.91 2.92 2.57 12 Model 2 with the two first sites colonized being north of the island 1,100.50 4.84 2.70
Note: Deviances correspond to the sum of the squares of the differences between real times and estimated times, and mean errors correspond to the square root of the deviances divided by the number of observations. Note that the sites not yet colonized after 12 years have been given an arbitrary time of colonization of 13 years. We also indicate for each model the mean standard deviation of the colonization time of sites (over 1,000 simulations).
tenuating the effect of distance yields a flatter autocor-relogram.
The influence of landscape structure and model param-eters on the ability of the model to predict the site-by-site colonization dates is estimated through mean errors (table 3). The strongest error is made by attenuating the distance effect or using the northern sites as introduction point. Variation in patch size only weakly perturbs the predic-tions. Deviances were not computed in two cases. The first is for a halved number of sites, because the obtained data sets are not directly comparable to the complete data set (they do not contain the same sites). The second is for a halved colonization rate. Colonization is then so slow that most sites are colonized well after 12 years (fig. 4A) and differences with actual dates are much more constrained by the necessary cut at year 13 than in any other model.
Discussion
Anatomy of a Real Invasion: Tarebia
granifera in Martinique
Tarebia granifera has invaded Martinique extremely
rap-idly, colonizing most of the main watersheds within 12 years. This species is now the dominant gastropod in Mar-tinique. Central and large sites were colonized first, such
as the Lezarde basin in the second year and the Galion and Pilote rivers in the fourth year. In 2002, most of the rivers not yet colonized were small and located at the northern or southern end of the island (fig. 2). Figure 2 seems at first compatible with a regular spread abruptly stopped by the coastline. But the actual distribution of T.
granifera is highly discontinuous. The radius of the
small-est circle including all colonized sites reached its maximum after 3 years, when only 17% of the sites were occupied, indicating that invasion was still in progress. The discon-tinuity in occupied sites is not consistent with continuous dispersal. Still, the significant spatial autocorrelation in colonization dates reflects strong spatial structure. The ob-served U-shaped autocorrelogram suggests that coloni-zations are aggregated around the center of the distribu-tion. The effect of such an aggregation is that two sites tend to be colonized at around the same time if they are at approximately the same distance from the center. This yields high values of the Moran’s index at the right and left ends of the autocorrelogram and, hence, the U shape. For the invasion of the Martinique by T. granifera, an invasion front cannot be mapped by any interpolation method. Metapopulation models using discrete sites are better adapted and relatively easy to implement. In ad-dition, maximum likelihood provides standard methods
Figure 4:Results of the sensitivity analysis with respect to (A) the regional abundance, that is, the dynamics of the proportion of occupied habitat in the whole metapopulation, and (B) the spatiotemporal structure of the invasion. We made simulations starting with the set of parameters of model 2 (open squares) and altering one parameter or characteristic of the metapopulation at a time. Simulations were run assuming a halved colonization rate (model 9, plus signs), that the effect of distance on immigration and emigration is half the estimated one (model 10, open triangles), that all sites have the mean size of the actual metapopulation (model 11, filled triangles), that the first two sites colonized were north of the island (model 12, filled circles), and that the metapopulation has half the actual number of sites (model 13, filled squares).
to obtain confidence intervals and hypothesis tests, and simulations can retrospectively allow evaluation of the ability of the model to reproduce any particular aspect of the observed dynamics. In the T. granifera example, the main causes of rapid invasion are an exceptionally high
mean colonization rate (c p 0.170, which corresponds to
the colonization rate from an average-sized occupied patch to an average-sized empty patch at distance 0) and a lack of observed extinction. The best model with regard to our
three criteria (regional abundance, spatiotemporal struc-ture, and site-by-site colonization dates), as well as to sta-tistical significance (likelihood tests), also includes a de-pendence of colonization rates on patch size and position. Our model agrees with the intuition that both emigra-tion and immigraemigra-tion are proporemigra-tional to site carrying capacity and would be represented by the same power
function of metric patch size (a p g). That the fitted
ca-780 The American Naturalist
pacities are not strictly proportional to river length, prob-ably because the upper parts of large rivers are less fa-vorable than the lower, productive ones. In addition to patch size effects, a highly significant effect of distance indicates that distant sites are less likely to be colonized. The colonization rate of T. granifera between two sites is roughly halved every 4 km. Many well-documented studies have similarly suggested an effect of distance on coloni-zation rates (Havel et al. 2002; Jules et al. 2002) or have underlined the effect of patch isolation on metapopulation persistence (e.g., Thomas et al. 1992; Hanski et al. 1995) in other species.
Relative Importance of Landscape Structure and Model Parameters
The simplest mean-field approximation (constant colo-nization rate) is sufficient to account for the overall dy-namics, in terms of increase in regional abundance (fig. 2). Size-dependent variation in rates of emission and re-ception of propagules is expected to moderately increase the speed of the invasion, as it does for metapopulation persistence (Day and Possingham 1995; Hill et al. 1996). Large sites are then more rapidly colonized and act like invasion pools. This pattern has been detected in the in-vasion of North American freshwaters by zebra mussels (Schneider et al. 1998). In our data set, models with fitted size-independent colonization rates or where all patch sizes are set to the metapopulation mean predict regional abun-dances close to those of the best model. The “invasion pool” effect may therefore be quantitatively of limited im-portance. By contrast, starting the simulations after the colonization of the Lezarde basin (the largest one), al-though this took place 1 year after the first observation of
T. granifera in the island, does make a big difference. It
could be argued that this is due not to the Lezarde’s size but to its central location. However, in the absence of distance effect (model 6), we find that the invasion process is much slowed down starting from one site (i.e., without Lezarde) compared to two sites (it takes, respectively, 16.21 and 7.05 years for half the metapopulation to be colo-nized). On the contrary, in the absence of size dependence (model 8), the invasion process is only slightly slowed down starting from one site compared to two sites (8.46 vs. 6.79 years). So it seems that, mostly because of its large size, Lezarde has acted as an invasion pool, which implies that invasion dynamics has actually been influenced by size dependence. However, most of this influence took place very early and relied mostly on the size contrast between the Lezarde basin and all others.
Likelihood estimates show that migration is distance dependent. Sensitivity analysis reveals that site location plays a key role in determining invasion speed. Setting
, which is equivalent to dividing all distances by ˆ
d p d/2
2 in the landscape, yields faster invasions. The spatial con-figuration of sites therefore limits invasion speed, even at that small scale. A subsequent effect is that the introduc-tion site is important: had the introducintroduc-tion taken place in the two northernmost sites, the invasion would have been notably slower. Instead, the actual invasion started with two central sites able to send propagules toward both ends of the island.
A smaller number of available sites in the metapopu-lation is predicted to decrease the speed of invasion. Hav-ing a higher number of sites in the same area not only multiplies the opportunities of successful colonization but also decreases the average distance between two sites and increases the mean colonization rate. All this underlines the necessity to precisely map and estimate the amount of suitable habitat when attempting to predict invasion dynamics.
Some factors may prove important in determining the identity of colonized sites. This aspect was first investigated using spatiotemporal structure of the invasion. The spatial structure almost disappears when distance effects are at-tenuated. The importance of limited dispersal is confirmed by simulations where invasion starts in the north of the island. In this case, invasion mainly progresses in one di-rection. Thus, the spatial structure, as measured by au-tocorrelation statistics, is stronger than for the actual in-vasion. The suppression of the variability in patch size also reinforces the spatiotemporal autocorrelation pattern be-cause this variability adds noise to the relationship between colonization and distance. The colonization rate and the size of the metapopulation are pure scale effects that affect neither the relative distances between sites nor the spatio-temporal structure of the invasion. Deviance between pre-dicted and observed colonization dates (table 3) is in-creased mainly by underestimating the effect of limited dispersal or letting the invasion start in the north of the island.
In summary, a mean-field model may suffice to capture the overall dynamics of this invasion. But both the invasion speed and the order of sites colonized are strongly depen-dent on landscape patterns (spatial configuration of sites) and chance events (introduction point). Thus, the mean-field model is probably not exportable to invasions of other islands, while the models that account for local metapop-ulation characteristics could be so, provided that dispersal vectors and habitats are similar enough to those of Mar-tinique.
Effects of variation in patch size and isolation have been documented by a similar likelihood approach (the IFM) in other systems, the most famous example being the but-terfly Melitaea cinxia (Hanski et al. 1996c; Moilanen and Hanski 1998). In stationary metapopulations, snapshot
data are often used because they are easier to obtain than turnover data for a slight loss of information, because colonizations and extinctions are rare (Etienne et al. 2004). The situation is reversed in nonstationary temporal series typical of invasions, where all the information lies with the dynamics. Another feature typical of invasions is that colonizations exceed extinctions. In our case, no extinction was observed. It is precisely when extinction rates are much lower than colonization rates that quasi-stationary distributions are useless (because essentially all sites are expected to be occupied) and invasion dynamics are informative.
Usefulness in Forecasting Invasions
The aim of modeling invasions is twofold: first, to provide a good understanding of the mechanisms underlying the invasion process, and second, in a more applied perspec-tive, to give accurate predictions. For instance, in planning a response to an invasive species problem, it is crucial to predict the date at which a given site will be colonized (Schneider et al. 1998).
Our best model, with only three parameters estimated (colonization rate, patch size effect, and distance effect), is able to retrospectively estimate the date of arrival of T.
granifera in any site in Martinique with a typical error of
only 2.6 years, as soon as the two first colonized sites are known. Even with only the 4 first years of the data set, colonization dynamics can be correctly predicted (typical error of 3.1 years). The error may seem relatively large, given that the whole invasion took less than 20 years. However, given the high intrinsic stochasticity of invasions in metapopulations, higher precision is unlikely to be reached (table 3). Predictions can be produced for future colonization events the same way that might be important in terms of conservation policy. Obviously, little can be done to stop T. granifera from invading all Martinican watersheds now, nor is this invasion considered an im-portant conservation issue. Martinique has a relatively poor freshwater fauna, and Tarebia mostly threatens other invasive thiarids. At least one of them (Melanoides
tu-berculata) is in the process of being competitively displaced
by T. granifera in many rivers (Pointier 2001). In other similar situations, for example in Cuba, continental Amer-ica, and many Pacific islands, endemic thiarids or related families of freshwater benthic prosobranchs are threatened by T. granifera invasions (e.g., Quintana et al. 2000). Our estimates, together with a description of position and size of local watersheds, can give at least a rough prospect of invasion dynamics in these places and be useful for con-servation purposes. The method itself can be used for any species as soon as a clear description of the landscape, in
terms of favorable patches, is possible and enough data are gathered.
Can Metapopulation Processes Help Understanding of General Patterns in Invasions?
Metapopulation models allow modeling of extreme spatial variation in carrying capacity using a simple, discrete rep-resentation of the invaded area (suitable/unsuitable patches) rather than a complete, continuous map. At a continental scale, the average density of suitable habitat or average carrying capacity might suffice, and patch limits need not be explicitly incorporated in invasion models. The main utility of metapopulation models therefore lies in modeling mesoscale processes, for example, the first stages of an invasion, when habitat heterogeneity (dis-tances among patches) is comparable in scale to the whole distribution area of the species. At this scale, spread is discontinuous and does not occur along an invasion front. Metapopulation models incorporate the fact that central, as well as peripheral, sites may be responsible for new colonizations (With 2001). This possibility results in ac-celerated expansion dynamics in the first steps of invasion instead of the linear spread expected from continuous dis-persion. Metapopulation models provide the opportunity to test whether accounting for habitat fragmentation is sufficient to reproduce the observed dynamics even when a simple monotonic intrinsic dispersal kernel is postulated. In the case of T. granifera, even assuming a purely ex-ponential kernel, metapopulation models provide a good fit.
Another advantage of metapopulation models, espe-cially when one is interested in early stages, is their ability to account for the stochasticity of the invasion process. Recent diffusion-based models include stochasticity, but they are still difficult to relate to the underlying data (Has-tings et al. 2005). Metapopulation models incorporate in-trinsic stochastic variation in a simple way. They produce simple analytical approximations for probabilities of suc-cess and for the variance in invasion times (eq. [A11] in the online edition of the American Naturalist) and offer the possibility of retrospectively simulating the invasion process and estimating its stochastic variance. Although this possibility has been exploited in order to infer the stochastic behavior of metapopulations in stationary dis-tribution (e.g., Hanski 1994; Hanski and Ovaskainen 2003), it has been relatively less explored in invasion con-text. Tarebia granifera provides an interesting illustration. Although the lack of local extinctions, as well as the high colonization rate, should limit stochasticity, the extremely large confidence intervals obtained when simulations are initialized right from the first colonization reveal consid-erable stochastic variance at this stage. Most of the variance
782 The American Naturalist
vanishes when the initial state includes two colonized sites instead of one, probably because the second colonization occurred in the largest watershed (the Lezarde basin), a large and stable source of propagules. As has recently been argued (Fagan et al. 2002), detecting invaders early enough may be very difficult because of their low densities. We cannot exclude that the presence of T. granifera in the Lezarde basin, the largest on Martinique, remained un-noticed for 1 year, despite an adequate coverage of this basin.
Few studies report the probabilities of success and/or variance in invasion times or the confidence intervals around estimated parameters (Hastings et al. 2005; see, however, Jules et al. 2002). A metapopulation framework, combined with maximum-likelihood estimation, makes it possible. One can then ask whether a particular feature of an observed invasion lies outside the range of stochastic variation and deserves special explanations. For example, very slow starts (the “establishment phase” sensu Shige-sada and Kawasaki 1997) have often been observed and have been explained by an Allee effect (Taylor et al. 2004), a genetic adjustment before a favorable genotype appears (Travis and Dytham 2002), or a failure to detect low-density populations (Shigesada and Kawasaki 1997). How-ever, it has never been shown that these slow starts are not simply expected by chance.
Although much work remains to be done theoretically and empirically, we hope that the present work opens up promising opportunities for future research on biological invasions. In particular, modeling the dynamics of inter-actions between invasive species and local species could provide a link between invasion theory and the available theory of coexistence in metapopulations (Tilman 1994; Doncaster et al. 2003).
Acknowledgments
We thank B. Delay, J.-P. Pointier, and S. Samadi for help in collecting data and I. Hanski, P. Jarne, I. Olivieri, N. Perrin, V. Ravigne´, and two anonymous reviewers for par-ticularly insightful comments on the manuscript. This work has been supported by grants from the French gov-ernment, Ministe`re de l’Environnement et du De´velop-pement Durable, through the Ecosyste`mes Tropicaux (ECOFOR) and Invabio (IFB) programs. B.F. was sup-ported by a PhD fellowship from the French Ministry for Research and Technology and a Lavoisier postdoctoral grant from the French Ministry of Foreign Relationships.
Literature Cited
Bergelson, J., J. A. Newman, and E. M. Floresroux. 1993. Rates of weed spread in spatially heterogeneous environments. Ecology 74: 999–1011.
Bossenbroeck, J. M., C. E. Kraft, and J. C. Nekola. 2001. Prediction of long-distance dispersal using gravity models: zebra mussel in-vasion of inland lakes. Ecological Applications 11:1778–1788. Cantrell, R. S., and C. Cosner. 2001. Spatial heterogeneity and critical
patch size: area effects via diffusion in closed environments. Jour-nal of Theoretical Biology 209:161–171.
Cliff, A. D., and J. K. Ord. 1981. Spatial processes: models and ap-plications. Pion, London.
Collingham, Y. C., and B. Huntley. 2000. Impacts of habitat frag-mentation and patch size upon migration rates. Ecological Ap-plications 10:131–144.
Day, J. R., and H. P. Possingham. 1995. A stochastic metapopulation model with variability in patch size and position. Theoretical Pop-ulation Biology 48:333–360.
Doncaster, C. P., G. E. Pound, and S. J. Cox. 2003. Dynamics of regional coexistence for more or less equal competitors. Journal of Animal Ecology 72:116–126.
Etienne, R. S., and J. A. P. Heesterbeek. 2001. Rules of thumb for conservation of metapopulations based on a stochastic winking-patch model. American Naturalist 158:389–407.
Etienne, R. S., and C. J. Nagelkerke. 2002. Non-equilibria in small metapopulations: comparing the deterministic Levins model with its stochastic counterpart. Journal of Theoretical Biology 219:463– 478.
Etienne, R. S., C. J. F. ter Braak, and C. C. Vos. 2004. Application of stochastic patch occupancy models to real metapopulations. Pages 105–132 in I. Hanski and O. E. Gaggiotti, eds. Ecology, genetics, and evolution of metapopulations. Elsevier, New York. Facon, B., E. Machline, J. P. Pointier, and P. David. 2004. Variation
in desiccation tolerance in freshwater snails and its consequences for invasion ability. Biological Invasions 6:283–293.
Fagan, W. F., M. A. Lewis, M. G. Neubert, and P. van den Driessche. 2002. Invasion theory and biological control. Ecology Letters 5: 148–157.
Fisher, R. A. 1937. The wave of advance of advantageous gene. Annals of Eugenics 7:255–369.
Foley, P. 1994. Predicting extinction times from environmental sto-chasticity and carrying capacity. Conservation Biology 8:124–137. Gardner, R. H., and E. J. Gustafson. 2004. Simulating dispersal of reintroduced species within heterogeneous landscapes. Ecological Modelling 171:339–358.
Good, P. 1993. Permutation tests: a practical guide to resampling methods for testing hypotheses. Springer, New York.
Hanski, I. 1994. A practical model of metapopulation dynamics. Journal of Animal Ecology 63:151–162.
———. 1999. Metapopulation ecology. Oxford University Press, New York.
Hanski, I., and O. E. Gaggiotti, eds. 2004. Ecology, genetics, and evolution of metapopulations. Elsevier, New York.
Hanski, I., and O. Ovaskainen. 2003. Metapopulation theory for fragmented landscapes. Theoretical Population Biology 64:119– 127.
Hanski, I., and C. D. Thomas. 1994. Metapopulation dynamics and conservation: a spatially explicit model applied to butterflies. Bi-ological Conservation 68:167–180.
Hanski, I., T. Pakkala, M. Kuussaari, and G. Lei. 1995. Metapopu-lation persistence of an endangered butterfly in a fragmented land-scapes. Oikos 72:21–28.
Hanski, I., A. Moilanen, T. Pakkala, and M. Kuussaari. 1996c. The quantitative incidence function model and persistence of an
en-dangered butterfly metapopulation. Conservation Biology 10:578– 590.
Hastings, A. 1996. Models of spatial spread: is the theory complete? Ecology 77:1675–1679.
Hastings, A., K. Cuddington, K. F. Davies, C. J. Dugaw, S. Elmendorf, A. Freestone, S. Harrison, et al. 2005. The spatial spread of in-vasions: new developments in theory and evidence. Ecology Letters 8:91–101.
Havel, J. E., J. B. Shurin, and J. R. Jones. 2002. Estimating dispersal from patterns of spread: spatial and local control of lake invasions. Ecology 83:3306–3318.
Higgins, S. I., and D. M. Richardson. 1996. A review of models of alien plant spread. Ecological Modelling 87:249–265.
Hilborn, R., and M. Mangel. 1997. The ecological detective: confronting models with data. Princeton University Press, Princeton, NJ. Hill, J. K., C. D. Thomas, and O. T. Lewis. 1996. Effects of habitat
patch size and isolation on dispersal by Hesperia comma butterflies: implications for metapopulation structure. Journal of Animal Ecology 65:725–735.
Johnson, A. R., B. T. Milne, and J. A. Wiens. 1992. Diffusion in fractal landscapes: simulations and experimental studies of tene-brionid beetle movements. Ecology 73:1968–1983.
Jules, E. S., M. J. Kauffman, W. D. Ritts, and A. L. Carroll. 2002. Spread of an invasive pathogen over a variable landscape: a non-native root rot on Port Orford cedar. Ecology 83:3167–3181. Kinezaki, N., K. Kawasaki, F. Takasu, and N. Shigesada. 2003.
Mod-eling biological invasions into periodically fragmented environ-ments. Theoretical Population and Biology 64:291–302. Leung, B., J. M. Drake, and D. M. Lodge. 2004. Predicting invasions:
propagule pressure and the gravity of Allee effects. Ecology 85: 1651–1660.
Levins, R. 1969. Some demographic and genetic consequences of environmental heterogeneity for biological control. Bulletin of the Entomological Society of America 15:237–240.
Lubina, J. A., and S. A. Levin. 1988. The spread of a reinvading species: range expansion in the California sea otter. American Nat-uralist 131:526–543.
Madsen, H., and F. Frandsen. 1989. The spread of freshwater snails including those of medical and veterinary importance. Acta Tro-pica 46:139–146.
Maguire, B., Jr. 1963. The passive dispersal of small aquatic organisms and their colonization of isolated bodies of water. Ecological Monographs 33:161–185.
McCullagh, P., and J. A. Nelder. 1989. Generalized linear models. Chapman & Hall, London.
Moilanen, A., and I. Hanski. 1998. Metapopulation dynamics: effects of habitat quality and landscape structure. Ecology 79:2503–2515. Moilanen, A., and M. Nieminen. 2002. Simple connectivity measures
in spatial ecology. Ecology 83:1131–1145.
Moran, P. A. P. 1950. Notes on continuous stochastic phenomena. Biometrika 37:17–23.
Murray, H. D. 1971. The introduction and spread of thiarids in the United States. Biologist 53:133–135.
Neubert, M. G., and H. Caswell. 2000. Demography and dispersal:
calculation and sensitivity analysis of invasion speed for structured populations. Ecology 81:1613–1628.
Neubert, M. G., M. Kot, and M. A. Lewis. 2000. Invasion speeds in fluctuating environments. Proceedings of the Royal Society B: Bi-ological Sciences 267:1603–1610.
Ovaskainen, O., and I. Hanski. 2002. Transient dynamics in meta-population response to perturbation. Theoretical Population Bi-ology 61:285–295.
Pointier, J. P. 1999. Invading freshwater gastropods: some conflicting aspects for public health. Malacologia 41:403–411.
———. 2001. Invading freshwater snails and biological control in Martinique Island, French West Indies. Memorias do Instituto Oswaldo Cruz 96:67–74.
Pointier, J. P., S. Samadi, P. Jarne, and B. Delay. 1998. Introduction and spread of Thiara granifera (Lamarck, 1822) into Martinique Island, French West Indies. Biodiversity and Conservation 7:1277– 1290.
Quintana, M. G., J. G. Peso, and D. C. Pe´rez. 2000. Alteracion del re´gimen fluvial y reemplazo de especies de Thiaridae en el embalse de Yacyreta (Argentine-Paraguay). Paper presented at the Sixth International Congress on Medical and Applied Malacology, Ha-vana, Sept. 4–8.
Reeves, S. A., and M. B. Usher. 1989. Application of a diffusion model to the spread of an invasive species: the coypu in Great Britain. Ecological Modelling 47:217–232.
Ricciardi, A., R. Serrouya, and F. G. Whoriskey. 1995. Aerial exposure tolerance of zebra and quagga mussels (Bivalvia: Dreissenidae): implications for overland dispersal. Canadian Journal of Fisheries and Aquatic Sciences 52:470–477.
Schneider, D. W., C. D. Ellis, and K. S. Cummings. 1998. A trans-portation model assessment of the risk to native mussel com-munities from zebra mussel spread. Conservation Biology 12:788– 800.
Shigesada, N., and K. Kawasaki. 1997. Biological invasions: theory and practice. Oxford University Press, Oxford.
Skellam, J. G. 1951. Random dispersal in theoretical populations. Biometrika 38:196–218.
Taylor, C. M., H. G. Davis, J. C. Civille, F. S. Grevstad, and A. Hastings. 2004. Consequences of an Allee effect in the invasion of a Pacific estuary by Spartina alterniflora. Ecology 85:3254–3266. Thomas, C. D., J. A. Thomas, and M. S. Warren. 1992. Distributions
of occupied and vacant butterfly habitats in fragmented landscapes. Oecologia (Berlin) 92:563–567.
Tilman, D. 1994. Competition and biodiversity in spatially structured habitats. Ecology 75:2–16.
Travis, J. M. J., and C. Dytham. 2002. Dispersal evolution during invasions. Evolutionary Ecology Research 4:1119–1129.
With, K. A. 2001. The landscape ecology of invasive spread. Con-servation Biology 16:1192–2003.
Wolfram, S. 1991. Mathematica: a system for doing mathematics by computer. Addison-Wesley, Paris.
Associate Editor: Benjamin M. Bolker Editor: Donald L. DeAngelis