HAL Id: ird-00204025
https://hal.ird.fr/ird-00204025
Submitted on 11 Jan 2008
HAL is a multi-disciplinary open access
archive for the deposit and dissemination of
sci-entific research documents, whether they are
pub-lished or not. The documents may come from
L’archive ouverte pluridisciplinaire HAL, est
destinée au dépôt et à la diffusion de documents
scientifiques de niveau recherche, publiés ou non,
émanant des établissements d’enseignement et de
Nuclear-DNA evidence that northeastern Atlantic
Mytilus trossulus mussels carry M. edulis genes
Philippe Borsa, Claire Daguin, Sophia Ramos Caetano, François Bonhomme
To cite this version:
Philippe Borsa, Claire Daguin, Sophia Ramos Caetano, François Bonhomme. Nuclear-DNA evidence
that northeastern Atlantic Mytilus trossulus mussels carry M. edulis genes. Journal of Molluscan
Studies, Oxford University Press (OUP), 1999, 65 (4), pp.504-507. �ird-00204025�
To be cited as:
Borsa P., Daguin C., Ramos Caetano S., Bonhomme F. 1999. - Nuclear-DNA evidence that northeastern Atlantic Mytilus trossulus mussels carry M. edulis genes. J. Mollus. Stud. 65, 504-507
Nuclear-DNA evidence that northeastern Atlantic Mytilus trossulus mussels carry M. edulis genes
Philippe Borsa1, Claire Daguin, Sofia Ramos Caetano, François Bonhomme
IRD and Laboratoire Génome et Populations, UPR CNRS 9060, Génétique des Populations marines, Station méditerranéenne de l'Environnement littoral, Quai de la Daurade, 34200 Sète, France
The northeastern (NE) Atlantic region harbours three Mytilus L. species that have been identified on the basis of both morphological and allozyme data.1,2 The blue mussel, M. edulis L. ranges from the White Sea to the Bay of Biscay.2,3 It is reportedly absent from the Baltic Sea.4,5 M. galloprovincialis Lmk. is the only Mytilus species reported south of the French-Spanish border in Biscay (that is on the Atlantic coast of the Iberian peninsula, in northwestern (NW) Africa and in the Mediterranean2,3,6-9). The range of M. galloprovincialis also extends northwards where it overlaps with that of M. edulis. The zone of overlap extends as far as the British Isles.1,10,11 M.
trossulus Gould is apparently confined to the Baltic Sea where it has
been identified on the basis of allozyme data.4,5,12
While variable rates of admixture and introgression characterise
Mytilus assemblages in the about 2000-km wide zone of contact between M. edulis and M. galloprovincialis,8,10,11 the Øresund region at the
entrance of the Baltic Sea is the place of a sharp transition between
M. edulis and M. trossulus, with a smooth North-to-South introgression
gradient at allozyme loci over a geographic distance of about 100 km.5 Twelve of the 22 enzyme loci that were used to characterise North Sea (Skagerrak-Kattegat) M. edulis and Baltic Sea M. trossulus were
strongly differentiated, 5 of which were nearly diagnostic between the two species.5
More recent, specific-polymerase chain reaction (PCR)
investigations of genetic variability at a nuclear locus encoding the mussel polyphenolic adhesive protein, Glu-5',13,14 showed that
individuals of smooth-shell Mytilus species could be characterised by private alleles, one each for M. galloprovincialis from the
Mediterranean and from California and for M. trossulus from the NE Pacific, and two for M. edulis from the NW Atlantic.14
Here we characterised Glu-5' allele polymorphism (Figure 1; Table
1) in Mytilus mussels from Gilleleje, Kattegat (56°08'N, 12°17'E); Sète, western Mediterranean (43°25'N, 03°44'E) and Gdansk, Baltic Sea (54°28'N, 18°34'E). Skagerrak or Kattegat samples have been used as
reference M. edulis in a number of allozyme5,12,15 and nuclear-DNA16 surveys of genetic variation; similarly, Sète samples have been used as reference M. galloprovincialis8,14,16,17; samples from the Bay of Gdansk in the Baltic Sea have been used as reference M. trossulus in mitochondrial (mt) DNA18 and anonymous nuclear DNA19 surveys. We analysed additional mussel samples collected from two locations in northern California [Bodega Bay (38°20'N, 123°03'W) and Hog Island (38°17'N, 123°01'W)], a region where M. trossulus and introduced, M.
galloprovincialis are known to co-occur and hybridise.20-22
Table 2 reports Glu-5’ genotype frequencies in all 5 samples of
the present study together with 3 reference samples from Ref. 14. Northeastern Atlantic M. edulis (sample Gilleleje) exhibited alleles characteristic of NW Atlantic M. edulis (sample Lewes, DE of Ref. 14) that is E at high frequency and E' at lower frequency. Mediterranean (Sète) M. galloprovincialis were characterised by allele G, but allele
E was also detected. This suggests possible secondary contact, perhaps
owing to the recent introduction to Sète of NE Atlantic M. edulis as spat attached to imported juvenile oysters, Crassostrea gigas
Thunberg. One sample from California (Bodega Bay) exhibited mostly M.
galloprovincialis alleles, but one individual was a GT heterozygote
indicating that M. galloprovincialis Glu-5' genes have introgressed into M. trossulus. The other Californian sample (Hog Island),
collected a few tens of km apart, consisted of a mixture of GG and TT homozygotes suggesting that pure M. galloprovincialis and pure M.
trossulus were sampled on Hog Island, but not their hybrids. These
results accord with previous reports on the geographic patchiness of the introgression of introduced M. galloprovincialis into native M.
trossulus in the NE Pacific.20-22 Allele T characteristic of NE
Pacific M. trossulus (sample Newport, OR of Ref. 14) was common in the Baltic Sea sample but surprisingly, alleles E and E' characteristic of NE and NW Atlantic M. edulis were also present at high frequency. This was not expected on the view that smooth-shell Mytilus species are genetically homogeneous across vast distances and clearly
differentiated from each other.1,2,12,15,20 The distribution of genotypes in sample Gdansk were in accordance with Hardy-Weinberg
expectations with an estimate of f (≡ Wright's Fis23) = 0.010, not significantly different from 0 as indicated by permutation tests.24 This result suggests strong introgression of M. edulis alleles into Gdansk M. trossulus at locus Glu-5’.
We assumed that geographic variation within M. trossulus is weak, but is this assumption correct? Actually, heterogeneity in allozyme frequencies and also significant differences in gene diversity were detected when making comparisons across M. trossulus samples from the Baltic Sea, the NW Atlantic and the NW Pacific, while allozyme
frequencies in a sample from Gdansk Bay18 were very close to other Baltic Sea samples5 (Table 3). Nevertheless, the important point here is that across-ocean genetic variation (as estimated using Nei's
Gst25) at locus Glu-5' by far exceeded that of allozymes (Table 3).
Two additional observations support the view that in contrast to other
M. trossulus populations, Baltic Sea Mytilus possess M. edulis
characters: PCR using specific primers for the actin gene mac-1 intron 116,17 yielded DNA fragments whose size is characteristic of M.
edulis, in the Gdansk sample but not in the Hog Island sample (our
unpublished data); Gdansk Bay and other Baltic Sea M. trossulus also possess mtDNA that is much more similar to NE Atlantic M. edulis mtDNA than to the mtDNA of NW Atlantic or NE Pacific M. trossulus.18,26,27
Thus, nuclear-DNA and possibly mtDNA markers reveal the presence of M. edulis genes in Gdansk Bay Mytilus, a result that was not
apparent from earlier allozyme studies.5,18,20 We can offer the
following tentative explanations for this finding. (1) We haphazardly sampled the progeny of M. edulis x M. trossulus crosses in Gdansk Bay. This supposes that M. edulis has been introduced to the Gdansk region where it has survived until reproduction and has introgressed M.
trossulus. Such successful cases of accidental or on-purpose
introduction of smooth-shell Mytilus spp. have been reported
elsewhere.20-22,28,29 We have not independently tested this hypothesis by using allozyme markers. However, this is challenged by the
following observations: while hybridisation of M. trossulus with introduced M. galloprovincialis has been documented in California (Ref. 20-22,28; present study) and in Japan,29 it is not clear whether
M. trossulus x M.edulis hybridisation naturally occurs in the NW
Atlantic30,31 or in the NE Pacific28; also, the narrowness of the Øresund hybrid zone between M. edulis and M. trossulus5 may well be explained by strong selection against hybrid genotypes; samples of individuals with M. edulis allozyme genotypes experimentally
transferred from the Skagerrak to the Baltic Sea underwent
catastrophic mortality32,33 showing that the extreme environment of the Baltic Sea is lethal to NE Atlantic M. edulis. (2) A second hypothesis is that the M. edulis / M. trossulus hybrid zone is more permeable to Glu-5', mac-1 or mtDNA than to allozyme, genes. As a corollary to this, the maintenance of a narrow hybrid zone at allozyme loci would be due to strong selection against the latter while other genes including Glu-5' and mtDNA would spread across the hybrid zone because they would be weakly counter-selected or not counter-selected. Selection against allozyme loci as a group, if it occurs, might well be enhanced by linkage since two (Est-D, Mpi), possibly three (adding
Gpi) of the 5 allozyme loci that show clearcut differences between
Skagerrak M. edulis and Baltic Sea M. trossulus5 belong to the same linkage group in NE Atlantic M. edulis.34 Differential introgression, which has been documented at nuclear loci in Mytilus spp. (Ref. 28; our unpublished data) points towards differential selection across loci. Assuming that the introgression in the Baltic Sea of M.
trossulus by M. edulis genes is recent, this situation offers a unique
opportunity to study the dynamics of selection in natural populations of Mytilus mussels.
Acknowledgements
We are grateful to Maciej Wolowicz, Michel Raymond and Will Borgeson for the provision of mussels from respectively, Gdansk Bay, Gilleleje and Bodega Bay; to Nicolas Bierne for comments; to Kevin Dawson for careful reading.
REFERENCES
1. KOEHN, R.K. 1991. Aquaculture, 94: 125-145. 2. SEED, R. 1992. Amer. Malacol. Bull., 9: 123-137.
3. SANJUAN, A., ZAPATA, C. & ALVAREZ, G. 1994. Mar. Ecol. Progr. Ser., 113: 131-146. 4. BULNHEIM, H.-P. & GOSLING, E. 1988. Helg. Meeresunters., 42: 113-129.
5. VÄINÖLÄ, R. & HVILSOM, M.M. 1991. Biol. J. Linn. Soc., 43: 127-148.
6. LUBET, P., PRUNUS, G., MASSON, M. & BUCAILLE, D. 1984. Bull. Soc. Zool. Fr., 104: 87-98.
7. QUESADA, H., ZAPATA, C. & ALVAREZ,G. 1995. Mar. Ecol. Progr. Ser., 116: 99-115. 8. COUSTAU, C., RENAUD, F. & DELAY, B. 1991. Mar. Biol., 111: 87-93.
9. COMESAÑA, A.S., POSADA, D. & SANJUAN, A. 1998. J. Exp. Mar. Biol. Ecol., 223: 271-283.
10. SKIBINSKI, D.O.F., BEARDMORE, J.A. & CROSS, T.F. 1983. Biol. J. Linn. Soc., 19: 137-183.
11. GARDNER, J.P.A. 1994. Arch. Hydrobiol., suppl. 99: 37-71.
12. VARVIO, S.-L., KOEHN, R.K. & VÄINÖLÄ, R. 1988. Mar. Biol., 98: 51-60.
13. INOUE, K., WAITE, J.H., MATSUOKA, M., ODO, S. & HARAYAMA, S. 1995. Biol. Bull.,
189: 370-375.
14. RAWSON, P.D., JOYNER, K.L., MEETZE, K. & HILBISH, T.J. 1996. Heredity, 77: 599-607.
15. MCDONALD, J.H., SEED, R. & KOEHN, R.K. 1991. Mar. Biol., 111: 323-333. 16. DAGUIN, C. & BORSA, P., 1999. J. Exp. Mar. Biol. Ecol., 235: 55-65.
17. OHRESSER, M., BORSA, P. & DELSERT, C. 1997. Mol. Mar. Biol. Biotechnol., 6: 123-130.
18. WENNE, R. & SKIBINSKI, D.O.F. 1994. Mar. Biol., 122: 619-624.
19. BEYNON, C.M. & SKIBINSKI, D.O.F. 1996. J. Exp. Mar. Biol. Ecol., 203: 1-10. 20. MCDONALD, J.H. & KOEHN, R.K. 1988. Mar. Biol., 99: 111-118.
21. RAWSON, P.D. & HILBISH, T.J. 1995. Mar. Biol., 124: 245-250.
22. SUCHANEK, T.H., GELLER, J.B., KREISER, B.R. & MITTON, J.B. 1997. Biol. Bull., 193: 187-194.
23. WEIR, B.S. & COCKERHAM, C.C. 1984. Evolution, 38: 1358-1370.
24. BELKHIR, K., BORSA, P., GOUDET, J., CHIKHI, L. & BONHOMME, F. 1996. GENETIX v. 3.0, logiciel sous WINDOWSTM pour la génétique des populations. Université
Montpellier 2, Montpellier.
25. NEI, M. 1987. Molecular evolutionary genetics. Sinauer Assoc., Sunderland. 26. RAWSON, P.D. & HILBISH, T.J. 1995. Mol. Biol. Evol., 12: 893-901.
28. HEATH, D.D., RAWSON, P.D. & HILBISH, T.J. 1995. Can. J. Fish. Aquat. Sci., 52: 2621-2627.
29. INOUE, K., ODO, S., NODA, T., NAKAO, S., TAKEYAMA, S., YAMAHA, E., YAMAZAKI, F. & HARAYAMA, S. 1997. Mar. Biol., 128: 91-95.
30. KOEHN, R.K., HALL, J.G., INNES, D.J & ZERA, A.J. 1984. Mar. Biol., 79:117-126. 31. BATES, J.A. & INNES, D.J. 1995. Mar. Biol., 124: 417-424.
32. JOHANNESSON, K., KAUTSKY, N. & TEDENGREN, M. 1990. Mar. Ecol. Progr. Ser., 59: 211-219.
33. VÄINÖLÄ, R. 1990. Mar. Ecol. Progr. Ser., 67: 305-308. 34. BEAUMONT, A.R. 1994. Heredity, 72: 557-562.
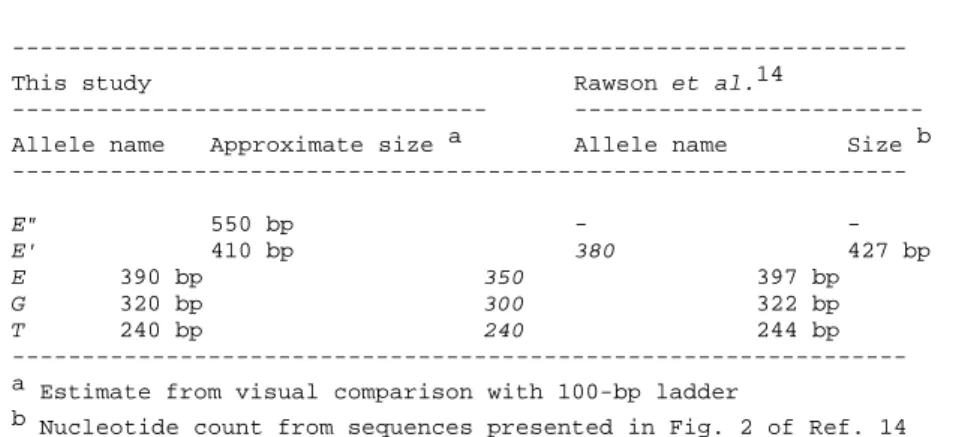
Table 1. Approximate sizes in base pairs (bp) of the 5 Glu-5' allelomorphs
in Mytilus spp. samples of the present study, and identification to alleles reported by Rawson et al.14 on the basis of the close correspondence
between Approximate size a and Size b.
--- This study Rawson et al.14
--- --- Allele name Approximate size a Allele name Size b --- E" 550 bp - - E' 410 bp 380 427 bp E 390 bp 350 397 bp G 320 bp 300 322 bp T 240 bp 240 244 bp --- a Estimate from visual comparison with 100-bp ladder
Table 2. Inferred genotype frequencies at locus Glu-5' in smooth-shell Mytilus spp.
samples from the northern hemisphere. N, sample size.
---
Inferred genotype
Sample (N) ---
E"E E'E' E'E EE EG E"T E'T ET GG GT TT
--- Gilleleje, Skagerrak (16) 0.06 0.25 0.44 0.25 - - - Sète, Mediterranean (39) - - - - 0.03 - - - 0.97 - - Gdansk, Baltic Sea (30) - - 0.03 0.20 - 0.03 0.17 0.37 - - 0.20 Bodega Bay, CA (23) - - - 0.96 0.04 - Hog island, CA (36) - - - 0.17 - 0.83 Lewes, DE a (25) - 0.08 0.16 0.76 - - - Sète, Mediterranean b (17) - - - 1.00 - - Newport, OR c (42) - - - 1.00 --- a, b, c Respectively, reference M. edulis, M. galloprovincialis and M. trossulus samples in Ref. 14
Table 3. Mytilus trossulus. Estimates of genetic diversity and genetic
differentiation (Gst25) at different geographic scales. Hs, within-subpopulation estimate of genetic diversity; SD, across-locus jackknife estimate of standard deviation.
---
Geographic scale,
Sample Source Hs ± SD Gst ± SD
--- Inter-oceanic (allozymes)a,b,c 0.060 ± 0.028 NE Pacific: Tillamook Ref. 20 0.544 ± 0.202
NE Atlantic: Tvärminne Ref. 20 0.295 ± 0.164 NW Atlantic: Group III Ref. 12 0.531 ± 0.120
Inter-oceanic (Glu-5') 0.266
NE Pacific: Newport Ref. 14 0.000 NE Atlantic: Gdansk present study 0.606
Baltic Sea (allozymes)a,d 0.005 ± 0.001 Ystad Ref. 5 0.385 ± 0.050
Gdansk Ref. 18 0.359 ± 0.051
--- a Five allozyme loci (Est-D, Gpi, Lap-2, Odh and Pgm) were taken into account because these were scored in all 4 source studies
b Est-D was not scored in sample Group III12
c To allow comparisons across studies, some poolings (+) of electromorphs were necessary. These were the following. Gpi: electromorphs 86 + 89 of Ref. 20 to compare with 91 of Ref. 12; Pgm: electromorphs 86 + 89 + 93 of Ref. 20 to compare with <96 of Ref. 12, and 108 +
111 of ref. 12 to compare with 111 of Ref. 20.
Figure 1. Allelomorph polymorphism at locus Glu-5’ in Mytilus spp.
of the NE Atlantic and inferred genotypes. Mussel DNA extracts were subjected to PCR in a Robocycler thermocycler (Stratagene, San Diego) according to protocols that were identical to those of Ref. 14 except that the annealing temperature here was set at 54°C
instead of 53°C. The PCR products were electrophoresed at 100 V for 2 hrs on ethidium-bromide stained 2.5% agarose gels and
photographed under ultraviolet light. The sizes of the PCR products were estimated approximately by visual comparison with the 100-bp ladder (L) of Pharmacia Biotech (Uppsala). Banding patterns were the same as formerly described (Figure 1a of Ref. 14). Glu-5' alleles were denominated as E, E’, E", G and T. We chose this new nomenclature to avoid confusion between allele name, approximate allele size and nucleotide count, when comparing the present study with Ref. 14 (see Table 1).