Differential introgression reveals candidate genes for selection across a spruce (Picea sitchensis 9 P. glauca) hybrid zone
Jill A. Hamilton1, Christian Lexer2and Sally N. Aitken1
1Centre for Forest Conservation Genetics and Department of Forest Sciences, University of British Columbia, Vancouver, BC, Canada;2Department of Biology, Unit of Ecology and Evolution, University of Fribourg, Fribourg, Switzerland
Author for correspondence:
Jill Hamilton Tel: +1 604 822 9102
Email: [email protected]
Key words: adaptation, ecological gradient, genomic cline, geographic cline, hybrid zone, selection, single nucleotide polymorphisms (SNPs), spruce.
Summary
Differential patterns of introgression between species across ecological gradients provide a fine-scale depiction of extrinsic and intrinsic factors that contribute to the maintenance of spe- cies barriers and adaptation across heterogeneous environments.
Introgression was examined for 721 individuals collected from the ecological transition zone spanning maritime to continental climates within thePicea sitchensis–Picea glaucacontact zone using a panel of 268 candidate gene single nucleotide polymorphisms.
Geographic clines showed a strong spatial relationship between allele frequencies and both distance from the ocean along major rivers and mean annual precipitation, indicating a strong role for environmental selection. Interspecific patterns of differentiation using outlier tests revealed three candidate genes that may be targets of long-term divergent selection between the parental species, although contemporary genomic clines within the hybrid zone suggested neutral patterns of introgression for these genes.
This study provides a fine-scale analysis of locus-specific introgression, identifying a suite of candidate loci that may be targets of extrinsic or intrinsic selection, with broad application in understanding local adaptation to climate.
Introduction
The genetic architecture of hybrid zones offers a unique opportu- nity to evaluate how gene flow and selection facilitate the spread of genetic material in a natural setting (Barton & Hewitt, 1985;
Rieseberg et al., 1999; Lexer et al., 2005, 2010). While much work has addressed broad-scale patterns of introgression between species, we are only beginning to resolve fine-scale patterns, iden- tifying both candidates within select regions of the genome con- tributing to the maintenance of species barriers and candidates for divergent selection (Strasburg et al., 2012). Heterogeneous patterns of introgression across the genome reveal those regions that may be under divergent selection and important to local adaptation. Such analyses provide a fine-scale depiction of geno- mic patterns influenced by extrinsic or intrinsic factors that con- tribute to the evolution and maintenance of species barriers (Wu, 2001; Gompertet al., 2012).
Incomplete barriers to reproduction may permit gene flow between species, although genetic exchange will be restricted if recombination is limited or there is strong selection against hybridization (Barton & Hewitt, 1985; Scotti-Saintagne et al., 2004; Kaneet al., 2009). Outside of these regions, however, both neutral and positively selected loci may move across the perme- able genome through hybridization and introgression (Kane et al., 2009). In contrast to the traditional whole-genome view of isolation advocated by the biological species concept, this
perspective identifies the gene as the unit of differentiation between species (Wu, 2001). Thus, locus-specific patterns of introgression across a porous genome can identify those regions that may be candidates for differentiation (Wu, 2001; Nosil &
Schluter, 2011).
Genome scans examining interspecific differentiation, along with analyses of introgression at both landscape and genome levels, have identified candidate regions important to the mainte- nance of species barriers in a number of hybrid zones (Scotti- Saintagneet al., 2004; Yatabeet al., 2007; Carling & Brumfield, 2009; Nolte et al., 2009; Lexer et al., 2010; Teeteret al., 2010;
Renault et al., 2012). Combining these approaches provides a powerful approach for identifying genomic regions between spe- cies that may be important for local adaptation or the mainte- nance of species barriers (Lexer et al., 2004; Payseur, 2010;
Gompertet al., 2012).
Differential patterns of introgression among loci indicate the spatial movement of alleles across the landscape, as well as move- ment of genetic material into varying genomic backgrounds (Gompert et al., 2012). Traditional cline analysis uses the changes in allele frequencies across the landscape to describe cline shape and estimate the strength of intrinsic and extrinsic (envi- ronmental) selection (Barton & Hewitt, 1985; Brennan et al., 2009; Payseur, 2010). More recently, novel admixture mapping techniques have facilitated analysis of introgression of individual genotypes against genome-wide average amounts of admixture
Published in "1HZ3K\WRORJLVW±"
which should be cited to refer to this work.
http://doc.rero.ch
(Buerkle & Lexer, 2008; Gompert & Buerkle, 2010; Payseur, 2010). Selection may promote introgression of select genes or genomic regions into new genetic backgrounds, or enhance barri- ers to gene flow resulting in differential patterns of introgression across the genome (Gompertet al., 2012).
While hybrid zone clines reflect broad, recent selection dynam- ics across the hybrid zone, patterns of interspecific differentiation as estimated by locus-specific FST are informative on a longer timescale (Whitlock, 1992; Lexer et al., 2010). The strength of selection is indicated by the extent to which gene flow counteracts the accumulation of differentiation over time (Whitlock, 2008).
These interspecific and intrahybrid zone patterns combined are complementary and informative at different timescales, providing greater power to detect segments of the genome that may be important in terms of adaptation and maintenance of species bar- riers (Bierneet al., 2011).
In tree species, where the creation of multiple generations of artificial crosses remains largely impractical because of long gen- eration times, natural hybrid zones provide a range of recombi- nants with which to examine introgression (Martinsen et al., 2001; Scotti-Saintagneet al., 2004; Lexeret al., 2005). With an increasing call to explore new forest management strategies in the face of climate change, understanding local adaptation in a changing environment will benefit from multilocus genome scans across hybrid zones. Analysis of fine-scale introgression of candi- date genes linked to functionally adaptive phenotypes will allow inference of selective forces at play in the maintenance of the introgression zone, the potential transfer of adaptations between species, and identification of genomic regions that maintain spe- cies. Furthermore, these data will inform our projections regard- ing the capacity of natural hybrid populations to adapt to future climates. Adaptation from standing variation may benefit from admixture where beneficial alleles have been ‘selectively filtered’
in past environments or in separate parts of species ranges, con- tributing to increased variation available for natural selection (Barrett & Schluter, 2008; De Carvalhoet al., 2010). Determin- ing how long-term and more contemporary processes influence and maintain patterns of genomic variation and evolutionary potential remains an important challenge.
In this paper we examine the fine-scale transfer of genetic material between two genetically and ecologically distinct species, Sitka spruce (Picea sitchensis) and white spruce (Picea glauca).
Sitka spruce, the largest ofPiceaspecies, exhibits a narrow latitu- dinal distribution along the Pacific Coast, while the distribution of white spruce spans the boreal forests of North America. These species come into contact along the Nass and Skeena river valleys of northwestern British Columbia, and into Alaska. The contact zone in British Columbia spans an ecological gradient from the maritime climate of Sitka spruce to the continental climate of white spruce (Roche, 1969; O’Neillet al., 2002; Bennuahet al., 2004). The mild, wet maritime climate receives up to 2 m of pre- cipitation annually, with a mean annual temperature of c. 8°C (Pojaret al., 1991). The continental climate is characterized by comparatively lower mean annual precipitation (MAP), and while average annual temperatures are somewhat lower, the tem- perature range is greater as a result of seasonal extremes: hot, dry
summers with average temperatures exceeding 10°C and cold, moist winters with temperatures below 0°C are the norm (Ketchesonet al., 1991).
The objective of this research is to explore variable patterns of introgression and differentiation in this spruce hybrid zone across candidate gene loci putatively associated with adaptive pheno- typic traits in forest tree species. Recent identification of candidate gene single nucleotide polymorphic markers (SNPs) putatively associated with adaptive phenotypes in spruce (Namroudet al., 2008; Hollidayet al., 2010) has made it feasible to evaluate locus-specific patterns of introgression, differentia- tion, and adaptation. An earlier study (Hamilton et al., 2012) estimated hybrid index and characterized genome-wide patterns of admixture as well as phenotypic variation across this hybrid zone. Taking a genome scan approach in the current study, we tested for patterns of differentiation amongst loci identified as can- didates for differential selection or linked to regions influenced by selection using a combination of approaches. We usedFST-outlier tests to identify signatures of divergent or balancing selection among loci between parent species under near-equilibrium condi- tions. We then combined geographic and genomic clines to test the strength of selection and identify deviations from the genome- wide average as estimated with the studied SNPs. Locus-specific patterns depict fine-scale patterns of spatially varying selection and may identify those regions of the genome that are responsible for reproductive isolation or those important to local adaptation across this hybrid zone.
Materials and Methods
Sampling
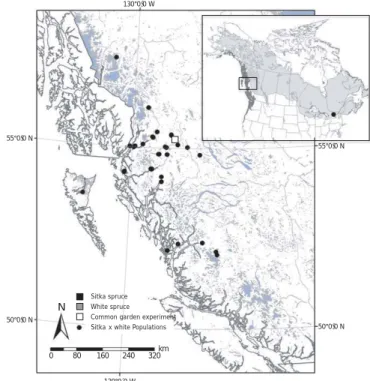
Open-pollinated seeds were sampled from the upper canopy of mature trees across each of 29 locations spanning the contact zone betweenP. sitchensisandP. glaucaalong the Nass and Skeena rivers in northwestern British Columbia in 1997. Allopatric reference populations of P. sitchensison Haida Gwaii (HG) and P. glaucafrom the Ottawa valley region, Ontario, were also sam- pled (Eastern North America, ENA; Table 1, Fig. 1). For each seed parent, 10 open-pollinated progeny were planted in a nurs- ery for 1 yr and then transplanted into a common garden near Kitwanga, British Columbia, within the hybrid zone by the British Columbia Ministry of Forests, Land and Natural Resource Oper- ations (55°17′N, 128°10′W, Fig. 1). Newly flushed lateral buds were sampled from 721 individuals within the common garden in June 2009 and frozen in liquid nitrogen for subsequent DNA extraction and genetic analysis. The same genetic materials were analyzed in Hamiltonet al. (2012).
Genetic data analysis
DNA extraction was performed using a modified CTAB protocol (Doyle & Doyle, 1990). Fifty milligrams of tissue were ground in liquid nitrogen for extraction using a Mixer Mill MM 400 (Retsch, Newtown, PA, USA). Individuals were genotyped for 384 SNPs identified from previous intraspecific studies of
http://doc.rero.ch
parental species as putative candidates for roles in bud set timing and development of cold-hardiness (Hollidayet al., 2008, 2010), weevil resistance (Porthet al., 2011) and growth traits (Namroud et al., 2008; Pavyet al., 2008; Pelgaset al., 2011). SNP selection and quality criteria are described in Hamiltonet al.(2012). SNPs were genotyped using the Illumina bead array platform in con- junction with the GoldenGate allele-specific assay (Shen et al., 2005; Fanet al., 2006). Genotyping quality was evaluated using the GenomeStudio Genotyping Module (v1.0) as described in detail in Hamiltonet al.(2012). Of the initial 384 SNPs geno- typed, 268 met our quality standards for subsequent analysis.
Descriptive statistics
Global and locus-specific estimates ofFST, expected heterozygos- ity (He), and inbreeding coefficient (FIS) were calculated for all populations and between allopatric populations using Arlequin 3.1 (Excoffier et al., 2005). The significance of the inbreeding coefficient was examined using Fisher’s exact tests to test for departures from Hardy–Weinberg equilibrium. Linkage disequi- librium (D′) was estimated for SNPs within the same gene using
R (R Development Core Team, 2007). Within-population maternal family structure may impact allele frequencies; however, a previous study in oaks indicates that mixing five to six families yields a population sample that is in perfect Hardy–Weinberg equilibrium (Streiffet al., 1999). Furthermore, previous research near the hybrid zone indicates that the effective number of pollen parents is very high (18–20 per mother tree), suggesting the use of open-pollinated progeny likely offers a large sample of paternal haplotypes (Mimura & Aitken, 2007).
Identifying outlier loci potentially affected by selection To identify candidate gene SNPs that deviate from a null hypoth- esis of selective neutrality at near-equilibrium conditions between allopatric reference populations (HG and ENA), we used anFST- outlier detection method to assess interspecific patterns of differ- entiation. Based on indications of limited population structure among white spruce populations using a subset of 120 SNPs, we assumed the eastern Canadian white spruce populations are rep- resentative of British Columbia populations (Hamilton et al., 2012). Loci that exhibit extreme genetic differentiation relative
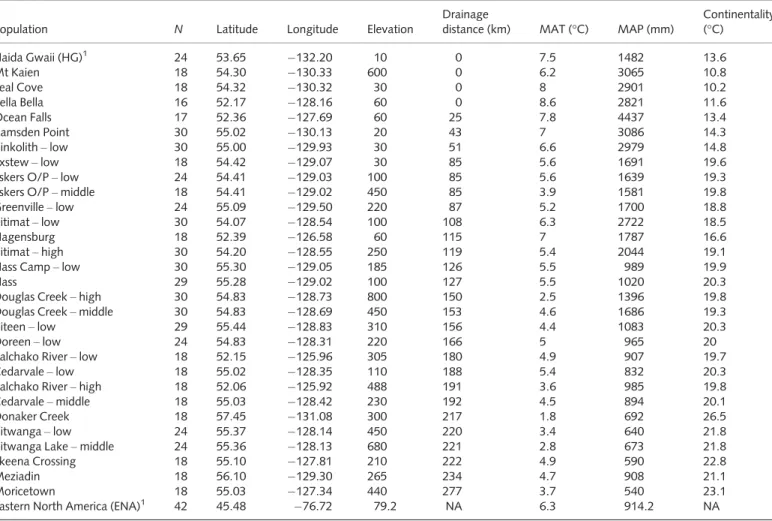
Table 1Origins of Sitka9white spruce (Picea sitchensis9Picea glauca) study populations, sample size (N) and associated geographic distance and climatic variables
Population N Latitude Longitude Elevation
Drainage
distance (km) MAT (°C) MAP (mm)
Continentality (°C)
Haida Gwaii (HG)1 24 53.65 132.20 10 0 7.5 1482 13.6
Mt Kaien 18 54.30 130.33 600 0 6.2 3065 10.8
Seal Cove 18 54.32 130.32 30 0 8 2901 10.2
Bella Bella 16 52.17 128.16 60 0 8.6 2821 11.6
Ocean Falls 17 52.36 127.69 60 25 7.8 4437 13.4
Ramsden Point 30 55.02 130.13 20 43 7 3086 14.3
Kinkolith–low 30 55.00 129.93 30 51 6.6 2979 14.8
Exstew–low 18 54.42 129.07 30 85 5.6 1691 19.6
Eskers O/P–low 24 54.41 129.03 100 85 5.6 1639 19.3
Eskers O/P–middle 18 54.41 129.02 450 85 3.9 1581 19.8
Greenville–low 24 55.09 129.50 220 87 5.2 1700 18.8
Kitimat–low 30 54.07 128.54 100 108 6.3 2722 18.5
Hagensburg 18 52.39 126.58 60 115 7 1787 16.6
Kitimat–high 30 54.20 128.55 250 119 5.4 2044 19.1
Nass Camp–low 30 55.30 129.05 185 126 5.5 989 19.9
Nass 29 55.28 129.02 100 127 5.5 1020 20.3
Douglas Creek–high 30 54.83 128.73 800 150 2.5 1396 19.8
Douglas Creek–middle 30 54.83 128.69 450 153 4.6 1686 19.3
Kiteen–low 29 55.44 128.83 310 156 4.4 1083 20.3
Doreen–low 24 54.83 128.31 220 166 5 965 20
Talchako River–low 18 52.15 125.96 305 180 4.9 907 19.7
Cedarvale–low 18 55.02 128.35 110 188 5.4 832 20.3
Talchako River–high 18 52.06 125.92 488 191 3.6 985 19.8
Cedarvale–middle 18 55.03 128.42 230 192 4.5 894 20.1
Donaker Creek 18 57.45 131.08 300 217 1.8 692 26.5
Kitwanga–low 24 55.37 128.14 450 220 3.4 640 21.8
Kitwanga Lake–middle 24 55.36 128.13 680 221 2.8 673 21.8
Skeena Crossing 18 55.10 127.81 210 222 4.9 590 22.8
Meziadin 18 56.10 129.30 265 234 4.7 908 21.1
Moricetown 18 55.03 127.34 440 277 3.7 540 23.1
Eastern North America (ENA)1 42 45.48 76.72 79.2 NA 6.3 914.2 NA
MAT, mean annual temperature; MAP, mean annual precipitation. NA, not applicable.
Reproduced, with permission, from Hamiltonet al.(2012).
1Parental populations used to calculate hybrid index.
http://doc.rero.ch
to average patterns of the majority of loci are candidates for diver- sifying selection, while those loci that exhibit unusually low degrees of differentiation may be under balancing selection.
We used a Bayesian likelihood method developed by Foll &
Gaggiotti (2008) implemented in the program BayeScan to examine patterns of differentiation. This approach teases apart the influence of two models, differentiating locus-specific (ai) and population-specific (bj) effects using logistic regression to calculate locus-specific estimates of FST (Foll & Gaggiotti, 2008). This approach is appropriate where gene flow is nonsym- metrical (Beaumont & Nichols, 1996; Nielsen et al., 2009), as previous research has suggested for this hybrid zone (Hamilton et al., 2012).
Positive values of the locus-specific parameter (ai) indicate that locus i may be more differentiated on average, while negative values indicate less differentiation on average. The model inclu- ding only population-specific (bj) effects was compared with the model including both locus-specific and population (ai and bj) effects to test for selection, assuming equal prior probabilities for each model. The ratio of the marginal likelihoods of the two models provides a Bayes’ factor (BF; Foll & Gaggiotti, 2008), which may be interpreted in terms of amount of support for loci being subject to selection (very strong support between log10(BF)=1.5 and 2; decisive support for log10(BF)2) corre- sponding to posterior probabilities of the model of selection (substantial evidence between 0.91 and 0.99, decisive between 0.99 and 1). Following 20 pilot runs of 5000 iterations, we used
50 000 additional iterations (sample size of 5000 and thinning interval of 10) to identify loci that may be candidates for selec- tion. While these tests are informative, they remain subject to other influences of variation, including population demography and hierarchical population structure, and can result in overesti- mation of selection (Excoffieret al., 2009; Siolet al., 2010).
Genomic cline analysis
Genome-wide estimates of admixture were calculated using the R package Introgress (Gompert & Buerkle, 2010), which uses a maximum-likelihood approach to estimate ancestries of individu- als summarized in a hybrid index. This program requiresa priori knowledge of pure parental individuals, here identified as those reference populations HG (Sitka spruce) and ENA (white spruce), to estimate the proportion of ancestry attributed to either parent. A hybrid index of zero corresponds to pure white spruce, while a hybrid index of one corresponds to pure Sitka spruce.
Employing the genomic clines method of Gompert & Buerkle (2009) implemented in Introgress (Gompert & Buerkle, 2010), genomic clines were estimated for individual loci based on the probabilities of observing three possible genotypes at each locus as a function of genome-wide estimates of admixture (hybrid index): WW (homozygous white spruce), WS (heterozygous genotype), or SS (homozygous Sitka spruce). These genomic clines are estimated using multinomial regression of observed sin- gle-locus genotypes as a function of genome-wide admixture (Gompert & Buerkle, 2009). The likelihood of the regression model is compared with a null model of genotype frequencies simulating neutral introgression using parametric simulations as described in Gompert & Buerkle (2010).
Deviations from the genome-wide average as estimated with the SNPs are based on departures from the 95% confidence enve- lope for the logistic regressions as summarized through compari- sons of the probability density of observed genotypic data with those of the neutral model of introgression following 1000 sto- chastic parametric simulations. A false discovery rate for aP-value of 0.05 was calculated using qvalue (Storey, 2002). Evidence for an excess (+) or deficit ( ) of homozygous genotypes (WW and SS) corresponds, respectively, to an increase or decrease in the total probability density of the observed genotype compared with the corresponding probability density of the homozygous geno- type of the neutral model (Gompert & Buerkle, 2009, 2010;
Nolteet al., 2009). Similarly, evidence for an excess (+) or deficit ( ) of heterozygous genotypes (WS) is obtained from comparing the observed frequency of heterozygous genotypes with the prob- ability density of heterozygous genotypes under the neutral model.
Geographic cline analysis
The geographic gradient was estimated using drainage distance along river valleys from the Pacific Ocean. Previous studies have shown that genomic composition as estimated by hybrid index is best predicted by drainage distance through this mountainous
Common garden experiment Sitka spruce White spruce Sitka x white Populations
km 320 240 160
N
80
130°0´0ÝW
50°0ǯ0ÝN 55°0ǯ0ÝN 130°0ǯ0ÝW
55°0ǯ0ÝN
50°0ǯ0ÝN
0
Fig. 1Sampling across the introgression zone between Sitka (Picea sitchensis) and white (Picea glauca) spruce in northwestern British Columbia, indicating provenance of origin of samples (circle) collected and planting location of the common garden experiment (square). Inset map provides North American range ofP. sitchensis(dark grey) andP. glauca (light gray), and indicates source of the reference Eastern North American population. Reproduced, with permission, from Hamiltonet al.(2012).
http://doc.rero.ch
region (O’Neill et al., 2002; Bennuah et al., 2004; Hamilton et al., 2012). Drainage distance characterizes the likely corridor of gene flow along valleys through which pollen, and to a lesser extent seed dispersal, occurs between the coastal maritime climate and the interior continental climate (Bennuah et al., 2004).
Drainage distance was calculated from the coast inland using ArcGIS (Version 10), replicating methods from Bennuah et al.
(2004). The pure white spruce reference population from Ontario (ENA) was excluded from this analysis as a result of its long distance from all other populations.
Geographic cline parameters were estimated individually for each SNP using a modified approach to traditional analysis.
Traditional cline analysis assumes a sigmoidal shape that describes sharp changes in allele frequencies near the centre of the cline and shallower asymptotes towards the edges of the contact zone (Barton & Hewitt, 1985; Payseur, 2010). The most common parameters used to describe cline shape are width and centre (Porteret al., 1997; Carling & Brumfield, 2009; Payseur, 2010;
Teeter et al., 2010). The existing field experiment sampled for this study was established to assess seed transfer for reforestation within the hybrid zone and not in allopatric areas, and thus did not sample either a pure white spruce reference population from British Columbia or populations at the eastern margin of the hybrid zone that may also include introgression from a third spe- cies (Picea engelmannii; Roche, 1969). The lack of pure white spruce populations in our sample is evidenced by an exponential increase in white spruce allele frequencies to the east without an upper asymptote. Consequently, we developed an alternate approach, estimating proxies for traditional parameters to account for the distortion in allele frequencies attributed to incomplete sampling of white spruce parent populations.
This novel approach has been adapted from equations found in biological growth curves that allow estimation of maximum slope of a nonlinear regression and ‘length of lag phase’ or lambda (Kahmet al., 2010; Paineet al., 2011). We interpret the maximum slope as an estimate of the strength of selection, com- parable to the traditional estimate of width (slope=1/width) in a sigmoid curve (Porteret al., 1997). Steeper slopes indicate stron- ger barriers to introgression between species, whereas flatter slopes may indicate either extensive allele-sharing through recur- rent gene flow or shared polymorphisms. ‘Length of lag’ is inter- preted as the drainage distance accumulated from the coast to the point of maximum rate of change in allele frequency. This parameter associates a geographic estimate on the landscape with maximum rate of change in allele frequency.
Linear regressions were compared with nonlinear regressions estimated using both asymptotic (logistic) and nonasymptotic (exponential) functions (Paine et al., 2011). The exponential model assumes a constant rate of increase with respect to change in allele frequency and drainage distance with no asymptote, whereas the logistic model assumes an initial asymptote without a constant rate of increase. All regressions were implemented in R using the self-starting routines (SSlin, SSlogis and SSexp) follow- ing recommendations from Paineet al.(2011). Akaike informa- tion criterion (AIC) and R2 values were compared between regression models to identify the best-fit model. Where the
logistic model failed to converge, the exponential model was used as the sole comparison with the linear model. Using the fitted data from the best-fit model, we fitted a smoothed cubic spline using the gcFitSpline function within the R package grofit (Kahm et al., 2010) to estimate maximum slope and lag phase. The advantage of this approach is the step-by-step development of a best-fit model for each SNP using the approach described in Paineet al.(2011).
Enrichment of heterozygotes and homozygotes for genomic clines and directional shifts were assessed in geographic and geno- mic clines to identify those loci that may be candidates for involvement in reproductive isolation or adaptation. Where simi- lar patterns were observed in geographic and genomic clines, the distribution of genotypes was associated with a previously identi- fied important climatic variable, MAP (Hamilton et al., 2012) across the hybrid zone.
Results
The global estimate of mean genetic differentiation (FST) across all populations sampled was 0.18, ranging from 0.02 to 0.47 for individual loci (Supporting Information, Table S1). Expected heterozygosity (He) averaged 0.31 across all loci, ranging from 0.04 to 0.5. The inbreeding coefficient (FIS) averaged 3.739 10 5, ranging from 0.29 to 0.29 for individual loci, indicating overall low levels of inbreeding. No loci exhibited significant deviations from Hardy–Weinberg equilibrium based on exact tests (P<0.05).
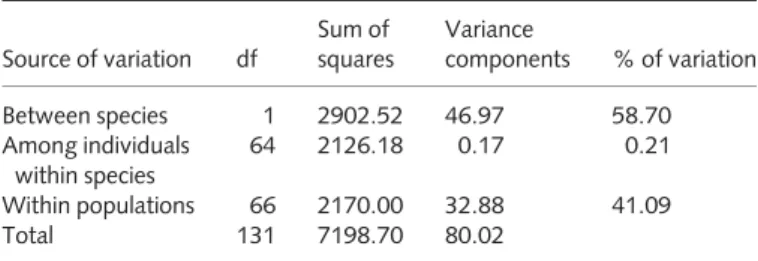
Comparison of allopatric populations using AMOVA indi- cated that the majority of variation is accounted for between spe- cies (Table 2). Overall, the estimate of FST between allopatric Sitka spruce (HG) and white spruce (ENA) was 0.59, indicating that interspecific differentiation exceeded those where all popula- tions, sympatric and allopatric, were evaluated. These results are in line with locus-specific estimates of interspecific differentiation values between the allopatric populations, ranging from zero to one.
Outlier analysis
Using BayeScan, which uses a Bayesian decision-making approach to model choice with a ‘Bayes factor’ to provide evi- dence in support of a model of selection or neutrality, we observed three loci with a high posterior probability (>0.90 or log10(BF)>1) of being subject to selection. All three SNPs (53,
Table 2 AMOVA for 268 candidate gene single nucleotide polymorphisms (SNPs) betweenPicea sitchensisandPicea glauca
Source of variation df
Sum of squares
Variance
components % of variation
Between species 1 2902.52 46.97 58.70
Among individuals within species
64 2126.18 0.17 0.21
Within populations 66 2170.00 32.88 41.09
Total 131 7198.70 80.02
http://doc.rero.ch
55, and 106) are candidates for or are linked to candidates for diversifying selection (Fig. 2). There were no candidates for balancing selection, an expected outcome given that loci were ini- tially selected based on degree of interspecific differentiation in SNP frequencies (FST).
Genomic cline analyses
Extensive heterogeneity in genomic clines was observed, indicat- ing many loci deviated considerably from the genome-wide average as estimated from all SNPs (Tables 3, S1, Fig. S1). All loci were assessed for deviations from the genome-wide average estimate of ancestry and null model of neutral introgression, excluding loci that lacked allele frequency differences between parent species. Of these, 94 exhibited a neutral pattern of intro- gression, indicating no deviation from the genome-wide estimate of ancestry. Other patterns included 64 loci exhibiting evidence for excess ancestry of white spruce alleles in a Sitka spruce back- ground (WW+, Table 3, Fig. S1) and 67 loci with an excess of Sitka spruce alleles in a white spruce background (SS+, Table 3, Fig. S1), indicating potential positive selection. Sixty-seven loci had patterns consistent with a deficit of heterozygous genotypes (WS ), while 51 loci showed an excess of heterozygotes (WS+) compared with the model of neutral introgression (Table 3, Fig.
S1). Of these 118 loci, two small groups exhibited a pattern of deficiency (16 loci, WS ) and excess (nine loci, WS+) of hetero- zygotes, respectively, while homozygous genotypes exhibited no deviation. Loci where heterozygotes are overrepresented may be candidates for or are linked to genomic regions involved in the
transfer of adaptations contributing to transgression in adaptive traits. Where heterozygotes are underrepresented, these loci may be candidates for regions of the genome involved in reproductive isolation.
Genetic map relationships among these markers remain unknown, and therefore some values may be inflated if linkage disequilibrium (LD) exists between a marker and an adjacent genetic region under selection. SNPs within the same candidate gene indicate that physical proximity likely contributes to LD (i.e. SNP 53 and 55–D′=0.99,P<0.0001). Preliminary assess- ment of genetic map locations for a subset of SNPs used in this study suggests the loci used are well distributed throughout the genome (J. Bousquet & N. Isabel, unpublished).
Geographic clines
While patterns of interspecific differentiation may reveal long- term influences of selection, direct examination of the introgres- sion zone using clinal analysis may provide additional power to detect targets of selection under nonequilibrium conditions. Geo- graphic cline parameters, slope, and ‘lag phase’ (lambda) were estimated for each SNP (Table 3, Fig. S2). Cline parameters reflect the change in frequency of the minor ‘Sitka spruce’ allele (the less frequent allele in Sitka spruce corresponding to the more frequent allele in white spruce) with increasing drainage distance from the ocean. Maximum slope of regressions, describing changes in allele frequency km–1of drainage distance, averaged 0.003 km 1 and ranged from 0.001 to 0.012 (Table 3).
Lambda is the intercept of maximum slope in km, indicating the point along the drainage distance transect from the ocean at which the greatest rate of change in allele frequency occurs.
Locus-specific estimates of lambda ranged from 0 to 236 km, with an average of 119 km across all loci. Negative drainage dis- tance values were set to zero for 22 loci, and lambda was not esti- mated for 45 loci where the slope was estimated as zero. Few loci exhibited maximum cline slopes >0.011 km 1, suggesting the absence of strong or complex barriers to gene flow between the two species.
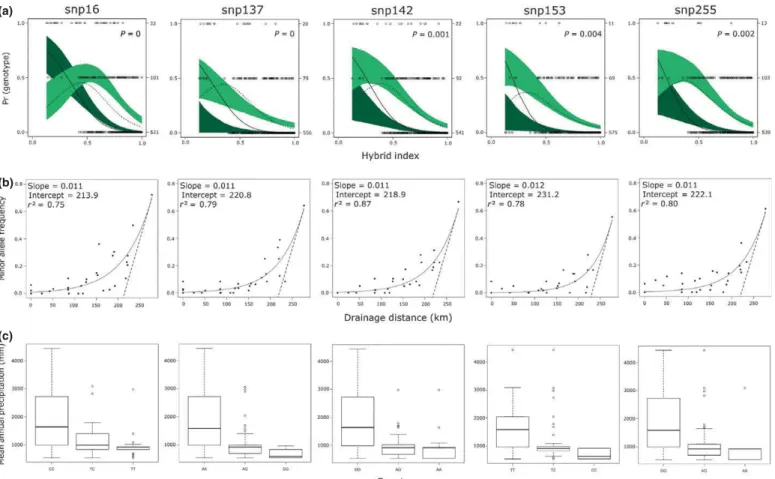
For loci where patterns were comparable between geographic and genomic clines, the distribution of genotypes across the hybrid zone was strongly associated with MAP (Fig. 3). Analysis of variance indicated that locus-specific genotypes were significantly differentiated based on precipitation (P<0.001). Sitka spruce genotypes spanned a range above 1000 mm, white spruce genotypes were distributed below 1000 mm, and heterozygous genotypes had a small range in precipitation centered atc. 1000 mm, with little overlap with either homozygous genotypes (Fig. 3).
Discussion
Differential patterns of introgression exhibited within this natural hybrid zone suggest that targets of selection may vary strongly geo- graphically across the landscape and between divergent genomic backgrounds. Substantial heterogeneity, both across the geographic landscape and within the genome itself, indicate the general permeability of these spruce genomes to introgression, yet
0.0 0.5 1.0 1.5
0.30.40.50.60.7
Log10(BF) FST
SNP53 SNP55 SNP106
Fig. 2Log-transformed Bayes factors and locus-specificFSTestimated from Bayescan for 268 candidate gene single nucleotide polymorphisms (SNPs), identifying potential candidates for diversifying (excess
differentiation) or balancing (deficient differentiation) selection across the Sitka (Picea sitchensis)–white (Picea glauca) spruce hybrid zone. The vertical line log10(BF)=1 (solid) corresponds to a posterior probability of 0.91. For points beyond this line there is substantial to very strong evidence in favor of selection..
http://doc.rero.ch
identify specific genomic regions and geographic barriers where interspecific recombination may be limited. Moreover, fine-scale variability amongst loci indicates that both extrinsic and intrinsic selective factors likely influence introgression. Correspondence between geographic and genomic clines for some SNPs indicates a strong role for extrinsic selection, particularly in association with precipitation gradients. In addition, patterns of differentiation identified through outlier analysis point toward candidate gene loci that may be linked to genes important to local adaptation or the maintenance of species barriers over a longer evolutionary period. These results provide a fine-scale picture of the movement of genetic material across this ecological transition zone, identify- ing regions of the genome that warrant further exploration.
Interspecific patterns of genetic differentiation
Selection can be inferred from the distribution of genetic differ- entiation among species or populations across the genome. Can- didate genes for divergent selection have a greater likelihood of residing in areas of the genome that are highly differentiated between species and may be involved in either reproductive isola- tion or adaptation (Beaumont & Nichols, 1996; Beaumont &
Balding, 2004). We observed few candidate genes for divergent selection (Fig. 2); although some of these candidates may be linked to loci under divergent selection (Via, 2012).
The use of SNPs preselected from putatively adaptive genes developed from intraspecific studies requires a caveat for develop- ment of a neutral model of no-locus effect. Few outlier loci, combined with evidence from Arabidopsis thalianathat suggest different genes may be targets of selection in different environ- ments (Hancocket al., 2011), indicate that these loci are likely reasonable for development of a neutral distribution. While the
interpretation of posterior probabilities provides evidence for selection, other neutral processes may contribute to the patterns of variation observed. However, in a continuously distributed, wind-pollinated study system with large effective population sizes, these processes are likely less important. Consequently, while these test results should be interpreted with some caution, they offer a useful first step in pointing towards some candidate genes that may be targets of or linked to targets of selection.
Indeed, the reported number of outliers may be conservative, owing to the use of candidate genes associated with putative func- tion from gene expression studies. As these candidate loci have a higher probability of being under selection, shifting the distribu- tion ofFSTestimates upwards compared with purely neutral loci, some loci under weak selection may not be detected.
Our results for the Sitka-white spruce hybrid zone across an east–west precipitation and temperature gradient identified dif- ferent candidates for selection than those observed along a north–
south temperature gradient in Sitka spruce by Holliday et al.
(2010). SNPs 53 and 55 are found in a gene homologous to sphingolipid desaturase (SLD) identified in Arabidopsis (At2g- 46210.1), and arec. 100 bp apart. The strong LD between SNPs 53 and 55 (D′=0.99,P<0.0001) implies that one of these SNPs or a locus linked to both is likely the target of selection. These SNPs have been assayed in previous studies examining intraspe- cific variation and SNP–phenotype associations in the develop- ment of autumnal cold-hardiness and bud set timing in Sitka spruce (Hollidayet al., 2008, 2010). Hollidayet al.(2010) stud- ied populations spanning gradients in Sitka spruce across the spe- cies’ range of mean annual temperature and degree-days associated with phenological cues and development of cold hardi- ness. This gene, believed to be a fatty acid/sphingolipid desatur- ase, produces divergent phenotypes inArabidopsisin response to
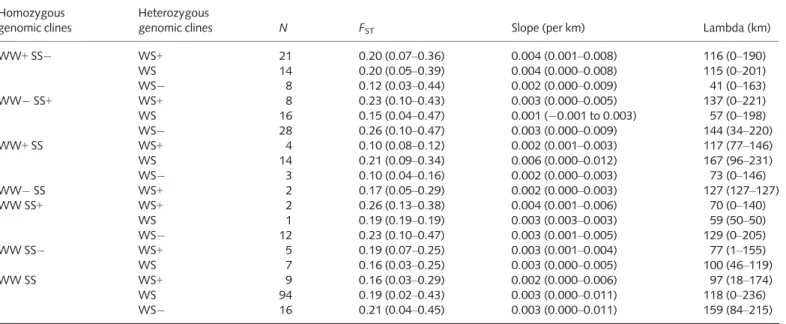
Table 3Summary statistics for genomic clines, geographic clines and genetic differentiation (FST) across all loci Homozygous
genomic clines
Heterozygous
genomic clines N FST Slope (per km) Lambda (km)
WW+SS WS+ 21 0.20 (0.07–0.36) 0.004 (0.001–0.008) 116 (0–190)
WS 14 0.20 (0.05–0.39) 0.004 (0.000–0.008) 115 (0–201)
WS 8 0.12 (0.03–0.44) 0.002 (0.000–0.009) 41 (0–163)
WW SS+ WS+ 8 0.23 (0.10–0.43) 0.003 (0.000–0.005) 137 (0–221)
WS 16 0.15 (0.04–0.47) 0.001 ( 0.001 to 0.003) 57 (0–198)
WS 28 0.26 (0.10–0.47) 0.003 (0.000–0.009) 144 (34–220)
WW+SS WS+ 4 0.10 (0.08–0.12) 0.002 (0.001–0.003) 117 (77–146)
WS 14 0.21 (0.09–0.34) 0.006 (0.000–0.012) 167 (96–231)
WS 3 0.10 (0.04–0.16) 0.002 (0.000–0.003) 73 (0–146)
WW SS WS+ 2 0.17 (0.05–0.29) 0.002 (0.000–0.003) 127 (127–127)
WW SS+ WS+ 2 0.26 (0.13–0.38) 0.004 (0.001–0.006) 70 (0–140)
WS 1 0.19 (0.19–0.19) 0.003 (0.003–0.003) 59 (50–50)
WS 12 0.23 (0.10–0.47) 0.003 (0.001–0.005) 129 (0–205)
WW SS WS+ 5 0.19 (0.07–0.25) 0.003 (0.001–0.004) 77 (1–155)
WS 7 0.16 (0.03–0.25) 0.003 (0.000–0.005) 100 (46–119)
WW SS WS+ 9 0.16 (0.03–0.29) 0.002 (0.000–0.006) 97 (18–174)
WS 94 0.19 (0.02–0.43) 0.003 (0.000–0.011) 118 (0–236)
WS 16 0.21 (0.04–0.45) 0.003 (0.000–0.011) 159 (84–215)
Individual loci(N) are classified based on genomic clines, indicating an excess (+) or lack ( ) of homozygous white spruce (WW), Sitka spruce (SS) and het- erozygous (WS) genotypes given estimates of genome-wide ancestry, or neutral. Mean and range for each class are provided for estimates of genetic dif- ferentiation (FST), slope (per km), and lambda (km).
http://doc.rero.ch
cold temperatures (Chenet al., 2012). Sphingolipids likely con- tribute to both ion permeability and osmotic adaptation during response to both freezing and dehydration (Steponkus, 1984).
This candidate gene was not associated with bud set or cold injury traits within Sitka spruce by Hollidayet al.(2010). These results may provide support for different genes being targets of selection in different environments (Barrett & Hoekstra, 2011;
Hancocket al., 2011).
SNP106 (GAI, Gibberellic Acid Insensitive), with putative func- tion in Arabidopsis in gibberellic acid-mediated signaling (At1g14920.1), also exhibited excess interspecific differentiation.
Interestingly, this was one of a number of candidate genes identi- fied from expression studies of resistance in Sitka spruce to the white pine shoot tip weevil (Pissodes strobi, Ralph et al., 2006).
Given gibberellins’ role in the promotion of growth and induc- tion of mitotic division, they may have a putative role in the for- mation of constitutive or traumatic resin canals involved in defense (Richards et al., 2001). Previous studies have observed
significant differentiation between parental species in the formation of resin canals (O’Neillet al., 2002). Association tests within a phenotyped population of advanced-generation intro- gressed individuals are needed to further test these loci.
Genomic clines
Using genomic clines, we compared deviations from a model of neutral introgression for individual loci indicated by an excess or deficit of specific genotypic classes given expectations based on genome-wide ancestry across the hybrid zone. Loci exhibited a diversity of patterns ranging from under- to over-representation of certain genotypes. The single most common category across homozygous and heterozygous genotypes fitted the neutral model of introgression (WW WS SS, 94/264 loci) although a majority of loci displayed a diversity of patterns inconsistent with neutral introgression. The most common categories deviating from a pattern of neutral introgression were a deficit (WW WS SS+, (a)
(b)
(c)
Fig. 3Comparison of genomic clines (top), geographic clines (middle) and climatic distribution of genotypes for single nucleotide polymorphisms (SNPs) exhibiting a cline width<100 km. (a) Genomic clines indicate locus-specific patterns of introgression using the genome-wide estimate of admixture (hybrid index, 0; white spruce (Picea glauca), 1; Sitka spruce (P. sitchensis)) to estimate the probability of observing a particular genotype at that locus;P-values are provided in the right corner of the observed data under a model of neutral introgression. The 95% confidence envelope of the probability of the homozygous white spruce genotype (dark green) and the heterozygous genotype (light green) are based on 1000 neutral parametric simulations. Fitted genomic clines are observed for the homozygous white spruce genotype (solid line) and heterozygous genotype (dashed line), while open circles indicate observed genotypes: white spruce (WW, top), heterozygous (WS, middle) or Sitka spruce (SS, bottom). The frequency of observed genotypes is indicated on the right of the panel. (b) Geographic clines indicate the relationship between the frequency of the minor Sitka spruce allele and drainage distance (km).
Geographic cline parameters indicate the proportion of variance accounted for using a linear or nonlinear (logistic or exponential) regression and maximum slope and intercept (lambda, dashed line) for fitted values (solid line). (c) Distribution of genotypes with respect to mean annual precipitation (mm) across the hybrid zone.
http://doc.rero.ch
28/264) and an excess of white spruce genotypes (WW+ WS+
SS , 21/264). These loci may point towards candidate regions of the genome involved in either reproductive isolation or adap- tive introgression, respectively, although we cannot exclude the influence of neutral evolution. Surprisingly, all three previously describedFST-outlier loci exhibit neutral patterns of introgression in the genomic cline analysis. However, the outlier approach ana- lyzes the long-term accumulation of differentiation between allo- patric populations, while the genomic cline analysis reveals the more contemporary influence of locus-specific selection. Further- more, while FST-outlier tests may reveal loci under selection, there are many conditions where these tests may fail to identify loci involved in adaptation (Le Corre & Kremer, 2012), particu- larly for polygenic traits, pointing towards the importance of a combined analytical approach.
While a false discovery rate of 0.007 ata=0.05 indicates few false positives, sampling design may have influenced the patterns we detected (Storey, 2002; Teeteret al., 2010). Few individuals were sampled from the eastern end of the introgression zone, and this likely impacted the observed frequency of white spruce geno- types. However, because genomic clines reflect locus-specific introgression with respect to genome-wide ancestry across all loci, the patterns reflect the rate of introgression given present ances- try. In addition, asymmetric introgression toward Sitka spruce (Hamilton et al., 2012) may result in selection against white spruce genotypes where strong pre- or postzygotic barriers exist.
A deficit of heterozygotes (WW WS SS) was observed in 16 loci. These loci may be within or linked to genes that result in decreased fitness of heterozygotes, although whether this is a result of intrinsic or extrinsic genetic factors remains unclear.
Selection against heterozygotes may indicate either simple under- dominance or intrinsic Dobzhansky–Muller incompatibilities resulting from heterozygote incompatibility (Teeteret al., 2010).
SNP16 had a very steep geographic cline, exhibiting a pattern of underdominance, further supporting comparisons between geo- graphic and genomic clines. This SNP has putative function within a Scarecrow-Like protein (SCL3, At1g50420.1), which interacts with the gibberellin (GA) pathway, regulating growth in Arabidopsis(Zhanget al., 2011).
Few markers (9/264) exhibited an excess of heterozygotes rela- tive to neutral expectation. These loci, however, may indicate an adaptive advantage for hybrid genotypes (Nolte et al., 2009).
Transgressive patterns exhibited in hybrids for cold tolerance at moderately cold temperatures in a previous study suggest higher fitness of hybrid genotypes within the hybrid zone (Hamilton et al., 2012). This lends support to the role of hybrid zones in the transfer of adaptations between species (Rieseberg & Wendel, 1993), and may have important implications in the response of admixed populations to a changing climate.
Genomic clines tell us much about locus-specific introgression, although some caveats are necessary. While the majority of loci exhibit deviations from a neutral model of introgression, some of these could result from genetic drift alone, particularly if drift occurred independently in different populations. However, it is unlikely that drift would overwhelm selection, particularly given the large effective population sizes throughout the hybrid zone
(Nolteet al., 2009). Furthermore, the number of loci in catego- ries deviating from a pattern of neutral introgression may be overestimated as a result of LD among loci, which is expected to be substantial within hybrid zones (Lexeret al., 2007). Estimates of LD between SNPs on the same gene (two to four SNPs per gene) indicate that those SNPs are significantly linked (averageD
′=0.89 across 18 genes,P<0.0001) and so signatures of selec- tion may reflect nearby polymorphisms rather than specific SNPs. In future studies, estimation of linkage relationships and the degree of recombination following first contact will be possi- ble as genetic maps and a whole genome sequence become avail- able for spruce. Finally, distinguishing loci under neutral introgression from those loci under positive or negative selection is integral to the genomic clines method. With interspecific crosses we expect more loci to have negative fitness consequences than positive ones (Barton, 2001). There may be a slight bias toward overestimating positively selected loci in the hybrid zone and underestimating negatively selected ones if rates of neutral introgression are underestimated (Rieseberg et al., 1999). This suggests our estimate of the frequency of loci exhibiting negative selection is conservative.
Geographic clines
The ecological transition from maritime to continental climates is reflected at a finer spatial scale in the substitution of largely Sitka spruce alleles for white spruce alleles with increasing drain- age distance up river valleys. While there is variation among locus-specific clines, on average the maximum rate of change in allele frequencies (0.003 km 1) occurs at c. 120 km from the coast. This distance is concordant with the beginning of a sharp decline in MAP, suggesting that moisture may be a strong selec- tive factor across this ecological gradient. Our previous research indicates that ancestry is influenced by precipitation and temper- ature gradients spanning the ecological transition zone (Hamilton et al., 2012). Particularly sharp clines in genome-wide ancestry associated with precipitation indicate that the intensity and direc- tion of selection may change below a threshold ofc. 1000 mm of precipitation annually (Hamiltonet al., 2012).
We have estimated proxies for the most commonly used cline parameters: maximum slope, indicating the maximum rate of change in allele frequency km–1 drainage distance; and lambda, the geographic point on the landscape where we observe the greatest rate of change. Loci that exhibit shallower clines may be candidates for neutral introgression, while steep clines are more likely to be attributed to selection against hybridization, indicat- ing intrinsic Dobzhansky–Mueller incompatibilities or extrinsic (environmental) incompatibilities limiting introgression. Teasing apart the influence of intrinsic or extrinsic incompatibilities would require testing the fitness of progeny from controlled crosses in multiple environments across the hybrid zone.
Relating geographic and genomic clines
The five candidate gene loci (16, 137, 142, 153, and 255, Fig. 3) that exhibited steepest clines (maximum clines slopes of
http://doc.rero.ch
0.011–0.012 km 1) are candidates for divergent selection or repro- ductive isolation or are linked to such genes. Only SNP16, associ- ated with regulating gibberellin signaling and plant development (Zhanget al., 2011), exhibited a pattern of selection against het- erozygotes (WS ), while SNPs 137, 142, and 153 exhibited positive selection for the white spruce genotypes (WW+) and SNP255 was neutral (Fig. 3). This may indicate that SNP16 is a candidate for or is linked to a locus involved in intrinsic Dobzhansky–Mueller incompatibilities resulting in hybrid inferi- ority or breakdown (Carling & Brumfield, 2008; Schluter &
Conte, 2009; Teeteret al., 2010). SNPs 137, 142, and 153, on the other hand, all exhibited the greatest rate of change in allele frequency between 213 and 220 km, along with an excess of white spruce genotypes and a lack of heterozygotes in a white spruce background (Fig. 3). This geographic region again corre- sponds to the drier end of the steep precipitation gradient that beginsc. 120 km inland from the ocean (Hamiltonet al., 2012).
At 200 km drainage distance from the coast, all MAP values fall below 1000 mm of annual precipitation. An ANOVA comparing homozygous and heterozygous genotypes with MAP suggests that genotypes across the hybrid zone are distributed based on precipi- tation (P<0.0001, Fig. 3). Both SNP137 (Plasma membrane instrinsic protein (PIP2E), At2g39010.1) with putative function in water channel activity and SNP255 (early-response-to-drought-6 (erd6), At1g08930.2) are homologous to genes important to drought response inArabidopsis.Signatures of selection in candi- date genes related to drought stress inPinus taeda identified a relatedearly-response-to-drought-3 (erd3)gene as potentially adap- tive (Gonzalez-Martınez et al., 2006). This suggests these genes may be important in terms of drought response across species.
While Sitka spruce genotypes and heterozygous genotypes are common across a range of precipitation values exceeding 1000 mm, there appears to be a threshold below which the white spruce is the sole genotype observed. Similar trends were observed for mean summer precipitation and precipitation as snow;
however, the relationship with these climatic variables was weaker and did not reflect the abrupt transition seen for MAP. These results suggest the distribution of some alleles across the landscape may be strongly influenced by extrinsic selection in drier environ- ments, but not in wetter areas, where they may be neutral.
Studies of Arabidopsis thaliana populations sampled across steep environmental gradients show some SNPs are neutral in one test environment, but adaptive in another (Fournier-Level et al., 2011; Hancock et al., 2011). Our results point towards a similar dynamic within this spruce hybrid zone, where some SNPs appear neutral against a Sitka spruce background but are potentially adaptive against a white spruce background, where there is strong selection for the white spruce genotype. Compar- ing the genomic and geographic clines of SNPs 137, 142, and 153, we observe that where there is strong evidence of selection favoring the white spruce genotype, there are fewer heterozygotes, suggesting potential divergent selection across environments (Fig. 3).
Examining differential introgression using interspecific differ- entiation combined with geographic and genomic clines identi- fies heterogeneous patterns among loci across the genome,
suggesting porous spruce genomes. Not unexpectedly, these tests identify different subsets of candidate genes under selection, depending on gene action, strength of selection, and distribution of underlying environmental variation. This points towards the importance of using multiple approaches to investigate SNPs that may be under selection. Candidates for divergent selection identi- fied using outlier tests merit further investigations using func- tional assays in combination with genomic association tests.
Furthermore, patterns of differential introgression across the landscape validate patterns of introgression observed into varying genomic backgrounds, identifying an important role for environ- mental selection, particularly along precipitation gradients. These approaches identify a suite of candidate gene SNPs for future inclusion in association and functional assays. This fine-scale approach provides the context for broader questions regarding the maintenance of species barriers in these long-lived species, distinguishing regions of the genome where selection may pre- vent introgression. Identifying the genomic regions where differ- ences accumulate in this and other conifer hybrid zones will provide an opportunity to identify loci and genomic regions that maintain species.
Acknowledgements
We would like to thank John King for establishing the common garden; Christine Chourmouzis, Lisa Erdle, Nina Lobo, and Jon Sweetman for field assistance; Dorothea Lindtke for advice with analysis; and Loren Rieseberg and Kermit Ritland for helpful manuscript comments. The work was supported by Genome British Columbia, Genome Canada and the Forest Genetics Council of British Columbia (funding to S.A.) by the Natural Sciences and Engineering Research Council of Canada (NSERC;
grant to S.A.), and by an NSERC Canada Graduate Scholarship and University of British Columbia Doctoral Fellowship to J.H.
References
Barrett R, Schluter D. 2008.Adaptation from standing genetic variation.Trends in Ecology & Evolution23: 38–44.
Barrett RDH, Hoekstra HE. 2011.Molecular spandrels: tests of adaptation at the genetic level.Nature Reviews Genetics12: 767–780.
Barton NH. 2001.The role of hybridization in evolution.Molecular Ecology10:
551–568.
Barton NH, Hewitt GM. 1985.Analysis of hybrid zones.Annual Review of Ecology and Systematics16: 113–148.
Beaumont MA, Balding DJ. 2004.Identifying adaptive genetic divergence among populations from genome scans.Molecular Ecology13: 969–980.
Beaumont MA, Nichols RA. 1996.Evaluating loci for use in the genetic analysis of population structure.Proceedings of the Royal Society-B263:
1619–1626.
Bennuah SY, Wang T, Aitken SN. 2004.Genetic analysis of thePicea sitchensis 9glaucaintrogression zone in British Columbia.Forest Ecology and Management197: 65–77.
Bierne N, Welch J, Loire E, Bonhomme F, David P. 2011.The coupling hypothesis: why genome scans may fail to map local adaptation genes.
Molecular Ecology20: 2044–2072.
Brennan AC, Bridle JR, Wang A-L, Hiscock SJ, Abbott RJ. 2009.Adaptation and selection in theSenecio(Asteraceae) hybrid zone on Mount Etna, Sicily.
New Phytologist183: 702–717.