HAL Id: hal-00297814
https://hal.archives-ouvertes.fr/hal-00297814
Submitted on 26 Jun 2006HAL is a multi-disciplinary open access
archive for the deposit and dissemination of sci-entific research documents, whether they are pub-lished or not. The documents may come from teaching and research institutions in France or abroad, or from public or private research centers.
L’archive ouverte pluridisciplinaire HAL, est destinée au dépôt et à la diffusion de documents scientifiques de niveau recherche, publiés ou non, émanant des établissements d’enseignement et de recherche français ou étrangers, des laboratoires publics ou privés.
Physiological constraints on the global distribution of
Trichodesmium ? effect of temperature on diazotrophy
E. Breitbarth, A. Oschlies, J. Laroche
To cite this version:
E. Breitbarth, A. Oschlies, J. Laroche. Physiological constraints on the global distribution of Tri-chodesmium ? effect of temperature on diazotrophy. Biogeosciences Discussions, European Geo-sciences Union, 2006, 3 (3), pp.779-801. �hal-00297814�
BGD
3, 779–801, 2006Nitrogen fixation and temperature E. Breitbarth et al. Title Page Abstract Introduction Conclusions References Tables Figures J I J I Back Close
Full Screen / Esc
Printer-friendly Version Interactive Discussion
EGU
Biogeosciences Discuss., 3, 779–801, 2006 www.biogeosciences-discuss.net/3/779/2006/ © Author(s) 2006. This work is licensed under a Creative Commons License.
Biogeosciences Discussions
Biogeosciences Discussions is the access reviewed discussion forum of Biogeosciences
Physiological constraints on the global
distribution of Trichodesmium – e
ffect of
temperature on diazotrophy
E. Breitbarth1,*,**, A. Oschlies2, and J. LaRoche1
1
Leibniz-Institute of Marine Sciences, IFM-GEOMAR, D ¨usternbrooker Weg 20, 24105 Kiel, Germany
2
National Oceanography Centre, Southampton, European Way, Southampton, SO14 3ZH, UK
*
now at: Department of Chemistry, Analytical and Marine Chemistry, G ¨oteborg University, Kemiv ¨agen 10, 412 96 G ¨oteborg, Sweden
**
now at: Division of Applied Geology, Department of Applied Chemistry and Geosciences, Lule ˚a University of Technology, 971 87 Lule ˚a, Sweden
Received: 7 April 2006 – Accepted: 28 April 2006 – Published: 26 June 2006 Correspondence to: E. Breitbarth ([email protected])
BGD
3, 779–801, 2006Nitrogen fixation and temperature E. Breitbarth et al. Title Page Abstract Introduction Conclusions References Tables Figures J I J I Back Close
Full Screen / Esc
Printer-friendly Version Interactive Discussion
EGU
Abstract
The cyanobacterium Trichodesmium is an important link in the global nitrogen cycle due to its significant input of atmospheric nitrogen into the ocean. Incorporating
Tri-chodesmium in ocean biogeochemical circulation models relies on field-based
corre-lations between temperature and Trichodesmium abundance. The observed
correla-5
tion of Trichodesmium abundance with temperature in the ocean may result in part from a direct effect on Trichodesmium growth rates through the control of cellular bio-chemical processes, or indirectly through its influence on mixed layer depth, light and nutrient regimes. Here we present results indicating that the observed correlation of
Trichodesmium with temperature in the field reflects primarily the direct physiological
10
effects of temperature on diazotrophic growth of Trichodesmium. Trichodesmium IMS-101 (an isolate of T. erythraeum) could acclimate and grow at temperatures ranging from 20 to 34◦C. Maximum growth rates (µmax=0.25 day−1) and maximum nitrogen fixation rates (0.13 mmol N mol POC−1 h−1) were measured within 24 to 30◦C. This empirical relationship and global warming scenarios derived from state-of-the-art
cli-15
mate models set a physiological constraint on the future distribution of Trichodesmium that could significantly affect nitrogen input into oligotrophic waters by this diazotroph.
1 Introduction
The diazotrophic filamentous cyanobacterium Trichodesmium plays a central role in the nitrogen and carbon cycle of oligotrophic oceans, contributing up to 80 Tg of fixed
20
nitrogen yr−1 (Capone et al., 1997). This represents a major fraction of the total ma-rine nitrogen fixation, currently estimated at 110 Tg yr−1(Gruber and Sarmiento, 1997). Furthermore, Trichodesmium can account for up to 47% of the primary production in the tropical North Atlantic Ocean (Carpenter et al., 2004) and contributes to export pro-duction via nitrogen fueling of the phytoplankton community (Letelier and Karl, 1996;
25
wa-BGD
3, 779–801, 2006Nitrogen fixation and temperature E. Breitbarth et al. Title Page Abstract Introduction Conclusions References Tables Figures J I J I Back Close
Full Screen / Esc
Printer-friendly Version Interactive Discussion
EGU
ters and its observed temperature distribution range (20◦C–30◦C) is used to constrain N2-fixation in ocean biogeochemical circulation models (OCBM) (Fennel et al., 2001; Hood et al., 2001, 2004). The upper temperature limit is set by current sea surface temperature (SST) maxima and not by observed physiological constraints of high tem-perature on Trichodesmium distribution. Parameterizations are based solely on field
5
correlations and cannot differentiate between direct and indirect effects of temperature on Trichodesmium growth and thus are of limited predictive value.
Distribution to higher latitudes with water temperatures below 20◦C appears to be due to drift rather then net growth. Nitrogen fixation by Trichodesmium was not ob-served in theses waters (Carpenter, 1983; Lipschultz and Owens, 1996), whereas
10
diazotrophic growth at temperatures close to freezing by other cyanobacteria, i.e.
Os-cillatoria sp. (Pandey et al., 2004) or Nostoc sp. (Zielke et al., 2002), is possible. An
upper temperature limit cannot readily be derived from field observations because the present sea surface temperatures rarely reach the observed upper tolerance limit for
Trichodesmium in tropical waters (Capone et al., 1997). A few exceptions are found
15
where blooms of Trichodesmium have been reported at water temperatures as high as 35◦C, however, these high temperatures may have been due to surface heating by heat absorption of the dense Trichodesmium mat and probably resulted in rapid cell lysis and death (Capone et al., 1998).
While empirical field correlations may be useful for parameterization of models, they
20
provide no information on the direct physiological effect of temperature on the growth, nitrogen fixation and C:N stoichiometry in Trichodesmium. A parameterization of mod-els using a physiological basis for the apparent temperature control of Trichodesmium distribution would provide an additional predictive value. Here we present the effect of temperature on nitrogen fixation, POC:PON and Chl-a:POC stoichiometry, and growth
25
for Trichodesmium IMS-101. We discuss the possible physiological basis for this re-lationship relative to other factors, such as light and nutrients, also affecting the distri-bution of Trichodesmium. Based on climate change scenarios and their effect on sea surface temperature increase within this century, we point out the importance of
un-BGD
3, 779–801, 2006Nitrogen fixation and temperature E. Breitbarth et al. Title Page Abstract Introduction Conclusions References Tables Figures J I J I Back Close
Full Screen / Esc
Printer-friendly Version Interactive Discussion
EGU
derstanding the physiology of Trichodesmium for their incorporation in OBCM and for predicting oceanic nitrogen input by this diazotroph in the future.
2 Materials and methods
2.1 Growth of cultures
An axenic culture of Trichodesmium IMS-101 was grown at temperatures ranging
be-5
tween 15 and 36◦C for at least three transfers (minimum of 15 generations) at each temperature, under a light:dark cycle of 12:12 h and a light intensity of 100 µmol quanta m−2s−1 using phosphorus and iron replete YBC II media without dissolved nitrogen added (Chen et al., 1996). Three independent attempts were made to acclimate
Tri-chodesmium to grow at temperatures lower than 20◦C and above 34◦C. The cultures
10
were transferred from the respective higher or lower temperatures where growth was detected as well as from well-growing cultures incubated at 25◦C.
2.2 Nitrogen fixation measurements
Nitrogen fixation rates were measured using the Acetylene Reduction Assay (ARA) (Capone, 1993), while calculations were modified after Breitbarth et al. (2004) and a
15
ratio of C2H2reduced: N2 reduced of 4:1 was used (Montoya et al., 1996). Gas sam-ples were analyzed on a Shimadzu GC-19B equipped with a flame ionization detector and a 30 m wide bore capillary column (0.53 mm, AluminaPlot®, Resteck, USA). The oven temperature was set at 40◦C, injector and detector temperature at 200◦C, and the carrier gas flow (N2) at 14.5 ml min−1, which yielded optimal peak separation and
20
detection limits. Three replicates for each temperature were incubated simultaneously for 4 h in 20.2 ml headspace vials containing 19 ml culture and 1.2 ml headspace with 0.4 ml acetylene added. ARAs were carried out for three individual times on semi-continuously growing cultures. Nitrogen fixation rates were normalized to POC.
BGD
3, 779–801, 2006Nitrogen fixation and temperature E. Breitbarth et al. Title Page Abstract Introduction Conclusions References Tables Figures J I J I Back Close
Full Screen / Esc
Printer-friendly Version Interactive Discussion
EGU
2.3 Biomass and elemental stoichiometry
For biomass determinations, samples were filtered (GF/F, pre-combusted for elemental analysis) and stored at −20◦C until further analysis. Particulate organic nitrogen (PON) and particulate organic carbon (POC) contents of the cultures were determined after Sharp (1975) and Ehrhard and Koeve (1999). Frozen filters were dried for 48 h at 45◦C
5
and thereafter measured using an elemental analyzer (Euro-EA, Hekatech, Germany) equipped with a chromium-oxid/cobalt-oxid oxidation reactor, a copper reduction reac-tor, and a CHN column at an oven temperature of 45◦C. Carrier gas flow (He) was set at 96 ml min−1. The data were blank corrected using measurements of similarly treated filters without culture material.
10
The chlorophyll-a concentrations were analyzed fluorometrically based on Welschmeyer (1994) after bursting the cells in 90% Acetone by shaking and refreez-ing for 24 h. Results obtained from this simple extraction method were comparable to those made by mechanical disruption of the cells (data not shown).
Maximum specific growth rates (µ) were determined by identifying the exponential
15
growth phase in the batch cultures and applying a linear fit to the respective natural logarithm transformed POC, PON and Chl-a values. The slope of the regression rep-resents the growth rate.
2.4 Photosystem response measurements
The photosynthetic quantum use efficiency of the photosystem II was measured
us-20
ing a PhytoPAM equipped with Optical Unit ED-101US/MP (Walz, Germany) based on Kolbowski and Schreiber (1995). The ratios of variable to maximal fluorescence (Fv/Fm) of Trichodesmium IMS-101 in response to different incubation temperatures were recorded over the complete growth period of the cultures at the respective tem-peratures. Further, Fv/Fm was measured on cultures grown at 25◦C after short-term
25
exposure (4 h) to a temperature range of 14◦C to 36◦C. Samples were dark-adapted for 10 min prior to the measurements.
BGD
3, 779–801, 2006Nitrogen fixation and temperature E. Breitbarth et al. Title Page Abstract Introduction Conclusions References Tables Figures J I J I Back Close
Full Screen / Esc
Printer-friendly Version Interactive Discussion
EGU
2.5 Sea surface temperature increase predictions
Predictions of the increase in sea surface temperature (SST) were based on two cou-pled atmosphere-ocean general circulation models (HadCM3 and GFDL) to current annual SST (Levitus and Boyer, 1994). Both models predict a SST increase of up to 3◦C by 2090 in our area of interest (20–30◦C isotherms). The HadCM3 model run
5
(Gordon et al., 2000) is based on the assumption that future emissions of greenhouse gases will follow the IS92a “business as usual” scenario with observed atmospheric CO2concentrations until 1990 and a 1% annual increase thereafter
(http://www.met-office.gov.uk/research/hadleycentre/models/modeldata.html).
This prognosis is generally consistent with results from a similar experiment using
10
the GFDL R30 climate model (Delworth et al., 2002) (http://www.gfdl.noaa.gov/∼kd/
ClimateDynamics/NOMADS/index.html). The SST changes predicted by the climate models over the next century are then added to current mean SSTs and the area of various physiologically relevant temperature ranges is computed.
3 Results
15
3.1 Growth and nitrogen fixation
Our results demonstrate that Trichodesmium IMS-101 grows and fixes nitrogen at tem-peratures between 20–34◦C (Fig. 1). The cultures did not grow below 20◦C or above 34◦C. Cultures could be maintained alive at 17◦C for several weeks, but biomass pro-gressively decreased. Incubations at water temperatures of 36◦C resulted in cell death
20
and lysis after two days (data not shown). Growth rates did not differ significantly between chlorophyll−a, carbon or nitrogen specific growth, with the exception of car-bon and nitrogen specific growth rates being higher than chlorophyll specific growth rates at 30◦C. No differences in growth rates were detected, when cultures were trans-ferred from similar or adjacent incubation temperatures or originated from 25◦C
BGD
3, 779–801, 2006Nitrogen fixation and temperature E. Breitbarth et al. Title Page Abstract Introduction Conclusions References Tables Figures J I J I Back Close
Full Screen / Esc
Printer-friendly Version Interactive Discussion
EGU
bations. Maximum specific growth rates (µmax) of the axenic Trichodesmium IMS-101 strain were optimum between 24–30◦C, with a peak at 27◦C (µmaxcarbon specific=0.25 day−1, Fig. 1). Growth rates were significantly reduced below and above this tempera-ture range.
Nitrogen fixation rates were significantly affected by temperature and followed closely
5
the relationship observed for growth rate versus temperature, showing a temperature optimum between 24–30◦C as well. Maximum nitrogen fixation rates of 0.13 mmol N mol POC−1h−1were measured at 27◦C. Triplicate experiments with semi-continuously growing cultures yielded similar temperature relationships (Fig. 1).
3.2 Elemental stoichiometry
10
These observations were supported by measurements of elemental stoichiometry. The cellular carbon to nitrogen ratio increased from 5.4 (mol:mol) at 20◦C to a maximum of 6.8 at 25◦C. This ratio equals approximately the Redfield ratio (6.6). At higher tem-peratures the POC:PON stoichiometry decreased again to a minimum value of 4.1 at 34◦C (Fig. 2). The data shown are derived from measurements throughout the growth
15
period of the batch incubations. As previously reported by Mulholland and Capone (2001), POC:PON ratios varied over the growth period and were reduced during the exponential growth phase, which is a characteristic of high N2-fixation. A compara-tively high POC:PON stoichiometry was measured at 17◦C (9.1). However, it is not clear whether or not this is an artifact created because Trichodesmium could not grow
20
at this low temperature.
Further, the cellular chlorophyll-a to carbon ratio increased linearly from 0.0044 (g:g) at 17◦C to 0.0194 at 34◦C (Fig. 3a) reflecting an acclimation response of the photosyn-thetic apparatus to temperature (Geider et al., 1997).
BGD
3, 779–801, 2006Nitrogen fixation and temperature E. Breitbarth et al. Title Page Abstract Introduction Conclusions References Tables Figures J I J I Back Close
Full Screen / Esc
Printer-friendly Version Interactive Discussion
EGU
3.3 Photosystem response
The photosynthetic quantum yield efficiency (Fv/Fm) of cultures acclimated to their growth temperature increased from below 0.10 at 17◦C up to a maximum quantum yield of 0.68 at 30◦C. As there was considerable variation of Fv/Fm as a function of physio-logical differences during growth in batch cultures, only samples from the exponential
5
growth phase were plotted in Fig. 4a. Here, the average quantum yield efficiency in-creased from 0.20 at the minimum feasible growth temperature (20◦C) to 0.52 at 27◦C and remained constant up to 34◦C. Maximum values did not exceed 0.60 (Fig. 4a). In contrast, Fv/Fm measurements of Trichodesmium grown at 25◦C and transferred to a range of temperatures (4 h incubations) were positively correlated with temperature
10
and increased linearly from approximately 0.25 at 14◦C to the maximum of 0.60 at the maximum growth temperature (34◦C). This demonstrates that the photosynthetic ap-paratus adjusted slowly to changes in temperature. Measurements at 36◦C showed reduced Fv/Fm values again (Fig. 4b).
3.4 Potential effects of predicted SST increase on Trichodesmium distribution
15
The modeled sea surface temperature (SST) increase of up to 3◦C by 2090 in our area of interest (20–30◦C isotherms) predicts a poleward shift of the 20◦C isotherm (Fig. 5). This results in an 11% areal increase of Trichodesmium’s potential geographic distribution. Second, maximum calculated SSTs will still be less than 34◦C, which will not limit the potential distribution of Trichodesmium in tropical waters. Nevertheless,
20
a decrease in the area characterized by optimum growth and N2-fixation conditions (24–30◦C) by about 16% is anticipated (Fig. 5).
4 Discussion
Temperature per se does not restrict diazotrophic growth and nitrogen fixers can be en-countered at temperatures close to freezing (Zielke et al., 2002; Pandey et al., 2004),
BGD
3, 779–801, 2006Nitrogen fixation and temperature E. Breitbarth et al. Title Page Abstract Introduction Conclusions References Tables Figures J I J I Back Close
Full Screen / Esc
Printer-friendly Version Interactive Discussion
EGU
yet the overall distribution of Trichodesmium in the contemporary ocean appears well constrained by seawater temperature (∼20–30◦C)(Capone et al., 1997). However, the correlation of water temperature with Trichodesmium abundance is generally attributed to oceanographic features associated with warm waters, such as shallow mixed layer depth, high light regimes and oligotrophic nutrient conditions rather than a direct
phys-5
iological response to temperature itself (Hood et al., 2004). Since water temperature and dissolved nitrate concentrations are significantly negatively correlated in the ma-rine environment, it is not certain whether the global patterns of N2-fixation versus water temperature are due to an inhibition of nitrogenase by low temperature or a selection against N2-fixers under conditions of high nitrate or both. In this work, we
10
separated the effect of temperature from other factors (i.e. nutrients, light, and stratifi-cation) on diazotrophic growth and thus were able to demonstrate that, as suggested by Capone et al. (1997), seawater temperature sets a physiological constraint on the geographic distribution of Trichodesmium.
We were able to demonstrate that the strain IMS-101 of Trichodesmium is adapted to
15
optimum growth temperatures between 24 and 30◦C, and can tolerate water tempera-tures from 20 to 34◦C. Analogous to our results, positive correlations of Trichodesmium abundance and water temperature (22–28/31◦C) were also observed in field studies (Capone et al., 1997; Lin, 2002; Lugomela et al., 2002; Chen et al., 2003). However, our observation that cells can survive at 17◦C for several weeks and experience a slow
20
decrease in biomass, can also explain the persistence of Trichodesmium transported into higher latitudes by oceanic currents (Carpenter, 1983; Lipschultz and Owens, 1996).
In contrast to our finding of an optimum temperature rage between 24 and 30◦C, Staal et al. (2003) described a linear increase of nitrogen fixation up to a temperature
25
of 36◦C in short-term incubations (2 min, M. Staal, personal communication). Mea-surements published by Staal et al. (2003) most likely reflected nitrogenase enzyme kinetics, whereas data presented here describe temperature acclimated diazotrophic growth (Fig. 1). This is based on the physiologic patterns of maximum nitrogen
fixa-BGD
3, 779–801, 2006Nitrogen fixation and temperature E. Breitbarth et al. Title Page Abstract Introduction Conclusions References Tables Figures J I J I Back Close
Full Screen / Esc
Printer-friendly Version Interactive Discussion
EGU
tion activity, highest growth rates, cellular elemental composition, and photosynthetic quantum yield efficiency. The maximum growth rates and high nitrogen fixation rates between 24 and 30◦C must be accompanied by high carbon fixation rates, which is expressed in near Redfield POC:PON stoichiometry. At lower or higher temperatures the POC:PON ratio was reduced. This stoichiometric shift can be due to high nitrogen
5
to carbon incorporation rates and may reflect the relative distribution of photochemical energy utilization between carbon fixation and nitrogen fixation. At the low end of the temperature tolerance range, both carbon fixation and nitrogen fixation may be energy limited, driving the POC:PON ratio close to that of pure protein (Geider and La Roche, 2002), while the reduced POC:PON ratio at higher temperatures may reflect increased
10
carbon respiration rates (Fig. 3). As an effect of temperature though, a larger fraction of fixed N2may be released and not incorporated into the cells when either carbon fixation is insufficient, or cells may become leakier due to increased membrane permeability at higher temperatures. The temperature acclimation of the chlorophyll-a:POC ratio reflects the need to reduce light absorption at low temperatures in order to equilibrate
15
with lower enzyme activity, while this mechanism is relieved at higher temperatures. Factors, such as light and nutrient regimes directly interact with temperature and will also play determinant roles. Photosynthetic organisms will acclimate to both light and temperature, by adjusting the balance between light energy absorption and the rate of the dark reaction of photosynthesis, however in an opposite way, i.e. by
increas-20
ing light absorption in low light and decreasing it at low temperature (Geider et al., 1997; Miskiewicz et al., 2002). The photosynthetic quantum use efficiency clearly re-flects a physiological adaptation to the temperature tolerance range of Trichodesmium (IMS-101). In short term incubations Fv/Fm measurements increased linear up to the physiological maximum temperature of 34◦C. Measurements of cultures growing
ex-25
ponentially at the respective temperatures though reveal that the photosystem II oper-ated at minimum efficiency at 20◦C and saturated at maximum efficiencies between 27 and 34◦C. Thus, the temperature tolerance range of Trichodesmium IMS-101 grown at 100 µmol quanta m−2s−1is also confined by the general range of photosynthetic
quan-BGD
3, 779–801, 2006Nitrogen fixation and temperature E. Breitbarth et al. Title Page Abstract Introduction Conclusions References Tables Figures J I J I Back Close
Full Screen / Esc
Printer-friendly Version Interactive Discussion
EGU
tum yield efficiency for cyanobacteria (0.20–0.60, Fig. 4a). One can hypothesize that the high temperature optimum for Trichodesmium growth leads to a better tolerance of high light intensity, which is characteristic of tropical and sub-tropical regions.
While we cannot fully explain the biochemical basis for the physiological constraint to the observed temperature range, a combination of several mechanisms is likely. In
5
Trichodesmium, the timing of nitrogen fixation and photosynthesis has been shown to
be under the control of a circadian rhythm (Chen et al., 1998) and the temperature tolerance range may be in part set by the temperature compensation range of the circadian clock. Further, the photochemical reactions themselves are temperature de-pendent due to enzyme kinetics and membrane permeability (Falkowski and Raven,
10
1997). It has been shown for terrestrial plants that Rubisco activase has a lower tem-perature tolerance than Rubisco itself. Rubisco activase is not capable of maintaining Rubisco in an active form at growth temperatures outside the thermal environment to which the organism is adapted to (Crafts-Brandner and Salvucci, 2000; Salvucci and Crafts-Brandner, 2004a, b). It is possible, but remains to be demonstrated, that such
15
a mechanism also limits the photophysiology of Trichodesmium at the high end of the temperature tolerance range.
Overall, the mechanisms determining the optimal growth temperature in microorgan-isms are poorly characterized but, at the most basic level, must be controlled by their genetic composition. Genomic analysis of psychrophilic bacteria revealed that
cold-20
adaptation is not just a function of a specific set of proteins but also dependent on the general amino acid composition of the proteins and membrane fluidity and permeability (Methe et al., 2005). Diazotrophs in general can grow at all temperatures. In partic-ular, Oscillatoria, a close relative of Trichodesmium is found in the Antarctic (Pandey et al., 2004). Phylogenetic analysis of the hetR gene, which is most likely involved in
25
heterocyst and diazocyst development, revealed a high diversity level within the
Tri-chodesmium clade (Mes and Stal, 2005). Thus, although the strain TriTri-chodesmium
IMS-101 did not adapt to growth at higher and lower temperatures in our experiments, other uncultivated strains may be capable of growth outside this temperature range.
BGD
3, 779–801, 2006Nitrogen fixation and temperature E. Breitbarth et al. Title Page Abstract Introduction Conclusions References Tables Figures J I J I Back Close
Full Screen / Esc
Printer-friendly Version Interactive Discussion
EGU
Acknowledging that we lack information on the physiological variability within the genus Trichodesmium, we carefully suggest that future changes in SST may result in an 11% areal increase of Trichodesmium’s potential geographic distribution due to the poleward shift of the 20◦C isotherm, while the maximum calculated SSTs (34◦C) will not be limiting diazotrophy of Trichodesmium in tropical waters. However, because
5
of the much higher N2-fixation rates and the growth physiology of Trichodesmium in the 24–30◦C SST range, the effect of the 16% decrease in the area characterized by optimum growth and N2-fixation conditions (24–30◦C) is likely to outweigh the positive effect of the latitudinal increase of the total area (Fig. 5). Thus, the predicted over all sea surface temperature increase may result in a net decrease of N2-fixation by
10
Trichodesmium by the end of this century. The effects on oceanic nitrogen cycling may
be significant, taken the global importance of this diazotroph into account (Capone et al., 1997; Capone and Carpenter, 1999). As aforementioned, these predictions are based solely on the growth temperature relationship for Trichodesmium IMS-101. Additionally, our hypothesis is based on SST only and does not account for possible
15
changes in nutrient supply and light conditions, which will also be affected by SST increase and to date, are more difficult to predict than SST.
To date, predictions of future marine nitrogen fixation diverge. In contrast to our findings, Boyd and Doney (2002) predict a future increase of N2-fixation by 27% (from 80 to 94 Tg yr−1) due to a floristic shift towards diazotrophy by Trichodesmium caused
20
by combined effects of mixed layer depth (MLD), stratification, and nutrient regimes. Time series measurements near Hawaii (Karl et al., 1997) support this trend. Al-though, SSTs in this area of the North Pacific are estimated to increase by almost 3◦C (Figs. 5a+b) they do not exceed the physiologically optimal range. Nevertheless, large regions of the tropical and subtropical oceans are predicted to fall outside the
25
optimal range. Particularly temperatures rising above 30◦C in N2-fixation hotspots may result in significant changes of the regional nitrogen budgets. In the North Atlantic, for example, SSTs are predicted to exceed 30◦C in the Caribbean Sea as well as in equatorial waters off West Africa, all of which are currently hotspots of N2fixation in a
BGD
3, 779–801, 2006Nitrogen fixation and temperature E. Breitbarth et al. Title Page Abstract Introduction Conclusions References Tables Figures J I J I Back Close
Full Screen / Esc
Printer-friendly Version Interactive Discussion
EGU
model based on field observations, MLD and light (Hood et al., 2004). Similarly high SSTs are predicted for the western Pacific and a large part of the Indian Ocean, which both are characteristic provinces for present-day Trichodesmium abundance (LaRoche and Breitbarth, 2005).
Whether or not a global SST increase in the future ocean will result in a decrease in
5
Trichodesmium rests on the physiological bases for the temperature dependence of
ni-trogen fixation and on the relative importance of temperature with regards to other fac-tors such as water column stability, nutrient availability and light intensity. Conversely, the development of nitrogen fixation hotspots in the future ocean largely depends on feasible physical and chemical conditions in addition to temperature.
10
A community shift towards other (unicellular) diazotrophs is also possible. Until re-cently, the significance of unicellular N2-fixers has been underestimated (Montoya et al., 2004). Although many of the unicellular diazotrophic cyanobacteria are not yet cultured, the obtainable information, either from field evidence or from the few avail-able isolates suggest that these groups also have temperature optima in the range of
15
26–30◦C (Mazard et al., 2004; Falc ´on et al., 2005). In the tropical/sub-tropical North Atlantic Ocean nifH genes, indicative of the presence of diazotrophs, were recovered from water temperatures between 20 and 30◦C, and were mostly prominent between 26–30◦C. However, a few samples from temperatures below 20◦C also contained nifH genes, suggesting that some marine diazotrophs may also dwell in cold water
(Lan-20
glois et al., 2005). Whether or not these unicellular cyanobacteria are actively fixing nitrogen, or if they can potentially fill niches for nitrogen fixers at the lower or higher temperature range remains to be investigated.
In conclusion, our results demonstrate that the temperature adaptation of
Tri-chodesmium IMS-101 controls the geographic distribution of this species. Based on the
25
physiological constraints of diazotrophic growth of Trichodesmium IMS-101, we sug-gest reduced fixed nitrogen input by Trichodesmium in response to the SST increase predicted for the end of this century. Although SSTs are expected to rise essentially everywhere, the area of surface waters with temperatures in the physiologically
op-BGD
3, 779–801, 2006Nitrogen fixation and temperature E. Breitbarth et al. Title Page Abstract Introduction Conclusions References Tables Figures J I J I Back Close
Full Screen / Esc
Printer-friendly Version Interactive Discussion
EGU
timal range for growth of Trichodesmium will likely decline. We expect that, within the areal limits imposed by the SST, a combination of other controlling factors such as MLD, light, and nutrient regimes (including iron) will further restrict Trichodesmium distribution. Considering the large fraction of N2-fixation by Trichodesmium on total oceanic nitrogen input, the predicted ecophysiological changes to this diazotroph may
5
cause significant changes in global biogeochemical cycles. Nevertheless, because lit-tle is known about temperature selection on other diazotrophs, we do not know what the overall dynamics of N2 fixation in the future ocean will be. As N2-fixation in cur-rently available ocean biogeochemical circulation models is based on Trichodesmium, it may be necessary to adjust their parameterizations with regard to the here presented
10
temperature-diazotrophic growth relationships in addition of taking other diazotrophs into account.
Acknowledgements. We thank G. Petrick and U. Rabsch for technical advice and assistance.
We also thank J. Waterbury for the axenic Trichodesmium IMS-101 culture. The experimental work was funded by EU-project IRONAGES (EVK2-CT–1999-00031) awarded to J. LaRoche.
15
References
Boyd, P. W. and Doney, S. C.: Modeling regional responses by marine pelagic ecosystems to global climate change, Geophys. Res. Lett., 29(16), 53,1–53,4, 2002.
Breitbarth, E., Mills, M. M., Friedrichs, G., and LaRoche, J.: The bunsen gas solubility coef-ficient of ethylene as a function of temperature and salinity and its importance for nitrogen
20
fixation assays, Limnology and Oceanography: Methods, 2, 282–288, 2004.
Capone, D. G.: Determination of nitrogenase activity in aquatic samples using the acetylene reduction procedure, Handbook of Methods in Aquatic Microbial Ecology, 1993.
Capone, D. G. and Carpenter, E. J.: Nitrogen fixation by marine cyanobacteria: historical and global perspectives, Bulletin de l’Oceanographique Monaco, special issue 19, 235–256,
25
1999.
BGD
3, 779–801, 2006Nitrogen fixation and temperature E. Breitbarth et al. Title Page Abstract Introduction Conclusions References Tables Figures J I J I Back Close
Full Screen / Esc
Printer-friendly Version Interactive Discussion
EGU
cyanobacterium Trichodesmium erythraeum in the central Arabian Sea, Marine Ecology-Progress Series, 172, 281–292, 1998.
Capone, D. G., Zehr, J. P., Pearl, H. W., et al.: Trichodesmium, a globally significant marine cyanobacterium, Sci., 276, 5316, 1221–1229, 1997.
Carpenter, E. J.: Physiology and ecology of marine planktonic Oscillatoria (Trichodesmium),
5
Marine Biol. Lett., 4, 69–85, 1983.
Carpenter, E. J., Subramaniam, A., and Capone, D. G.: Biomass and primary productivity of the cyanobacterium Trichodesmium spp. in the tropical N Atlantic ocean, Deep-Sea Res. I, 51(2), 173–203, 2004.
Chen, Y. B., Dominic, B., Mellon, M. T., and Zehr, J. P.: Circadian rhythm of nitrogenase
10
gene expression in the diazotrophic filamentous nonheterocystous cyanobacterium
Tri-chodesmium sp. strain IMS 101, J. Bacteriol., 180(14), 3598–3605, 1998.
Chen, Y. B., Zehr, J. P., and Mellon, M.: Growth and nitrogen fixation of the diazotrophic fila-mentous nonheterocystous cyanobacterium Trichodesmium sp. IMS 101 in defined media: Evidence for a circadian rhythm, J. Phycology, 32(6), 916–923, 1996.
15
Chen, Y. L. L., Chen, H. Y., Lin, Y. H., et al.: Distribution and downward flux of Trichodesmium in the South China Sea as influenced by the transport from the Kuroshio Current, Marine Ecology-Progress Series, 259, 47–57, 2003.
Crafts-Brandner, S. J. and Salvucci, M. E.: Rubisco activase constrains the photosynthetic potential of leaves at high temperature and CO2, Proceedings of the National Academy of
20
Sciences of the United States of America, 97(24), 13 430–13 435, 2000.
Delworth, T. L., Stouffer, R. J., Dixon, K. W., et al.: Review of simulations of climate variability and change with the GFDL R30 coupled climate model., Climate Dynamics, 19, 555–574, 2002.
Ehrhard, M. and Koeve, W.: Determination of particulate organic carbon and nitrogen, Methods
25
of Seawater Analysis, 437–444, 1999.
Falc ´on, L. I., Pluvinage, S., and Carpenter, E. J.: Growth kinetics of marine unicellular N2-fixing cyanobacterial isolates in continuous culture in relation to phosphorus and temperature, Ma-rine Ecol. Prog. Ser., 285(3–9), 2005.
Falkowski, P. G. and Raven, J. A.: Aquatic Photosynthesis, Blackwell Science, Malden, MA,
30
USA, 375, 1997.
Fennel, K., Spitz, Y. H., Letelier, R. M., et al.: A deterministic model for N-2 fixation at stn. ALOHA in the subtropical North Pacific Ocean, Deep-Sea Res. II, 49(1–3), 149–174, 2001.
BGD
3, 779–801, 2006Nitrogen fixation and temperature E. Breitbarth et al. Title Page Abstract Introduction Conclusions References Tables Figures J I J I Back Close
Full Screen / Esc
Printer-friendly Version Interactive Discussion
EGU
Geider, R. J. and La Roche, J.: Redfield revisited: variability of C:N:P in marine microalgae and its biochemical basis, European J. Phycol., 37(1–17), 2002.
Geider, R. J., MacIntyre, H. L., and Kana, T. M.: Dynamic model of phytoplankton growth and acclimation: Responses of the balanced growth rate and the chlorophyll a:carbon ratio to light, nutrient-limitation and temperature, Marine Ecol. Prog. Ser., 148(1–3), 187–200, 1997.
5
Gordon, C., Cooper, C., Senio, C. A., et al.: The simulation of SST, sea ice extents and ocean heat transports in a version of the Hadley Centre coupled model without flux adjustments., Climate Dynamics, 16, 147–168, 2000.
Gruber, N. and Sarmiento, J. L.: Global patterns of marine nitrogen fixation and denitrification, Global Biogeochem. Cycles, 11(2), 235–266, 1997.
10
Hood, R. R., Bates, N. R., Capone, D. G., and Olson, D. B.: Modeling the effect of nitrogen fixation on carbon and nitrogen fluxes at BATS, Deep-Sea Res. II, 48(8–9), 1609–1648, 2001.
Hood, R. R., Coles, V. J., and Capone, D. G.: Modeling the distribution of
Tri-chodesmium and nitrogen fixation in the Atlantic Ocean, J. Geophys. Res., 109(6), L06301,
15
doi:10.1029/2002JC001753, 2004.
Karl, D., Letelier, R., Tupas, L., et al.: The role of nitrogen fixation in biogeochemical cycling in the subtropical North Pacific Ocean, Nature, 388, 6642, 533–538, 1997.
Kolbowski, J. and Schreiber, U.: Computer-controlled phytoplankton analyzer based on 4-wavelengths PAM chlorophyll fluorometer, Photosynthesis: from Light to Biosphere, V, 825–
20
828, 1995.
Langlois, R. J., LaRoche, J., and Raab, P. A.: Diazotrophic diversity and distribution in the tropical and subtropical Atlantic ocean, Appl. Environ. Microbiol., 71(12), 7910–7919, 2005. LaRoche, J. and Breitbarth, E.: Importance of the diazotrophs as a source of new nitrogen in
the ocean, J. Sea Res., 53(1–2), 67–91, 2005.
25
Letelier, R. M. and Karl, D. M.: Role of Trichodesmium spp. in the productivity of the subtropical North Pacific Ocean, Marine Ecol. Prog. Ser., 133(1–3), 263–273, 1996.
Levitus, S. and Boyer, T.: Temperature, World Ocean Atlas 1994, 4, 1994.
Lin, Y. H.: The spatial and temporal distributions of nitrogen fixation cyanobacterium
Tri-chodesmium spp. and Richelia intracellularis in South China Sea, 2002.
30
Lipschultz, F. and Owens, N. J. P.: An assessment of nitrogen fixation as a source of nitrogen to the North Atlantic Ocean, Biogeochemistry, 35(1), 261–274, 1996.
BGD
3, 779–801, 2006Nitrogen fixation and temperature E. Breitbarth et al. Title Page Abstract Introduction Conclusions References Tables Figures J I J I Back Close
Full Screen / Esc
Printer-friendly Version Interactive Discussion
EGU
diversity, seasonality, nitrogen and carbon fixation, Hydrobiologia, 477, 1–13, 2002.
Mazard, S. L., Fuller, N. J., Orcutt, K. M., et al.: PCR Analysis of the Distribution of Unicellular Cyanobacterial Diazotrophs in the Arabian Sea, Appl. Environ. Microbiol., 70(12), 7355– 7364, 2004.
Mes, T. H. M. and Stal, L. J.: Variable selection pressures across lineages in Trichodesmium
5
and related cyanobacteria based on the heterocyst differentiation protein gene hetR, Gene, 346, 163–171, 2005.
Methe, B. A., Nelson, K. E., Deming, J. W., et al.: The psychrophilic lifestyle as revealed by the genome sequence of Colwellia psychrerythraea 34H through genomic and proteomic analyses, Proceedings of the National Academy of Sciences of the United States of America,
10
102(31), 10 913–10 918, 2005.
Miskiewicz, E., Ivanov, A. G., and Huner, N. P. A.: Stoichiometry of the photosynthetic appa-ratus and phycobilisome structure of the cyanobacterium Plectonema boryanum UTEX 485 are regulated by both light and temperature, Plant Physiology, 130(3), 1414–1425, 2002. Montoya, J. P., Holl, C. M., Zehr, J. P., et al.: High rates of N2 fixation by unicellular diazotrophs
15
in the oligotrophic Pacific Ocean, Nature, 430, 1027–1031, 2004.
Montoya, J. P., Voss, M., Kaehler, P., and Capone, D. G.: A simple, precision, high-sensitivity tracer assay for N-2 fixation, Appl. Environ. Microbiol., 62(3), 986–993, 1996. Mulholland, M. R. and Capone, D. G.: Stoichiometry of nitrogen and carbon utilization in
cultured populations of Trichodesmium IMS101: Implications for growth, Limnology and
20
Oceanography, 46, 2, 436–443, 2001.
Pandey, K. D.,Shukla, S. P., Shukla, P. N., et al.: Cyanobacteria in Antarctica: Ecology, physiol-ogy and cold adaptation, Cellular and Molecular Biolphysiol-ogy, 50(5), 575–584, 2004.
Salvucci, M. E. and Crafts-Brandner, S. J.: Inhibition of photosynthesis by heat stress: the activation state of Rubisco as a limiting factor in photosynthesis, Physiol. Plant, 120(2), 179–
25
186, 2004a.
Salvucci, M. E. and Crafts-Brandner, S. J.: Relationship between the heat tolerance of pho-tosynthesis and the thermal stability of rubisco activase in plants from contrasting thermal environments, Plant Physiology, 134(4), 1460–1470, 2004b.
Sharp, J. H.: Improved analysis for particulate organic carbon and nitrogen from seawater,
30
Limnology and Oceanography, 19, 345–350, 1975.
Staal, M., Meysman, F. J. R., and Stal, L. J.: Temperature excludes N-2-fixing heterocystous cyanobacteria in the tropical oceans, Nature, 425, 6957, 504–507, 2003.
BGD
3, 779–801, 2006Nitrogen fixation and temperature E. Breitbarth et al. Title Page Abstract Introduction Conclusions References Tables Figures J I J I Back Close
Full Screen / Esc
Printer-friendly Version Interactive Discussion
EGU
Welschmeyer, N. A.: Fluorometric analysis of chlorophyll-a in the presence of chlorophyll b and phaeopigments, Limnology and Oceanography, 39(8), 1985–1992, 1994.
Zielke, M., Ekker, A. S., and Olsen, R. A.: The Influence of Abiotic Factors on Biological Nitro-gen Fixation in Different Types of Vegetation in the High Arctic, Svalbard, Arctic, Antarctic, and Alpine Res., 34(3), 293–299, 2002.
BGD
3, 779–801, 2006Nitrogen fixation and temperature E. Breitbarth et al. Title Page Abstract Introduction Conclusions References Tables Figures J I J I Back Close
Full Screen / Esc
Printer-friendly Version Interactive Discussion EGU 15 20 25 30 35 40 temperature °C 0 0.04 0.08 0.12 mm ol N 2 fi x e d m o l P O C -1 h -1 0 0.1 0.2 0.3 m a xi m u m sp e c if ic g ro w th r a te d -1 Fig. 1
Fig. 1. Maximum carbon (x, orange), nitrogen (x, blue) and chlorophyll−a (x, green) specific
growth rates as a function of temperature. The green line denotes the function of chlorophyll-a specific growth based on the polynomial function:
µ= 2.29−5x4− 2.50−3x3+ 9.71−2x2+ 1.58x + 9.15 (1)
where x denotes temperature in◦C. Black triangles and circles describe carbon specific nitro-gen fixation rates as a function of temperature. Different symbols denote individual measure-ment series.
BGD
3, 779–801, 2006Nitrogen fixation and temperature E. Breitbarth et al. Title Page Abstract Introduction Conclusions References Tables Figures J I J I Back Close
Full Screen / Esc
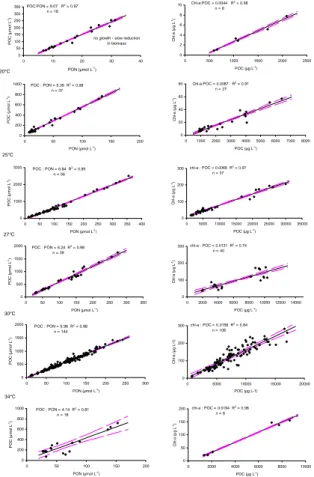
Printer-friendly Version Interactive Discussion EGU 17°C 0 50 100 150 200 250 300 350 0 10 20 30 40 PON (µmol L-1) Fig. 2 PO C ( µ m o l L ) -1 POC:PON = 9.07 R2 = 0.97 n = 18
no growth - slow reduction in biomass 0 2 4 6 8 10 0 500 1000 1500 2000 2500 POC (µg L-1) Ch l-a ( µ g L -1) Chl-a:POC = 0.0044 R2 = 0.98 n = 6 20°C 0 200 400 600 800 1000 0 50 100 150 200 PON (µmol L-1) PO C ( µ m o l L -1 POC : PON = 5.39 R2 = 0.98 n = 37 ) 0 20 40 60 80 0 1000 2000 3000 4000 5000 6000 7000 8000 POC (µg L-1) Ch l-a ( µ g L -1) Chl-a:POC = 0.0087 R2 = 0.91 n = 27 25°C 0 1000 2000 3000 0 50 100 150 200 250 300 350 400 PON (µmol L-1) PO C ( µ m o l L -1 POC : PON = 6.84 R2 = 0.99 n = 56 ) 0 100 200 300 0 5000 1000015000 2000025000 3000035000 POC (µg L-1) C h l-a (µ g L -1) chl-a : POC = 0.0068 R2 = 0.97 n = 37 27°C 0 500 1000 1500 2000 0 50 100 150 200 250 300 350 PON (µmol L-1) -1 POC : PON = 6.24 R2 = 0.98 n = 39 ) PO C ( µ m o l L 0 100 200 300 0 2000 4000 6000 8000 100001200014000 POC (µg L-1) C h l-a (µ g L -1) chl-a : POC = 0.0131 R2 = 0.74 n = 40 30°C 0 500 1000 1500 2000 0 50 100 150 200 250 300 PON (µmol L-1) POC : PON = 5.96 R2 = 0.98 n = 144 PO C ( µ m o l L -1) 0 100 200 300 0 5000 10000 15000 20000 POC (µg L-1) C h l-a ( µ g L-1 ) chl-a : POC = 0.0158 R2 = 0.84 n = 108 34°C 0 200 400 600 800 1000 0 50 100 150 200 PON (µmol L-1) POC : PON = 4.14 R2 = 0.81 n = 18 0 50 100 150 200 0 2000 4000 6000 8000 10000 POC (µg L-1) C h l-a (µ g L -1) chl-a : POC = 0.0194 R2 = 0.98 n = 6 PO C ( µ m o l L -1)
Fig. 2. Overview of POC:PON (mol:mol) and chl-a:POC (weight:weight) stoichiometry of
Tri-chodesmium IMS-101 versus temperature. Solid lines describe regressions of the data versus
temperature. The regression coefficient represents the stoichiometric ratio and is included in each plot together with the coefficient of determination (R2) and the sample size (n).
BGD
3, 779–801, 2006Nitrogen fixation and temperature E. Breitbarth et al. Title Page Abstract Introduction Conclusions References Tables Figures J I J I Back Close
Full Screen / Esc
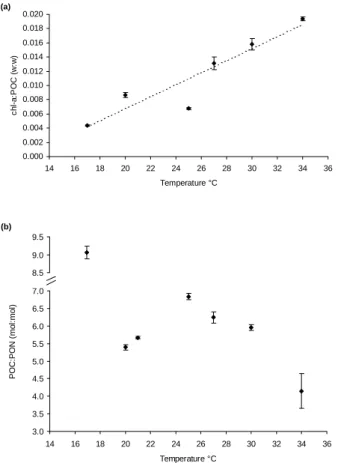
Printer-friendly Version Interactive Discussion EGU 3.0 3.5 4.0 4.5 5.0 5.5 6.0 6.5 7.0 14 16 18 20 22 24 26 28 30 32 34 36 Temperature °C POC: PON ( m o l: m o l) .. 8.5 9.0 9.5 14 15 16 17 18 (b) 0.000 0.002 0.004 0.006 0.008 0.010 0.012 0.014 0.016 0.018 0.020 14 16 18 20 22 24 26 28 30 32 34 36 Temperature °C ch l-a :P O C ( w :w ) (a) Fig 3:
Fig. 3. Stoichiometry chl-a:POC (weight:weight, (a) and POC:PON (mol:mol, (b) of
Tri-chodesmium IMS-101 as a function of growth temperature. Data points represent regression
coefficients of the stoichiometric ratios at the respective temperatures and error bars denote the standard error of the regression coefficients. The dotted line represents a linear fit to the data points.
BGD
3, 779–801, 2006Nitrogen fixation and temperature E. Breitbarth et al. Title Page Abstract Introduction Conclusions References Tables Figures J I J I Back Close
Full Screen / Esc
Printer-friendly Version Interactive Discussion EGU (a) 0.0 0.1 0.2 0.3 0.4 0.5 0.6 0.7 10 15 20 25 30 35 40 Temperature ºC Fv /F m 0 0.1 0.2 0.3 0.4 0.5 0.6 0.7 10 15 20 25 30 35 40 Temperature °C Fv/Fm Fig. 4 (b) 0.0 0.1 0.2 0.3 0.4 0.5 0.6 0.7 10 15 20 25 30 35 40 Temperature ºC Fv /F m 0 0.1 0.2 0.3 0.4 0.5 0.6 0.7 10 15 20 25 30 35 40 Temperature °C Fv/Fm Fig. 4
Fig. 4. (a): Photosynthetic quantum use efficiency of only exponentially growing Trichodesmium
IMS-101 batch cultures acclimated to the respective temperatures. The two solid horizontal lines indicate the theoretical minimum (0.2) and maximum (0.6) Fv/Fmvalue for living
cyanobac-teria. The two vertical dashed lines indicate the temperature tolerance range of Trichodesmium IMS-101 (20–34◦C). (b): Photosynthetic quantum use efficiency of Trichodesmium IMS-101
grown at 25◦C and exposed to the respective temperatures of Fv/Fm measurements for short
duration (four hours).
BGD
3, 779–801, 2006Nitrogen fixation and temperature E. Breitbarth et al. Title Page Abstract Introduction Conclusions References Tables Figures J I J I Back Close
Full Screen / Esc
Printer-friendly Version Interactive Discussion
EGU Fig. 5. The observed present-day annual mean sea surface temperature (top) in comparison to
the annual mean sea surface temperature incremented by the modeled increase over the period 1990 to 2090 (bottom) based on HadCM3. In both plots, the cyan line indicates the maximum latitudinal boundary of the 20◦C isotherm of the year 1990. The black lines(b) indicate the 20