HAL Id: hal-01715332
https://hal.archives-ouvertes.fr/hal-01715332
Submitted on 18 May 2018HAL is a multi-disciplinary open access archive for the deposit and dissemination of sci-entific research documents, whether they are pub-lished or not. The documents may come from teaching and research institutions in France or abroad, or from public or private research centers.
L’archive ouverte pluridisciplinaire HAL, est destinée au dépôt et à la diffusion de documents scientifiques de niveau recherche, publiés ou non, émanant des établissements d’enseignement et de recherche français ou étrangers, des laboratoires publics ou privés.
Nc-AFM Imaging and Manipulation of a Triphenylene
Derivative on KBr(001)
Véronique Langlais, Olivier Guillermet, David Martrou, André Gourdon,
Sebastien Gauthier
To cite this version:
Véronique Langlais, Olivier Guillermet, David Martrou, André Gourdon, Sebastien Gauthier. Nc-AFM Imaging and Manipulation of a Triphenylene Derivative on KBr(001). Journal of Physical Chemistry C, American Chemical Society, 2016, 120 (32), pp.18151-18157. �10.1021/acs.jpcc.6b06113�. �hal-01715332�
nc-AFM imaging and manipulation
of a triphenylene derivative on KBr(001)
V. Langlais
a, O. Guillermet
a,b, D. Martrou
a, A. Gourdon
a, S. Gauthier *
a(a) NanoSciences Group, CEMES, CNRS UPR 8011, 29 rue J. Marvig, 31055 Toulouse
(France)
(b) Université de Toulouse, UPS, 29 rue J. Marvig, 31055 Toulouse (France)
ABSTRACT
The adsorption of single hexamethoxyltriphenylene molecules on KBr(001) at low
temperature (T<10K) was studied by low temperature (T=5K) non-contact atomic force
microscopy in ultra-high vacuum. Images of the frequency shift, measured at constant height,
show intramolecular features that are interpreted on the basis of molecular force-field
calculations. The main conclusion is that the experimental contrast originates from the
electrostatic interaction between a negatively terminated ionic tip and the atomic charges of
the molecule. The main trends of the experimental observations of lateral manipulations could
also be reproduced by the same method, giving some insight into the manipulation
mechanisms. In particular, it is shown that the strong interaction of the oxygen atoms of the
molecule with positive ions of the tip plays a major role by facilitating the partial lifting of the
INTRODUCTION
Using single adsorbed molecules to perform elementary electronic functions or calculations is
the main purpose of molecular electronics. But a precise control of a single molecule-based
device requires to image the molecule. Imaging single molecules is now performed routinely
by STM, which necessitates conducting surfaces (metals, semiconductors or ultrathin
insulating layers on conducting substrates). This condition constitutes a severe limitation and
in most cases using molecules adsorbed on bulk insulators would greatly simplify the device
design and operation.
Due to the continuous development of Atomic Force Microscopy in non-contact mode
(nc-AFM), the number of studies devoted to the adsorption of molecular layers or islands on bulk
insulators is steadily increasing [1-13]. Nevertheless, only very few investigations of single
molecules adsorbed on bulk insulators are reported until now, because, at room temperature,
most molecules tend to diffuse on these substrates. No isolated molecules could be observed
at room temperature so far except when trapped on step edges [3,4].
At low temperature, where diffusion is inhibited, the adsorption of Co-Salen on NaCl(001) [2]
and NiO(001) [9] at 8K has been studied in detail by nc-AFM from constant ∆f images. Based
on these experiments, the interest of using metallic tips on this type of systems was pointed
out.
Here, we report on a study on individual isolated hexamethoxytriphenylene molecules
(HMTP: Fig 1a) on the (001) surface of the bulk insulator KBr. This study is performed in
UHV, at low temperature (5K). This system was already studied at room temperature [5].
In the following, after describing our experimental methods, we present nc-AFM frequency
shift images of isolated HMTP obtained in the constant height mode. These images display
isolated HMTP molecules are manipulated (laterally or vertically) by the tip. This analysis is
followed by a discussion and conclusions.
METHODS
ExperimentalThe KBr crystal was cleaved in air just before being introduced in the UHV system. It was
annealed at 150°C for 1 hour in order to remove residual charges originating from the
cleavage process. The sample was then transferred to the low temperature (5K) STM/nc-AFM
(Scienta Omicron). HMTP molecules, in powder form, were then deposited on the cooled
(T<10 K) surface from a heated crucible. The force sensor was a tuning fork of the qPlus sensor type with resonance frequency f0 and Q factor of the order of 25,000 Hz and 20,000
respectively. It was equipped with a glued electrochemically etched tungsten tip. The control
electronics were provided by SPECS. All images, spectra, and manipulation experiments were
performed at a temperature of 5K. All the displayed experimental images are oriented such
that the vertical and horizontal directions correspond to <001> non polar crystallographic
directions of the KBr surface.
Numerical
The COMPASS (Condensed-phase Optimized Molecular Potentials for Atomistic Simulation
Studies) force-field [14] was used with Materials Studio [15] to optimize the conformation of
an isolated molecule on KBr(001) in the presence of the tip. This force-field is well suited to
calculate the adsorption of organic molecules on the surface of inorganic materials. It has
been parameterized using condensed phase properties as well as ab initio and empirical data
for isolated molecules [16,17]. Previous studies have shown that the interaction of organic
addition, these works indicate that the charge transfer between the substrate and the molecule
is generally negligible for this type of surfaces [18], ensuring that force-field based
calculations are sufficient for a realistic description of these systems.
RESULTS
NC-AFM imaging of HMTP molecules on the KBr(001) surface
a. Constant ∆f images
Figure 1: (a) HMTP optimized in vacuum. Oxygen atoms are depicted in red, carbon in grey and hydrogen in white. (b) and (c) Constant ∆f images of HMTP/KBr(001). (b) Amplitude A=150pm, ∆f=-4.1 Hz, (c) A = 250 pm, ∆f=-2.1 Hz.
A constant ∆f image of HMTP molecules at low coverage on KBr(001) is displayed in Fig.
1b. Single molecules appear as circular, featureless objects, with a mean diameter of ≈ 1.3 nm
and a height of ≈ 0.18 nm. These dimensions are compatible with the molecular model shown
in Fig. 1a. The bigger object could originate from an aggregate of a few molecules. The image
of the single molecules do not show any intra-molecular resolution. Trying from the imaging
conditions of Fig. 1b to improve the resolution by optimizing either ∆f or the amplitude A led
to molecular manipulation, where the molecules are laterally displaced by the scanning tip as
b. Constant height images
The constant height mode, which produces ∆f images, is increasingly used since the
pioneering work of Gross et al [19] on the high resolution imaging of
pentacene/NaCl/Cu(111) at low temperature. It is also frequently used at room temperature
(see for instance [13]). Its advantages are that one of the feedback loops of nc-AFM is
disabled, simplifying the settings of the instrument and, more importantly, the tip can
approach or go beyond the minimum of the ∆f(Z) curve without risking a tip crash, in contrast
to the more conventional constant ∆f mode. While the constant height mode is generally
restricted to very flat samples, it has also been used efficiently to image the top facet of
clusters [20].
Fig. 2 displays constant height ∆f images of 3 single HMTP molecules at different heights Z.
The evolution of the image of HMTP-A when Z decreases is characterized by the apparition
of a nearly circular black depression, with a diameter that increases from 1 nm to 1.4 nm, on
which submolecular clearer features emerge, reaching positive frequency shifts for the smaller
Z. HMTP-B and C follow the same trends. This behavior is similar to the observations
reported by Gross et al [19], where pentacene molecules where imaged at constant height with
a CO-terminated tip. The black depression was associated with long range attractive
electrostatic and van der Waals interactions, while the submolecular features were interpreted
in terms of Pauli repulsive interactions. Despite these similarities, the situation is different
here: the tip is not intentionally functionalized, and the size of the submolecular features does
not go down to atomic resolution as in [19].
Beyond this general behavior, these images also share common features such as minima (2 for
HMTP-A, 2 to 4 for HMTP-B, 2 to 3 for HMTP-C) with quite similar topologies. But they are
sensor, but with different tip apices since the tip was often reconditioned by gentle contacts
with the surface while measuring ∆f(Z) approach curves.
Figure 2: Constant height ∆f images of 3 HMTP molecules at different height Z. Experimental conditions: HMTP(a) Z=Z0 (∆f0=-3.1 Hz), Z= Z0-40 pm, Z= Z0-60 pm, Z= Z0 -80 pm. HMTP(b) Z=Z0 (∆f0=-2.7 Hz), Z= Z0-100 pm. HMTP(c) Z=Z0 (∆f0=-3.7 Hz), Z= Z0-30 pm, Z= Z0-60 pm. Z0 is the height of the tip in the constant ∆f mode on KBr with the setpoint ∆f0 indicated between parentheses. Amplitude A=150 pm. The ∆f scale has been translated in such a way that its origin corresponds to the KBr substrate, in order to approximately remove the long range van der Waals contribution. The values between brackets indicate the ∆f minimum and maximum values on the molecule.
In the following, we try to interpret the contrasts observed on the images of Fig.2. More
specifically, we address the following questions:
Which interactions are involved in the formation on the contrast?
Why is the contrast different from one molecule to another?
We have two objectives in mind. The first one is to get as much information as possible on the
adsorption of HMTP on KBr(001). The second, more methodological, consists in identifying
the experimental factors that limit the spatial resolution of nc-AFM on this type of system.
Modeling of HMTP on KBr(001)
The purpose of this modeling is not to reproduce precisely the experimental results. One of
the main obstacles toward this objective is to determine the precise structure of the tip, a huge
task which has been achieved in only a few cases (see for instance [21]). It requires to
perform calculations with a large number of plausible tip structures until an acceptable fit
with the experimental results is achieved.
Here, following the pioneering work reported in [22], we will consider that the tip is
constituted of a KBr cluster linked to the W tip of the qPlus sensor. Indeed, it is generally
accepted that when imaging the surface of ionic crystals, in particular KBr, the tip is rapidly
covered by material that has been picked up on the sample surface [23]. The structure of the
tip is kept as simple as possible, being modelled by a KBr cube of 8 atoms oriented with its
diagonal perpendicular to the sample surface with either a Br ion or a K ion pointing toward
the surface. It was checked that including more ions in the tip, for instance 36 atoms as shown
in Supporting Information (SI) Figure S2, does not significantly change the conclusions of our
study.
The KBr slab was four (001) atomic layers thick. The surface was constituted by 6x6
conventional unit cells, with a vacuum slab of 4 nm to avoid any coupling between
neighboring supercells due to the periodic boundary conditions. The van der Waals and
Adsorption geometry of HMTP on KBr(001)
The minimum energy conformation obtained by calculation is illustrated in Fig. 3. For this
calculation the two upper layers of the slab as well as the molecule were allowed to relax. The
adsorption energy is E0=0.87 eV. The molecule binds to the surface by positioning two of its
oxygen atoms directly above the two K+ ions colored in green in Figure 3, with a K+-O
distance ≈ 0.3 nm, while the other four oxygen atoms are distant by more than ≈ 0.38 nm from
any K+ ion.
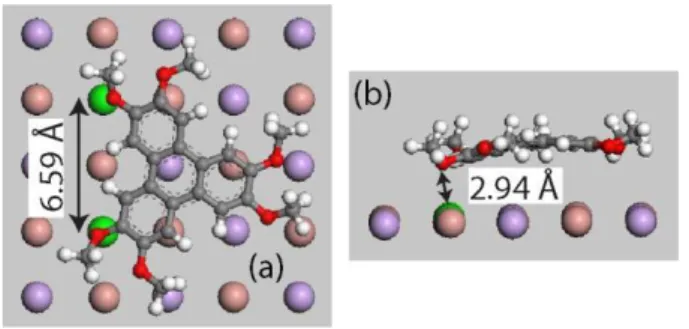
Figure 3: (a) Top and (b) side view of HMTP in its minimum energy configuration on KBr(001). K+ ions are depicted in violet, Br- ions in pale red. The two K+ ions on which the molecule is more strongly electrostatically linked are in green
As can be seen on the side view in Figure 3b, this electrostatic interaction bends the central
aromatic part of the molecule downwards. This constitutes another example of a adsorption
stabilized by "charge matching" as already illustrated for instance for another triphenylene
derivative [7] or for functionalized truxenes [3] on KBr(001).
Figure 4 displays the van der Waals surface of HMTP colored according to its molecular
electrostatic potential. As expected, the oxygen atoms are surrounded by a negative potential
while the methyl groups are surrounded by a positive potential. The charge matching derives
from the nearly perfect equality between the distance separating the two binding oxygen
K+ ions of the substrate (0.66 nm, Figure 3a) onto which the molecule is electrostatically
bound.
Figure 4: Molecular van der Waals surface of HMTP colored according to its electrostatic potential. The viewpoint for (a) and (b) is the same as for Figure 3 a and b respectively while (c) is seen from the KBr surface.
Calculation of ∆f maps
In a first step, the total energy E of the system constituted by the molecule in its optimized
conformation on the substrate in interaction with the tip was calculated, without any further
relaxation. This calculation was performed for each position (x, y, z) of the tip. The
tip-surface force z E z y x F ∂ ∂ − = ) , ,
( and its derivative relative to z were evaluated by numerical
differentiation. ∆f(x,y,z) was then calculated by numerical integration of the relation derived by Giessibl [24]:
[
( , , sin(2 )]
sin(2 ) (1) 2 ) , , ( 0 0 / 1 0 2 0 0 t f A t f A D y x F dt A k f z y x f fπ
π
π
+ − = ∆∫
where D is the distance between the front tip ion and the substrate when A=0.
∆f images calculated for a Br- tip or a K+ tip are displayed in Fig. 5 and 6 respectively. Fig. 5c
z F k f f A ∂ ∂ − = ∆ → 2 lim 0 0
giving the small amplitude limit of equation (1). As expected, these images are nearly
identical to the images at A=10 pm.
Figure 5: ∆f images calculated with a Br- tip at D=11 Å. (a) A=150 pm, (b) A=10 pm, (c) force derivative.
The images calculated with the experimental amplitude A=150 pm are very similar to the
images calculated with A=10 pm. This is a first evidence that the image contrast formation
arises from long range interaction, in contrast to the case of atomic resolution mentioned
previously. In addition, the contrast obtained with the K+ tip is qualitatively the opposite of
the contrast obtained with the Br- tip. This observation clearly indicates that the image is
dominated by the long range electrostatic interaction in the selected D range.
Figure 6: ∆f image calculated with a K+ tip at D=11 Å. (a) A=150 pm, (b) A=10 pm, (c) force derivative.
It is immediately obvious that the calculation with the K+ tip does not compare favorably with
the experimental images of Figure 2. In contrast, a fair qualitative agreement between the Br
-tip images and the experimental images is obtained, especially for HMTP-C, which displays,
like in the calculation a unique maximum with two marked minima. Thus, we conclude that
the tip used in the experiment was of the Br- type. This conclusion is also consistent with the
electrostatic potential map of Fig.4a: the negatively polarized tip is attracted by the positive
(blue) regions, resulting in the two minima, while it is repelled by the central more negative
(yellow) region. In addition, the electrostatic potential map shows that the appearance of the
minima is closely related with the orientation of the O-CH3 bounds in the molecule. For
instance, the potential is more positive when these bounds point toward the outside of each O
pair, as indicated by the blue arrows in Figure 4a and c.
Note that this comparison also excludes a metallic tip, since in most cases the polarity of these
tips is positive, i.e. their associated dipole is pointing outside [25,26].
The van der Waals and electrostatic contributions to the ∆f image of the minimum energy
configuration of HMTP on KBr(001) are displayed in Figure 7. The van der Waals image
only exhibits attractive interaction. In contrast both attractive and repulsive interactions
contribute to the electrostatic image. The intramolecular contrast is therefore purely of
electrostatic origin.
Figure 7: (a) van der Waals and (b) electrostatic contribution to (c) the ∆f image of the minimum energy configuration of HMTP on KBr(001).
Figure 8 shows, in addition to the minimum energy configuration already discussed, two other
conformations of slightly lower adsorption energies that were obtained by optimizing the
system after quenching a molecular dynamics simulation. They correspond to local relative
minima of the potential energy. These conformations can be distinguished by the orientation
of their methyl groups: conformation (b) is obtained from (a) by rotating around their CO
bond the 2 upper methyl groups (surrounded by a blue ellipse in Figure 8a and b) while
conformation (c) is obtained from (a) by rotating the lower right methyl group (marked by a
red circle in Figure 8a and c). This last change induces a slight rotation of the whole molecule,
which ends in a fully symmetric situation, aligned along a non-polar [100] direction of
KBr(001).
Even if the images still share the common features mentioned previously, the location of the
methyl groups has a noticeable influence: by changing the relative altitude of the central
aromatic part, the oxygen atoms and the methyl groups, they alter the relative intensity of the
maxima and minima of the images.
Figure 8: Side and top views and the corresponding images for the three lowest energy calculated configurations for HMTP/KBr(001). The adsorption energies are Eads=E0=0.87 eV for (a), Eads=E -11meV for (b) and Eads=E -15 meV for (c).
The influence of the size of the tip and its orientation (tilt of the tip axis or rotation along an
axis perpendicular to the surface) was also checked. The results, reported in Supporting
Information Figure S2 and S3, only show a limited influence of these parameters.
To go further, the same kind of calculations were performed allowing the molecule and the
first atomic layer of the KBr substrate to relax at each position of the tip. Three behaviors can
be distinguished, depending on D. When the tip is far away from the surface, the relaxations
of the molecule and the substrate induced by the tip are very small and do not affect the
images. In the intermediate range, the molecule is reversibly displaced from its equilibrium
position in the absence of the tip. These displacements can be quite large (~50 pm) and make
the method for calculating the images previously described inadequate. A realistic modelling
would require molecular dynamics simulation at each point, which is beyond the scope of this
paper. For shorter D distances, irreversible displacements occur: the molecule is laterally or
even vetically manipulated by the tip.
Manipulations
Reducing the tip-substrate distance from the stable imaging conditions used in Figure 2 led
quite often to lateral molecular manipulation, as illustrated in the constant height ∆f image of
Figure 9. The molecule is displaced along a polar [110] direction of the substrate, as quite
often observed on alkali halide substrates. The ∆f profile along the manipulation path,
displayed in Figure 9b shows that the molecule proceeds by jumps of 0.47 nm length,
corresponding to the nearest neighbor distance along <110> directions. The shape of this
profile suggests that the molecule is repelled by the tip: in the first part of the elementary
manipulation step, the tip images the molecule until a sudden jump happens, corresponding to
"pushing" mode [27-29]. Note that it was necessary to lift the tip by 50 pm to release the
molecule, as shown on the Z profile in Figure 9b.
Figure 9: (a) Constant height ∆f image of a HMTP manipulation sequence. (b) Profile along the manipulation path [black arrow in (a)]. The fast scanning direction is vertical. A=150 pm.
This behavior could be reproduced by simulations. Here, only the surface layer and the
molecule were allowed to relax. A complete calculated sequence is shown and discussed in SI
(V1 and V2 video files). The images of Figure 10 are extracted from this sequence. The
closest tip-surface distance is given by D-A=0.66 nm. Between Figure 10a and 10f, the
molecule is translated between two nearest neighbor sites along the [110] direction.
The tip always stays on the left of the molecule, meaning that the manipulation proceeds
indeed by pushing. A careful examination of the manipulation sequence (SI) shows that one
of the oxygen atoms of the molecule (O1 in Figure 10a) interacts strongly with the closest K+
ions of the tip second layer (KTip in Figure 10a). This bond allows the tip to lift one of the
branches of the molecule (Figure 10 c and d), facilitating the displacement toward the next
The length of this dO1-Ktip bond goes down to 0.27 nm. This corresponds to the equilibrium
distance between an isolated K+ ion and an oxygen atom of the molecule, as given by the
numerical simulation. This short distance indicates that the O1 is strongly bound to the tip that
pushes on the molecule as suggested by the images of Figure 10. It means that, for
manipulation, in contrast to imaging, the repulsive short-range part of the van der Waals
interaction plays a significant role.
Figure 10: Images extracted from V1 and V2 (SI). (b), (d) and (f): Views along +X. For the sake of simplicity, the tip is represented by two of its ions only. The Br- ion terminating the tip is colored in blue, its K+ ion is colored in green. The yellow K+ ions are the initial and final binding sites of the molecule, The fast scanning direction is indicated by the blue arrows. A=70 pm, D=0.73 nm.
Similar calculations with a K+ tip show that in this case the molecule is manipulated at much
large distance (closest approach = D-A = 0.98 nm) the molecule can be picked up by the tip.
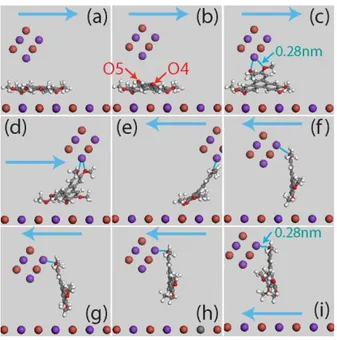
The images of Figure 11 are extracted from this sequence.
The molecule is at first partially lifted up by the interaction of the K+ terminating tip ion with
one then two of the oxygen atoms (O5 and O4) of the molecule (Fig. 11b and c). It is then
rotated by 90° and translated along the scanning direction (Fig. 11d and e). After the inversion
of the scanning direction, the molecule is pulled in the opposite direction and the two oxygen
atoms interact now with a K+ ion on the right side of the tip (Fig. 11f and g). Finally the
molecule is picked up by the tip (Fig. 11h and i). Here also, as indicated in Figure 11c and i,
the distances between O4 and O5 and the K+ ions of the tip approaches the O-K+ equilibrium
distance of 0.27 nm, revealing the contribution of the repulsive short-range part of the van der
Waals interaction.
This finding could explain why most of the experimental images we obtained are of the "Br
-tip" type: with K+ tip the molecule is picked up before a clear contrast could be obtained.
Figure 11: Images extracted from the K+ tip manipulation sequence V4 (SI). Views along +X. A= 110 pm, D= 1.09 nm. The arrows indicate the scanning direction. Blue lines show where
the electrostatic bonding between two oxygen atoms of the molecule and a K+ ion of the tip is located.
Discussion and conclusions
The comparison of the images of Figure 5, calculated with a Br- tip and the experimental
images of Figure 2 shows a fair qualitative agreement. They display a near central clear
protrusion, reaching frequency shifts that are higher than on KBr, surrounded by two or more
dark minima. Furthermore, the order of magnitude of ∆f is comparable for the D range chosen
for the calculations. In addition, the comparison with the images of Figure 6, obtained with a
K+ tip, clearly excludes a positive polarity tip. These findings lead to the following
conclusions:
-The tip used in the experiment has a negative polarity
-The experimental tip surface distance is around D=1.1 nm. For much smaller values
of D (below ~0.85 nm), the molecule is manipulated while for much higher values (above
~1.3 nm), the ∆f range becomes too small. In this range, the contrast is dominated by the
electrostatic interaction as demonstrated in Figure 7.
These conclusions are very robust: they do not depend strongly on the size (Figure S2) and
orientation of the tip (Figure S3). This robustness is obviously the consequence of the long
range interactions that are involved in the image formation; the image is the result of a spatial
average on a length scale given by the range of the interaction, i.e. nanometers in our case and
is rather insensitive to atomic details.
These findings are also consistent with the simulations of the manipulation process with the
two kinds of tips shown in the preceding part. These simulations highlight the important role
played by the bounds that form between the oxygen atoms of the molecule and some K+ ions
oxygen atom is by far the highest in the molecule (see Figure S1). The formation of these
bounds means that in the manipulation process, the short-range repulsive contribution of the
tip molecule potential plays an important role. The consequence is that, in contrast to the case
of imaging, the atomic structure of the tip is expected to have a strong influence on the
manipulation process.
The only way to improve the imaging resolution would be to reduce the tip-surface distance.
But, in this situation, the molecule is not stable enough on the surface to resist the force
applied by the tip. This limitation depends in a complex way on the structure of the
molecule-surface system. Even if the adsorption energy is not so small (E0=0.87 eV), the flexibility of
the triphenylene core provides low force paths to displace or pick up the molecule, as shown
in Figure 10 and 11.
Nevertheless, the results of Figure 8 shows that the position of the methyl groups of the
molecule have a noticeable influence. This result demonstrates that a precise adsorption
structure determination should be possible from experimental images, even with a resolution
limited by the long range nature of electrostatic forces.
Supporting Information Description
Figure S1: Atomic charges of HMTPFigure S2: Influence of the tip size
Figure S3: Influence of the tip orientation
Figure S4: Time evolution of tip-molecule and molecule-surface distances during the
mani-pulation sequence displayed in V1 and V2.
Acknowledgements:
This work has been supported by the European Commission withinthe PAMS project (Contract N° 610446).
References
(1) Burke, S. A.; Topple, J. M.; Grütter P. J. Phys. Condens. Matter 2009, 21, 423101.
(2) Lammle, K.; Trevethan, T.; Schwarz, A.; Watkins, M;. Shluger, A.; Wiesendanger, R.
Nanoletters 2010, 10, 2965-2971.
(3) Such, B.; Trevethan, T.; Glatzel, T.; Kawai, S.; Zimmerli, L.; Meyer, E.; Shluger, A. L.;
Amijs, C. H. M.; de Mendoza, P.; Echavarren, A. M. ACS nano 2010, 4, 3429-39.
(4) Trevethan, T.; Such, B.; Glatzel, T.; Kawai, S.; Shluger, A. L.; Meyer, E.; de Mendoza, P.;
Echavarren, A. M. Small 2011, 7, 1264–1270.
(5) Hinaut, A.; Lekhal, K.; Aivazian G.; Bataillé, S.; Gourdon, A.; Martrou D.; Gauthier, S. J.
Phys. Chem. C, 2011, 115, 13338-13342.
(6) Bocquet, F.; Nony, L.; Mannsfeld, S. C. B.; Oison, V.; Pawlak, R.; Porte, L.; Loppacher,
Ch. Physical Review Letters 2012, 108, 6103.
(7) Hinaut, A., Pujol, A., Chaumeton, F., Martrou, D., Gourdon, A., Gauthier, S. Beilstein J.
Nanotechnol. 2012, 3, 221.
(8) Kittelmann, M.; Nimmrich, M.; Neff, J. L.; Rahe P.; Gren, W; Bouju, X.; Gourdon, A.;
Kühnle, A. J. Phys. Chem. C 2013, 117, 23868-23874.
(9) Gao, D. Z.; Grenz, J.; Watkins, M.B.; Canova, F.F.; Schwarz, A.; Wiesendanger, R.;
Shluger A.L. ACS Nano, 2014, 8, 5339.
(10) Hoff, B.; Gingras, M.; Peresutti, R.; Henry, C. R.; Foster, A. S.; Barth, C.J. Phys. Chem. C, 2014, 118, 14569.
(11) Neff, J. L.; Milde, P.; Perez Leon, C.; Kundrat, M. D.; Eng, L. M.; Jacob, C. R.;
(12) Amrous A.; Bocquet F.; Nony L.; Para F.; Loppacher C.; Lamare S.; Palmino F.;
Cherioux F.; Gao D. Z.; Canova F. F.; Watkins M. B.; Shluger A. L. Adv. Mater. Interfaces,
2014, 1, 1400414.
(13) Neff, J. L.; Songen, H.; Bechstein, R.; Maass, P.; Kuhnle, A. J.Phys.Chem.C 2015, 119,
24927−24931.
(14) Documention of Materials Studio v5.5.0.0, Accelrys Software Inc.: San Diego, CA.
http://accelrys.com/products/datasheets/compass.pdf
(15) Materials Studio v5.5.0.0, Accelrys Software Inc.: San Diego, CA.
(16) Sun, H. J. Phys. Chem. B 1998, 102, 7338-7364.
(17) Zhao, L.; Liu, L.; Sun, H. J. Phys. Chem. C 2007, 111, 10610-10617.
(18) Trevethan, T.; Shluger, A. L. J. Phys. Chem. C 2007, 111, 15375-15381.
(19) Gross, L.; Mohn, F.; Moll, N.; Liljeroth, P.; Meyer, G. Science 2009, 325, 1110-4.
(20) Pakarinen, O. H.; Barth, C.; Foster, A. S.; Henry C. R. Journal of Applied Physics, 2008,
103, 054313.
(21) Oyabu, N.; Pou, P.; Sugimoto, Y.; Jelinek, P.; Abe, M.; Morita, S.; Pérez, R.; Custance,
O. Phys. Rev. Lett. 2006, 96, 106101.
(22) Barth, C.; Foster, A. S.; Reichling, M.; Shluger, A. L. J. Phys.: Condens. Matter 2001,
13, 2061-2079.
(23) Shluger, A. L.; Livshits, A. I.; Foster, A. S.; Catlow, C. R. A. J. Phys.: Condens. Matter
1999, 11, R295–R322.
(24) Giessibl, F. J., Phys. Rev. B 1997, 56, 16010.
(25) Teobaldi, G.; Lammle, K.; Trevethan, T.; Watkins, M.; Schwarz, A.; Wiesendanger, R.;
Shluger, A. L. Phys. Rev. Lett. 2011, 106, 216102.
(26) Gross, L.; Schuler, B.; Mohn, F.; Moll, F.; Pavliček, N; Steurer, W.; Scivetti, I.; Kotsis,
(27) Bartels, L.; Meyer, G.; Rieder K.-H. Phys. Rev. Lett. 1997, 79, 697.
(28) Bouju, X.; Joachim, C.; Girard, C. Phys. Rev. B 1999, 59, R7845.
(29) Trevethan, T.; Kantorovich, L.; Polesel-Maris, J.; Gauthier, S. and Shluger, A. Phys. Rev.
Supporting Information
1. Atomic partial charges of HMTP
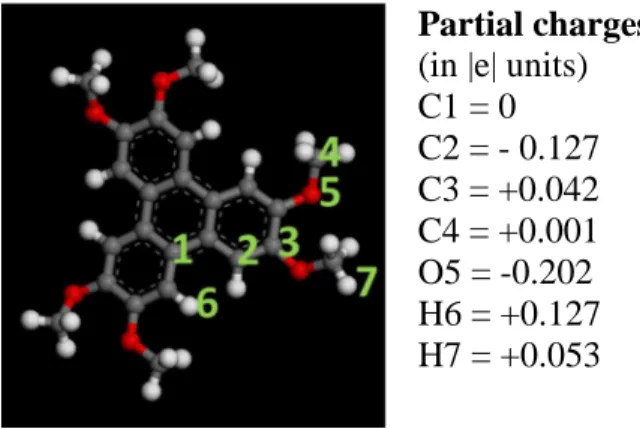
Partial charges:
(in |e| units) C1 = 0 C2 = - 0.127 C3 = +0.042 C4 = +0.001 O5 = -0.202 H6 = +0.127 H7 = +0.053
Figure S1: Atomic charges of HMTP as given by the COMPASS force-field.
2. Influence of the tip size
Figure S2: (a) ∆f image calculated with the Br- tip shown in (b). (c) ∆f image calculated with the Br- tip shown in (d). D=11 Å.
3. Influence of the tip orientation
Figure S3: (a) ∆f image calculated with the non-rotated Br- tip, (b) with the Br- tip rotated by 45° , (c) with the Br- tip tilted by 30° in the vertical upward direction. D=11 Å.
4. Manipulation with a Br- tip
Video files: V1.avi and V2.avi
Legend: Top view and side view along X of a calculated manipulation sequence with the Br
-tip. D = 0.73 nm, A = 70 pm. The tip Br- ions is colored in blue. The surface K+ ions on which the molecule is electrostatically bound at the beginning (end) of the sequence are colored in yellow (green). The Z oscillation of the tip is not displayed but only the frames where the tip is closest to the surface.
An inspection of V1 and V2 shows that the molecule interacts in a globally repulsive way with the two methoxy groups that include O1 and O2. The molecule “oscillate” (anticlockwise rotation on O1, clockwise rotation on O2) but stays in the same adsorption site until frame ~ 5650. The distances remain above 0.4 nm, i.e. in the electrostatic range (Fig. S4b).
From frame ~ 5650 to frame ~ 6300, the system is in a transitory state during which the molecule is laterally displaced (Fig. S4d) . Fig. S4c shows that before the manipulation, the molecule is bound to the surface by O1 on K1 and O2 on K2, as shown by the red and green curves (dO1K1 and dO2K2 < 0.35 nm). After the manipulation, the molecule binds to the surface by O2 on K3 and O1 on K5 (pink and dark yellow curves, dO2K3 and dO1K5 < 0.35 nm). ). It has moved by one nearest neighbor distance along <100>.
A jump occurs at frame 5684 (arrow 2 in Fig. S4 d and e). Fig. S4d shows that O1 gets closer to the tip (green and pink curves). Simultaneously O1 is lifted from the surface (Fig. S4e green curve). O1 is captured by the tip, lifting the extremity of the molecule from the surface (see also Fig. 10).
From frame ~ 5700 to frame ~ 5900, O3 and O4 get closer to K3 and K4 while O1 gets farther from K1. From frame ~ 5900 to ~ 6250, the molecule binds to the surface by O3 on K3 (blue curve in Fig. S4e ) and O4 on K4 (pink curve in Fig.S4e ).
A final jump occurs near frame 6300 (arrow 3 in Fig. S4 d and e). O2 binds to K5 and O1 binds to K3.
(a)
(b) (c)
(d) (e)
Figure S4: Time evolution during the manipulation sequence of videos V1 and V2 of the distances between selected O atoms of the molecule and :
- (b) and (d) the terminating Br- and one of the K+ of the tip - (c) and (e) K1 to K5 K+ ions of the surface
Around frame ~ 6000, dO1-Ktip goes below 0.27 nm. This is less that the sum of the ionic radii of O- and K+. It indicates that the O1 is strongly bound to the tip that pushes on the
molecule as suggested by the images of Figure 10.
Note that these two jumps are preceded by an unsuccessful event (arrow 1 in Fig. S4 d and e): The molecule starts to move as immediately after jump 2 but goes back to its initial position (O1 on K1 and O2 on K2, red and green curves). It is only when X is larger by 0.1 nm, i.e. when the tip is closer to the molecule that the manipulation will be successful.
5. Manipulation with a K+ tip
V3.avi: Top view of a calculated manipulation sequence with the K+ tip.
V4.avi: Side view (seen along -X) of the same manipulation sequence as in V3.avi. A= 110 pm, D= 1.09 nm.


![Figure 9: (a) Constant height ∆ f image of a HMTP manipulation sequence. (b) Profile along the manipulation path [black arrow in (a)]](https://thumb-eu.123doks.com/thumbv2/123doknet/13706651.434014/16.892.292.600.230.476/figure-constant-height-image-manipulation-sequence-profile-manipulation.webp)

![ON THE MOD-2 COHOMOLOGY OF SL 3 (Z[ 1 2 , i])](data:image/gif;base64,R0lGODlhAQABAIAAAP///wAAACH5BAEAAAAALAAAAAABAAEAAAICRAEAOw==)