HAL Id: hal-02330198
https://hal.archives-ouvertes.fr/hal-02330198
Submitted on 23 Oct 2019HAL is a multi-disciplinary open access archive for the deposit and dissemination of sci-entific research documents, whether they are pub-lished or not. The documents may come from teaching and research institutions in France or abroad, or from public or private research centers.
L’archive ouverte pluridisciplinaire HAL, est destinée au dépôt et à la diffusion de documents scientifiques de niveau recherche, publiés ou non, émanant des établissements d’enseignement et de recherche français ou étrangers, des laboratoires publics ou privés.
and Mid-Ocean Ridges
R. C. Searle, J. Escartín
To cite this version:
R. C. Searle, J. Escartín. The Rheology and Morphology of Oceanic Lithosphere and Mid-Ocean Ridges. C.R. German; J. Lin; L.M. Parson. Mid Ocean Ridges. Hydrothermal interactions be-tween the lithosphere and the oceans, 148, American Geophysical Union, pp.63-93, 2013, Geophysical Monograph Series, 9780875904139. �10.1029/148GM03�. �hal-02330198�
-3,712#*+$%3,(#6
R. C. Searle
Department of Earth Sciences, University of Durham, UK
J. Escartín
Laboratoire de Géosciences Marines (CNRS UMR7097), Institut de Physique du Globe de Paris, France
The rheology of oceanic lithosphere is primarily a function of temperature, the abun-dance and distribution of lithologies and fluids, and their mechanical properties. Rheology controls the overall strength and mode of deformation. Seafloor mor-phology is the surface expression of this deformation, modified by additional processes such as volcanism. Rheological models are key to interpreting both nat-urally deformed rocks as direct indicators of deformation conditions and the result-ing morphology. Simple thermo-mechanical models have proven useful to study ridge processes, but are limited by lack of knowledge of lithospheric architecture, composition, and rheology.
The mechanical properties of some components (olivine, dolerite, olivine plus melt, serpentinite) are reasonably known, but must be extended to other important materials such as alteration products and include the role of fluids and compositional variations. While the overall composition of oceanic lithosphere is relatively well known, particularly for fast-spreading ridges, the distribution and abundance of melt and alteration products is not. Though sparse, these weak phases can strongly control the overall strength, mode and localization of deformation.
Thermo-mechanical models successfully reproduce observed axial relief and gen-eral faulting patterns. They provide plausible mechanisms of lithospheric behav-ior, but cannot constrain actual deformation processes. In particular, they must assume rheology, thermal structure, and composition and distribution of materials, and are non-unique. The most accurate constraints on rheology and deformation processes will come from study of naturally deformed rocks. This will guide the choice of the models used to interpret morphology and infer the detailed thermal struc-ture under ridges.
INTRODUCTION
The subject of the first InterRidge Theoretical Institute in Pavia, Italy, 2002, was the “Thermal regime of oceanic ridges and dynamics of hydrothermal circulation”. There is a fun-damental, though complex, connection between ridge
mor-Book Title Book Series
Copyright 2004 by the American Geophysical Union 10.1029/Series#LettersChapter#
phology and the rheology and thermal regime of the litho-sphere, which we review here.
At the largest scale, the shape of the mid-ocean ridge itself is defined by the thermal contraction of the lithosphere cre-ated at the ridge [Parsons and Sclater, 1977]. The lithosphere can then be deformed continuously by elastic flexure in response to applied loads such as seamounts, ocean islands, fracture zones, and subduction zones [Watts, 1978]. The flex-ural response itself depends on the rheology of the lithosphere, which in turn is a function of lithospheric temperature [McNutt, 1984]. At a smaller scale, the lithosphere may be deformed dis-continuously when a fault forms [Atwater and Mudie, 1968;
Ballard and Van Andel, 1977]. The mechanics of faulting also
depends strongly on the rheology of the rock, including its strength and the coefficient of friction on the fault, all of which may be strongly dependent on temperature, pressure and fluid content, among other parameters. Moreover, the loads resulting from faulting may cause further lithospheric flexure [Bott, 1996; Buck, 1988; Weissel and Karner, 1989]. The distribution, spacing, and size of faults may be controlled by and provide an indication of the lithospheric thickness and rheology [Shaw, 1992].
To fully describe and accurately model the processes occur-ring at mid-ocean ridges, therefore, we need a good under-standing and parameterization of the rheology of the lithosphere. This can be approached by a combination of lab-oratory experiments and observations on actual deformed rocks. Alternatively, we might take observations on ridge mor-phology and other parameters, and attempt to invert them to determine the underlying rheology and temperature. How-ever, given the complexities in the structures and processes involved, this link is still weak. In practice, a combined approach is necessary.
In this paper, we will review current experimental and field work on the rheology of the lithosphere or its components. We will also review the morphology of mid-ocean ridges and what can be inferred about from it concerning their rheology and underlying temperature structure.
2. RHEOLOGY OF THE OCEANIC LITHOSPHERE
2.1. The Strength of the Lithosphere
Experimental studies have revealed the physical mecha-nisms responsible for deformation in the lithosphere and pro-vide constitutive equations to describe its mechanical behavior (see reviews by [Kirby, 1983] and [Kohlstedt et al., 1995]). Early studies revealed that, to a first approximation, rocks deform in one of two ways: by brittle failure at low tempera-tures and pressures (shallow depths), and by ductile or plas-tic deformation at higher temperatures and/or pressures, e.g.,
[Byerlee, 1968; Byerlee, 1978; Goetze, 1978]. From experi-mental constraints on the strength of rocks at different tem-perature and pressure conditions, and assuming a simple lithology, a yield envelope for the whole lithosphere can be cal-culated, as we discuss below [Brace and Kohlstedt, 1980;
Goetze and Evans, 1979; Kirby, 1983; Kohlstedt et al., 1995]
(Figure 1). These simple models provided a means to directly correlate rock properties with lithospheric thickness inferred from geophysical data (e.g., gravity, bathymetry, seismicity), but ignored the mode of deformation within the lithosphere and the rheological effects of parameters such as water or litho-logical heterogeneity.
In this approach, the mantle is modeled assuming the rhe-ology measured for single crystals or aggregates of olivine crystals [Chopra, 1986; Chopra and Paterson, 1984; Durham
and Goetze, 1977; Durham et al., 1977; Evans and Goetze,
1979; Kohlstedt and Goetze, 1974]. For the oceanic crust, the rheology of diabase as determined in the laboratory [Agar
and Marton, 1995; Caristan, 1982; Mackwell et al., 1998; Shelton and Tullis, 1981] is assumed to apply to all rocks that
compose the magmatic crust (i.e., gabbro, diabase and basalt), as these rocks are compositionally similar [Goetze and Evans, 1979; Kohlstedt et al., 1995]. ‘Classical’ rheological models have assumed that the plastic flow law for the crust (diabase)
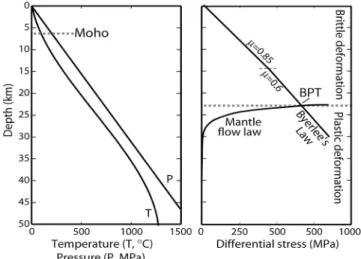
Figure 1. Left: variation in confining pressure (P) and temperature
(T) with depth; right: corresponding yield strength envelope. The shallow levels deform in the brittle regime, where the maximum strength is given by Byerlee’s friction law. The brittle domain over-lies a plastic domain where deformation is accommodated by creep, and shows a fast decrease in the yield strength with increasing tem-perature and depth. The transition between the two regimes, where strength is maximum, corresponds to the brittle-plastic transition (BPT). The relative position of the Moho (6-km oceanic crustal thickness) is also indicated in the left panel. Calculations are for a strain rate of ~10-15 s-1.
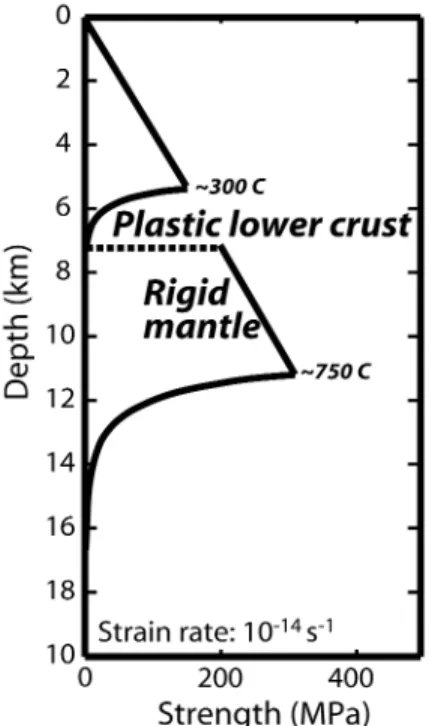
is much weaker than that of the mantle (olivine), resulting in a decoupling weak lower crust under the ridge axis (Figure 2) [Chen and Morgan, 1990a; Shaw and Lin, 1996]. More recent experimental work shows that these models need to be revised, as the strength of dry crust may be similar to that of the man-tle (Figure 3) [Hirth and Kohlstedt, in press; Mackwell et al., 1998].
Being more complex, the continental crust is commonly modeled assuming a layered structure and using the rheol-ogy of quartz [Blacic and Christie, 1984; Jaoul et al., 1984;
Kronenberg and Tullis, 1984; Mainprice and Paterson, 1984],
calcite [Fredrich et al., 1989], and granite [Tullis and Yund, 1977]. More recently, experimental work has been extended to other rocks found in the lithosphere, such as serpentinite and serpentinized peridotite [Escartin et al., 2001; Escartin et al., 1997b; Reinen et al., 1994], micas [Mares and Kronenberg, 1993; Shea and Kronenberg, 1992; Shea and Kronenberg, 1993], and feldspar [Rybacki and Dresen, 2000; Tullis and
Yund, 1991], among other lithologies. In addition, numerous
studies demonstrate that the presence of water [Hirth and
Kohlstedt, 1996; Karato et al., 1986; Mainprice and Paterson,
1984; Tullis and Yund, 1989], and melt [Hirth and Kohlstedt, 1995a; Hirth and Kohlstedt, 1995b], can have very
signifi-cant effects on the rheology of the mantle and the crust, as discussed below.
2.2. Brittle Deformation
In the brittle regime, initial deformation is instantaneous and elastic. When the stresses exceed a yield point, brittle failure occurs. The maximum strength of the rock is dependant on the pressure, following a Coulomb law of the form:
(1) where τ is the shear stress, c is a material constant, µ is the coefficient of friction, and σnis the normal stress on the fail-ing fault plane. As the lithosphere is assumed to be fractured,
c is ~0 MPa, and the strength increases linearly with
confin-ing pressure and thus depth. [Byerlee, 1978] illustrated that for many rocks, strength is independent of composition. Thus a
+
!
τ= +µσ
Figure 2. Yield strength envelope used in thermo-mechanical
mod-els, displaying a plastic lower crust decoupled from the mantle. These models have a brittle to plastic transition at a very low temperature (<400°C) [Chen and Morgan, 1990a]. These models used a wet dia-base rheology for the plastic strength of the crust, which is now known to be unrealistic.
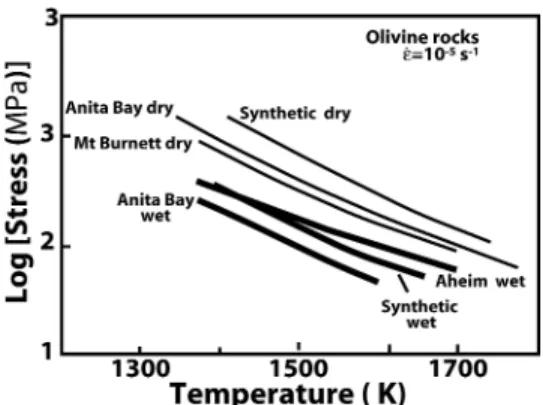
Figure 3. Plot of plastic flow laws for different lithologies and water
content (curves) and predicted frictional strength in the brittle regime (straight lines) for a coefficient of friction for Byerlee’s friction law (?~0.85) and for serpentinite (?~0.3) [Escartin et al., 1997b]. Flow laws are shown for diabase (thick black lines) [Mackwell et al., 1998; Shelton and Tullis, 1981], olivine (thick grey lines) [Chopra, 1986; Karato et al., 1986] and pyroxenite (thin black lines) [Kirby and Kronenberg, 1984; Shelton and Tullis, 1981].
‘universal friction law’ (known as Byerlee’s friction law) could be used:
c = 0 MPa, µ = 0.85, for σn< 200 MPa, (2) and
c = 60 MPa, µ = 0.6, for σn< 200 MPa. (3) While this parameterization of the strength in the brittle regime has been widely used to model the lithosphere, [Byer-lee, 1978] and more recent experimental work has demon-strated that there can be important variations in the frictional characteristics of different materials. For example, the coef-ficient of friction for the serpentine polymorph lizardite, which is the most abundant form in the oceanic lithosphere, is µ ~ 0.35 [Escartin et al., 1997b], and slightly serpentinized peridotites show a similar behavior to that of pure serpentinite [Escartín et al., 2001]. Serpentine may be an abundant com-ponent of the oceanic lithosphere, and therefore its presence can have a substantial weakening effect when incorporated into yield envelopes (Figures 1 and 3). As the modeled brit-tle strength of the lithosphere increases linearly with over-burden pressure and thus depth, small variations in the coefficient of friction can result in large strength variations. 2.3. Plastic Deformation
Plastic deformation is accommodated by solid state creep [Goetze, 1978] according to:
(4) where is the strain rate, σ is the differential stress, d is the grain size, R is the universal gas constant, and A, Q, n and m are constants that are specific to each material and can be determined experimentally.
Because of the exponential term, the strain rate increases rap-idly with increasing temperature for a given applied stress. This is equivalent to an exponential reduction in mantle strength with increasing depth, given a constant stress and strain rate (Figure 1). The crossing point between the fric-tional and the plastic strength is considered to mark the brit-tle-to-plastic transition (BPT), and is also where the strongest lithosphere is found at depth (Figure 1). The BPT is located close to the base of the mechanical lithosphere, which is defined as the depth at which the strength is a small fraction of the ambient stress-difference. The depth at which this occurs depends, among other factors, on the strain rate, and therefore varying lithospheric thicknesses may be expected at differ-ent time scales or for processes occurring at differdiffer-ent rates. For
reasonable geological strain rate values (10-15-10-18s-1) this transition occurs at ~750°C.
Plastic deformation can be accommodated by two creep mechanisms (Figure 4). The first, known as diffusion creep, is characterized by mobilization of atoms around grain bound-aries and is limited by the rate of grain-boundary diffusion. When this mechanism operates, the strain rate varies linearly with stress (n~1). The second mechanism, known as disloca-tion creep, accommodates crystal deformadisloca-tion by the propa-gation of crystal defects (dislocations). In the dislocation creep regime, which tends to occur at larger grain sizes, the strain rate depends non-linearly on the applied stress (n~3) [Karato et al., 1986]. Dislocation creep can also result in the formation of new grains and sub grains, reducing the overall grain size of the rock, and promoting a transition in creep
ε!
" #$ % &
' ( )
ε!= σ −
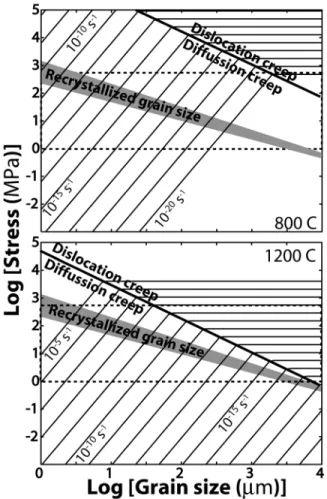
Figure 4. Maps of creep deformation for olivine mylonites, showing
the variation in strain rate as a function of grain size and differential stress, for two temperatures as indicated. The bounds of geological stresses are indicated by the dashed lines. The shaded area gives the predicted grain size – stress relationship [Van der Wal, 1993]. Note that dislocation creep is activated at lower stresses and smaller grain sizes with increasing temperatures. After [Jaroslow et al., 1996].
mechanism from dislocation creep to diffusion creep [Hirth, 2002; Jaroslow et al., 1996].
2.4. The Effects of Composition, Grain Size, Water and Melt
Rock strength is determined by the composition of the rock (mineralogy), by the presence of fluids (e.g., water and melt), and by the stress and temperature conditions. While most experimental work is carried out in mono-mineralic rocks, natural rocks are composed of several mineralogical phases. [Mackwell et al., 1998] showed that two types of diabase with different ratios of pyroxene and plagioclase have similar power law relationships (i.e., similar values for n and Q) but differ-ent strengths (as the measured A changed by a factor of 20). Figure 3 shows the variations in predicted strength for olivine, diabase and pyroxenite; depending on rock type, the thick-ness of the lithosphere could vary by more than 4 km near the mid-ocean ridge axis, with large variations of the maximum strength at the BPT. Therefore, knowledge of the composi-tion and distribucomposi-tion of lithologies is necessary to construct accurate rheological models of the lithosphere, in addition to experimental and theoretical work on the rheology of polyphase materials [Tullis and Yund, 1991].
Water content is a second parameter that can strongly mod-ify the overall strength of lithospheric materials (Figures 3 and 5) [Hirth, 2002; Jaroslow et al., 1996; Mei and Kohlstedt, 2000a; Mei and Kohlstedt, 2000b]. In the oceanic mantle water can substantially weaken olivine by enhancing both dis-location and diffusion creep, with a transition occurring at 0.1–1 MPa for a grain size of 10 mm [Karato et al., 1986]. Dewatering due to mantle melting below mid-ocean ridges may result in the formation of a strong, dry upper mantle layer ~60–70 km thick, with a viscosity more than an order of
mag-nitude larger than that of the underlying, wet mantle [Hirth and
Kohlstedt, 1996]. A similar water-induced weakening is
observed in diabase [Mackwell et al., 1998]. Constraints on the water content of the lithosphere and mantle, and understand-ing of the processes responsible for hydration and dehydration, are needed in order to apply the experimentally-determined dependence of rheology on water content [Hirth and
Kohlst-edt, in press]. While the magmatic component of the oceanic
crust (i.e., the melt-derived components: gabbro, diabase and basalt) may be nominally dry and therefore strong [Hirth et al., 1998], other processes such as fracturing, water circulation and alteration will result in hydration and eventual weakening. Grain size is a third parameter than can control the rheol-ogy of the lithosphere, and in particular the mode of local-ization of deformation. In undeformed rocks, grain size largely depends on the cooling history of the rock. However, defor-mation both during and after cooling also influences grain size [Montesi and Hirth, 2003; Rutter and Brodie, 1988; Van
der Wal, 1993]. Studies on naturally deformed abyssal
peri-dotite mylonites show two types of rock recording two con-ditions and modes of deformation [Jaroslow et al., 1996]: medium to coarse-grained tectonites with equilibrium tem-peratures >755°C, and fine-grained mylonites with equilibrium temperatures of ~600°C. The first type is interpreted to record deformation associated with mantle upwelling, while the sec-ond one may be associated with localized ductile shear zones within the lithosphere that developed during extension and cooling. Grain-size reduction due to dislocation at the base of the lithosphere promoted a transition to the diffusion creep regime (Figure 4), further reducing the strength and favoring strain localization and long-lived faults. These results demon-strate that the mode of deformation and the strength of the lithosphere depend on the evolution of deformation with time, resulting in a complex and variable rheological structure that is not captured by the oversimplified yield strength envelopes commonly used (e.g., Figures 1 and 2).
Finally, the presence of melt can have an important effect on the strength of rocks [Hirth and Kohlstedt, 1995a; Hirth and
Kohlstedt, 1995b; Kohlstedt et al., 2000; Renner et al., 2000].
An important strength reduction is documented in the diffu-sion creep regime at >5% melt content, while this reduction occurs at >4% melt for rocks deforming in the dislocation creep regime, associated with an increase of one order of magnitude in strain rate (Figure 6).
2.5. Semibrittle Deformation
As commonly accepted, all the models presented above are fundamentally oversimplified as they assume that deformation may only occur in either the brittle or the plastic deformation regime (Figure 1). Experimental work in numerous
materi-Figure 5. Variations in strength as a function of temperature for
olivine with varying amounts of water. “Dry” olivine is stronger than “wet” olivine, but large variability is observed as the actual amount of water is not known. Modified from [Evans and Kohlst-edt, 1995].
als such as dry clinopyroxene [Kirby and Kronenberg, 1984] or feldspar aggregates [Tullis and Yund, 1992] demonstrate that a more complex behavior occurs in nature. Clinopyrox-enites show both plastic and brittle deformation at moderate temperatures (600°C) and intermediate pressures (430–1190 MPa). Feldspars display a cataclastic ductile deformation field with some of the deformation accommodated by plasticity; the onset of deformation occurs at T>1000°C and P>1000 MPa with localized brittle faulting at T<300°C and P<500 MPa. Semibrittle behavior can be expected in heterogeneous mate-rials that deform plastically at different pressure and temper-ature conditions (e.g., olivine, pyroxene and plagioclase in gabbros). This deformation regime is microstructurally com-plex and has been investigated in a limited number of litholo-gies. However, constitutive laws for the semibrittle regime are not available, and accurate constraints on the location of the plastic-semibrittle and semibrittle-brittle deformation regimes do not exist, though there are some “rules of thumb.” It is commonly accepted that localized brittle deformation occurs when the strength of the rock is larger than that pre-dicted by Byerlee’s friction law (Figure 7). Since Byerlee’s law does not appear to be universal, this criterion may be improved using the friction law determined for each rock type [Escartin et al., 1997b]. When the strength of the rock is lower than its frictional strength, deformation may be distributed (ductile, semibrittle regime). The onset of fully plastic behav-ior is assumed to occur when the strength of the rock equals that of the confining pressure (i.e., Goetze’s criterion, Figure 7). The definition of the semibrittle regime may be further complicated in the case of heterogeneous materials, such as where brittle and plastic deformation of the different compo-nents may coexist under the same conditions [Scholz, 1988]. Incorporating a semibrittle deformation regime into
rheolog-ical models results in a profound modification of the yield strength envelope, with significant weakening of both the overall and the peak strength of the lithosphere, compared to ‘classical’ rheological models (Figure 8).
2.6. Limitations of Existing Rheological Models
Commonly used rheological models typically adopt numer-ous simplifications and assumptions, including the extrapo-lation of experimental results to natural conditions. For example, note the nine orders of magnitude difference between the experimental strain rates of Figures 5 and 6, and the “geo-logical” rate used in the model of Figure 2. Nevertheless, these models have been successful at predicting and captur-ing some of the main observations and first-order processes taking place in the lithosphere, such as the brittle behavior of the upper lithosphere and crust and the resulting morphology at the ridge axis [Chen and Morgan, 1990a; Chen and
Mor-gan, 1990b], the nature of faulting and the formation of abyssal
hills at the seafloor [Behn et al., 2002b; Macdonald, 1998], or the formation of detachment faults [Lavier et al., 1999].
However, many of the key elements that characterize mid-ocean ridges in general, and slow-spreading ridges in par-ticular, are not captured by current rheological models. In particular, these include: the three-dimensionality of tectonic structures near ridge discontinuities (as existing models are two-dimensional); the heterogeneity in composition of the oceanic lithosphere (mixture of gabbros, peridotite, serpen-tinite, and other rock types) as opposed to homogenous
mod-Figure 6. Effect of melt content on olivine rheology. An increase of
about an order of magnitude in the strain rate at a constant stress is observed when the melt content increases from 3% to 5%. Modi-fied from [Hirth and Kohlstedt, 1995a].
Figure 7. Schematic plot of strength of intact rock versus pressure
with criteria to define the deformation regimes. Brittle deformation occurs when the strength of the rock exceeds that of the frictional strength (Byerlee’s Law), while plastic deformation is initiated when the strength of the rock equals the pressure (Goetze’s Criterion). The region between these two criteria may correspond to the semibrittle regime. After [Evans and Kohlstedt, 1995].
els; and feedback between the different active processes that will in turn affect the rheology of the lithosphere (e.g., hydrothermalism or volcanism, faulting and thermal regime). Some of these aspects, such as the composition of the litho-sphere and distribution of lithologies, melt or water, are based on qualitative observations, and require additional high-res-olution geophysical constraints to provide quantitative infor-mation of use for accurate rheological modeling. Additional experimental work to characterize the rheology of the less abundant lithologies is also required. Even if minor, the pres-ence of a weak phase such as serpentinite or other phyllosil-icates can substantially reduce the strength of the lithosphere, and influence the mode of strain localization [Bos et al., 2000; Escartin et al., 1997a]; the effects of these phases are not included in any of the existing mechanical models. Another key rheological parameter that is poorly constrained is temperature. For example, the presence of a magma cham-ber along portions of fast-spreading ridges, in combination with seismic data, can provide valuable information to con-struct complex but realistic thermal models under the ridge axis [Dunn et al., 2000]. This information is not widely
avail-able, and additional high-resolution three-dimensional stud-ies of lithospheric structure are required, particularly along slow-spreading ridges.
The study of actual deformed rocks offers some insight into and clues on the rheology and processes operating at depth, complementing both geophysical observations and numerical modeling. The comparison of deformed materials in nature and in the laboratory can provide important con-straints on the mode of deformation of the lithosphere, and on the T-P conditions at which the rocks and deformation tex-tures were formed. In particular, microstructural observations can be used determine the mode of deformation (brittle vs. plastic and dislocation vs. diffusion creep regimes). This infor-mation can be combined with independent constraints on the temperature and pressure (e.g., geothermometry from min-eral phase relationships) via the use of deformation mechanism maps such as that shown in Figure 4. Such studies can provide a deep understanding of the thermal state and history of the lithosphere, and of the deformation processes that operate at depth [Jaroslow et al., 1996; Yoshinobu and Hirth, 2002]. These studies are also required to validate the extrapolation of experimental results from laboratory to natural conditions. Having reviewed these studies of the rheology of ridge materials, we now consider the morphology of ridges, how it is controlled by the rheology, and what further may be learned from it concerning the rheology of the lithosphere.
3. THE THERMAL STRUCTURE OF OCEANIC LITHOSPHERE
To a first approximation, the temperature of the oceanic lithosphere can be calculated assuming conductive cooling with a constant mantle temperature at the base of the thermal plate [Parsons and Sclater, 1977]. Implicit in such models is the assumption that the lithosphere is rigid and does not con-vect on the timescale of thermal conduction. Such models reproduce the general seafloor subsidence with age (depth proportional to the square root of age) for ages <80 Ma. As horizontal heat conduction in the lithosphere is small when compared with the rate of horizontal advection by plate motion, the temperature at depth is mostly a function of age, so slow-spreading ridges display a more rapid increase in lithospheric thickness away from the spreading center than do fast-spreading ridges.
These models break down at ages >80 Ma, as they do not take into account sub-lithospheric convection, which slows plate cooling at large ages [Parsons and McKenzie, 1978;
Stein and Stein, 1992]. They also break down in proximity of
the ridge axis, as they do not accurately model the thermal effects due to the presence of an axial magma chamber, the latent heat of crystallization, or the advective cooling caused
Figure 8. Modified yield strength envelope for a lithosphere
exhibit-ing a field of semibrittle deformation. Both the overall and the peak stress can be significantly reduced compared with the ‘classical’ rheological model. Two models with differing friction laws (Byerlee’s Law and the serpentinite friction law) are shown.
by hydrothermal circulation [Chen and Morgan, 1990a; Davis
and Lister, 1974; Henstock et al., 1993; Lin and Parmentier,
1989; Phipps-Morgan and Chen, 1993; Wilson et al., 1988]. Current reviews on the thermal state near mid-ocean ridge axes are given by [Sinha and Evans, 2003] and [Chen, 2003].
Critical to the thermal state (and rheological structure) of the lithosphere under the ridge axis is the detailed pattern of hydrothermal circulation and the location and mode of emplacement and extrusion of magma in the crust. Con-straints on the axial thermal structure may be more easily obtained and more accurate at fast-spreading ridges than at slow-spreading ones. In addition to a thicker lithosphere, slow-spreading ridges appear to show a heterogeneous crust that implies a non-steady state mode of magmatic accretion [Cannat, 1993; Dick et al., 2000], while the presence of ridge offsets suggests a three-dimensional thermal struc-ture with along-axis variations [Behn et al., 2002a; Shaw, 1992].
Neither the thermal structure nor the details of the hydrothermal cooling process are currently well constrained because of difficulties in sampling appropriate parts of the oceanic crust, or in geophysically imaging these areas or the effects of the processes. Geological constraints on the extent, depth, mode and temperature conditions of hydrothermal alteration are beginning to be obtained from ophiolites, e.g., [Gillis and Roberts, 1999]. [Phipps-Morgan and Chen, 1993] have modeled the general effect of hydrothermalism and show that the yield strength of the lithosphere and its effec-tive elastic thickness depend on the balance between the rate of heat input by magma injection into the crust and the rate of hydrothermal cooling.
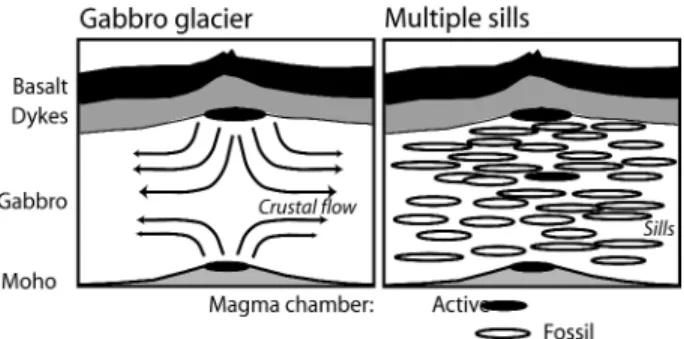
Two broad models exist for magma emplacement into the lower crust at fast-spreading ridges (Figure 9). In the “gabbro glacier” model, emplacement of magma takes place in a shal-low sill-like magma chamber at the base of the sheeted dyke layer (corresponding to the seismically imaged axial magma chamber at fast-spreading ridges). Subsequent freezing and down- and outward movement of the crystallized residue con-structs the lower crust [Henstock et al., 1993;
Phipps-Mor-gan and Chen, 1993; Quick and Delinger, 1993]. The more
recent “multiple sill” model proposes magma injection in multiple lenses throughout the crustal section including near the Moho [Crawford and Webb, 2002; Kelemen and Aharonov, 1998; MacLeod and Yaouancq, 2000]. At present neither model appears to completely satisfy all the available geological and geophysical evidence.
Efforts are underway to better constrain the thermal state below the ridge axis by studying oceanic samples that record the interaction of hydrothermal fluids with the host rock, thus providing constraints on the thermal conditions at which such interaction occurred [Coogan et al., 2002; Manning and
MacLeod, 1996; Manning et al., 2000], and from cooling
rates inferred from grain sizes in ophiolites [Garrido et al., 2001].
4. FLEXURE AND THE ELASTIC PROPERTIES OF THE LITHOSPHERE
Various authors have estimated the effective elastic thick-ness of the lithosphere by measuring its flexural deforma-tion under loads such as seamounts, islands, ridges, fracture zones and trenches [Caldwell et al., 1976; Cazenave et al., 1980; Watts, 1978]. [Goetze and Evans, 1979] used experi-mental rock mechanical data to construct strength yield envelopes (see Figure 1) which could be used to study the elastic properties and bending of the lithosphere. This approach has been extensively used to obtain rheological information from flexural studies [Kirby, 1983; McNutt and
Menard, 1982]. Recent compilations of results from
numer-ous flexural studies are given by [Watts and Zhong, 2000] and [Minshull and Charvis, 2001] (Figure 10). These studies treat the lithosphere as a thin elastic plate overlying an invis-cid substratum, and infer the flexural rigidity D from the shape of the deformed plate and the estimated load. The effective elastic thickness Teis related to D:
D = E Te3/ 12 (1-ν2) (5) where E is Young’s modulus and ν is Poisson’s ratio.
Figure 9. Models of crustal formation for a fast-spreading ridge.
(Left) In the ‘gabbro glacier’ model most of the lower crust is pro-duced from a high-level magma sill at the base of the dyke section by solid flow of the melt residue down and off-axis [Henstock et al., 1993; Phipps Morgan and Chen, 1993; Quick and Delinger, 1993]. A similar process may operate from a magma chamber at the base of the crust. (Right) In the ‘many sills’ model the crust is formed by emplacement of thin melt lenses into the crust at different levels between the Moho and a high-level magma chamber [Crawford and Webb, 2002; Kelemen and Aharonov, 1998]. These magma chambers may be emplaced independently [Kelemen et al., 2000], or as lateral extensions from a magmatic system feeding a high-level magma chamber from the upper mantle [MacLeod and Yaouancq, 2000].
In these studies, the envelope of all results shows an overall increase in the effective elastic thickness with age at time of loading, with most data bounded by the ~600°C isotherm (see Figure 10). This temperature is close to the predicted temper-ature corresponding to the brittle to plastic transition in classi-cal rheologiclassi-cal models (Figure 1). Many measurements, however, give elastic plate thickness estimates that are much smaller than the elastic thickness predicted by this isotherm (Figure 10). Elastic thickness values reported for zero-age oceanic crust range from 0 to >10 km [Bowin and Milligan, 1985; Cochran, 1979; Escartin and Lin, 1998; Kuo et al., 1986; Madsen et
al., 1984; McKenzie and Bowin, 1976; Neumann et al., 1993; Wang and Cochran, 1993] . Estimates of the effective elastic
thickness for the East Pacific Rise tend to be less than 4 km, while those for the Mid-Atlantic ridge range from less than 5 km to more than 10 km, consistent with a slightly thicker lith-osphere under slow-spreading ridge axes. A value of 4 km is reported for the intermediate-spreading Juan de Fuca Ridge [Watts and Zhong, 2000]. However, estimates of elastic thick-ness at slow-spreading ridges may be biased by tectonic mod-ification of both the thickness and seafloor morphology due to tectonic extension along the bounding rift faults [Escartin
and Lin, 1998].
Lithospheric thickness may also be estimated seismically, e.g., by modeling surface-wave dispersion. Such methods yield lithospheric thickness estimates that are larger than those from flexural studies, fitting closer to the 1000°C isotherm [Leeds et al., 1974; Nishimura and Forsyth, 1989]. These discrepancies may be explained by the differences in the strain-rates involved: lithospheric flexure reflects defor-mation on the timescale of millions of years, while passage of seismic waves occurs on a time scale of seconds, empha-sizing the strain-rate dependence of lithospheric rheology (see Figures 1 and 4).
5. THE THICKNESS OF THE SEISMOGENIC ZONE Oceanic intraplate earthquakes occur over a broad range of depths, but a well-defined maximum depth is identifiable and increases with lithospheric age [Wiens and Stein, 1983] (Figure 11). This limit corresponds approximately to the 750°C isotherm, somewhat deeper in the Earth and at a higher tem-perature than that derived from flexural studies, but in agree-ment with the temperature of the brittle to plastic transition [Bergman and Solomon, 1990; Chen and Morgan, 1990a]. [Wiens and Stein, 1983] estimated seismogenic strain rates
Figure 10. Comparison of the temperature structure of an oceanic plate with estimates of elastic thickness of the lithosphere
from flexural studies (adapted from [Minshull and Charvis, 2001]; see also references therein). The thermal models are those of [Parsons and Sclater, 1977] (solid lines) and [Stein and Stein, 1992] (dashed lines). Many of the flexural estimates give significantly lower values for lithospheric thickness than those that may be predicted by the thermal models.
from seismic moment release rates, concluding that they lie in the range of 10-18to 10-15s-1for normal and highly active tectonic lithosphere, respectively. Assuming a dry olivine rhe-ology and using values for the constants in the flow-law equa-tions derived from laboratory rock mechanics experiments, they found that the maximum deviatoric stress that can be supported at 750°C is 20 MPa and 190 MPa at the lowest and highest strain rates, respectively. The critical depths at which these stresses are exceeded differ by only 5–10 km for these two strain rates.
A number of studies have estimated the depth of the seis-mogenic zone at mid-ocean ridges. Centroid depths of tele-seismic events [Huang and Solomon, 1988] show a deepening with decreasing spreading rate, from less than 2 km depth at rates of >20 km Ma-1 to ~6 for <5 km Ma-1(Figure 12). A more detailed view of the distribution of seismicity is avail-able from microseismicity studies using ocean-bottom seis-mometers that have been conducted on a limited number of mid-ocean ridge sites. Maximum hypocentral depths for the very slow-spreading South West Indian Ridge range from 6 to 10 km [Katsumata et al., 2001]. Studies along the Mid-Atlantic ridge show a large variation in maximum hypocentral depth, both regionally and locally, ranging from <4 km to >10 km below seafloor, so that the deeper events occur within the upper mantle [Barclay et al., 2001; Kong et al., 1992; Louden
et al., 1986; Tolstoy et al., 2002; Toomey et al., 1988; Toomey et al., 1985; Wilcock et al., 1990; Wolfe et al., 1995]. Some
slow-spreading segments show seismicity limited to shallow levels, with maximum depths of ~4 km (e.g., OH1 segment [Barclay et al., 2001]). This shallow limit on the seismicity was originally attributed to the commonly assumed weak nature of
the lower crust, although recent work suggests that the lower crust is strong [Hirth et al., 1998] so this shallow seismicity most likely reflects a thin lithosphere at this location. Other slow-spreading segments, such as the 29°N area of the Mid-Atlantic Ridge, show hypocenter depths that vary from <6 km at the segment center to >9 km under the inside corner at the segment end [Wolfe et al., 1995], thus reaching into the upper mantle (Figure 13). In most cases the seismicity tends to cluster near these maximum depths, with a zone of lesser activity in the upper crust and a relatively aseismic zone in between. Maximum hypocentral depths at medium and fast-spreading ridges tend to be smaller. They are on the order of 1.5–3.5 km at the Juan de Fuca Ridge [Wilcock et al., 2002], 3–5 km at the fast-spreading East Pacific Rise near transform faults [Lilwall et al., 1981], and <3 km away from transforms [Tolstoy et al., 2002]. Variations in the maximum hypocen-tral depths therefore reflect the overall trends in elastic thick-ness inferred from flexural studies.
In the next sections we review some of the main observa-tions regarding rift valley morphology, crustal thickness vari-ations, and lithospheric composition as constrained from geophysical and geological investigations. These data are crit-ical for constraining the composition of the lithosphere and the geometry of its different components, which in turn are required to construct more realistic and better constrained rheological models.
6. THE MEDIAN VALLEY AND THE AXIAL HIGH An important characteristic of slow-spreading mid-ocean ridges is the median valley (Plate 1). Along many sections of
Figure 11. Oceanic intraplate earthquake depths as a function of lithospheric age. The dashed lines correspond to the
300°C and 600°C isotherms, and the brittle to plastic transition for olivine is indicated by the continuous line (~750°C). After [Wiens and Stein, 1983].
slow-spreading ridges there is an axial rift, several kilome-ters wide and 1–3 km deep, which is produced by stretching and necking of the lithosphere under horizontal tension as plates separate [Chen and Morgan, 1990a; Lin and
Parmen-tier, 1989; Tapponnier and Francheteau, 1978]. At
fast-spread-ing ridges the median valley disappears and is replaced by an axial high, which reflects dynamic viscous support and flex-ural bending of a thin plate over a hot axial region [Buck, 2001; Chen and Morgan, 1990b; Eberle and Forsyth, 1998;
Madsen et al., 1984; Wang and Cochran, 1993]. Transitional
morphologies are found at intermediate-spreading ridges, and other effects, such as the presence of hotspots, also play a role on ridge morphology, e.g., [Canales et al., 1997; Searle
et al., 1998b].
Such a morphological transition is shown by simple rheo-logical models that assume a brittle layer overlying power-law creep rheology, passive mantle upwelling driven by plate sep-aration, and incorporating the effects of both hydrothermal cooling and the latent heat of crystallization [Chen and
Mor-gan, 1990a; Chen and MorMor-gan, 1990b]. Rift valley
mor-phology is therefore a general indicator of the mechanical properties and overall thermal state of the lithosphere under
the ridge axis. These early rheological models assumed a weak lower crust deforming plastically and decoupled from the stronger upper mantle [Chen and Morgan, 1990a; Shaw
and Lin, 1996]. This plastically deformed zone was thought
to be associated with the aseismic zone often observed in microseismicity studies (Figure 13). The decoupling zone in these models is narrow at slow-spreading ridges: in the high-stress axial zone, the brittle upper crust exceeds its strength, fails, and is subsequently deformed plastically by the diverg-ing ductile mantle (neckdiverg-ing) to produce the rift valley. At faster spreading rates the axial region is hotter so the decou-pling zone (ductile lower crust) is wider and exceeds the width of the zone of brittle failure. The thin and very weak axial lithosphere is thus decoupled from the mantle flow and, in these models, achieves almost perfect local isostatic equi-librium, producing an axial high, since there is little dynamic support for the topography.
The behavior of the [Chen and Morgan, 1990a] model depends critically on the crustal thickness. A thinner crust may reduce or totally remove the lower crustal decoupling zone, and the model then predicts a wider and deeper rift val-ley; this model has been invoked to explain the presence of an axial valley along the Australia–Antarctic Discordance [Chen
and Morgan, 1990a; Hirth et al., 1998], where the mantle is
inferred to be cold and to have a very low degree of melting [Weissel and Hayes, 1974]. By contrast, hotter mantle results in thicker crust, as observed near hotspots (e.g., Reykjanes Ridge [Bunch and Kennett, 1980]); the decoupling zone is then wider than the failure zone, and the lithosphere behaves like the fast-spreading case, producing an axial high [Chen and
Morgan, 1990b]. This model was adopted and developed by
[Neumann and Forsyth, 1993] and [Shaw and Lin, 1996] to
Figure 12. Plot of centroid depth versus half spreading rate for
mid-ocean ridge axis earthquakes [Huang and Solomon, 1988]. As the cen-troid depth corresponds to the weighted centre of the focal volume, the inferred maximum depth of faulting is double this. These data are in agreement with the distribution of microseismicity along the northern Mid-Atlantic Ridge (grey box; see [Barclay et al., 2001] and references therein). The solid line (PM&C’93) corresponds to the 750°C isotherm in the thermal models of [Phipps Morgan and Chen, 1993].
Figure 13. Distribution of microseismicity along the axis of a
slow-spreading ridge segment (Mid-Atlantic Ridge, 29°N; see Plate 1 for location) over a 42 day period. Microseismicity clusters in three areas, at depths from 2 km to 9 km, mostly in the lower crust and upper mantle. Note that the mid-crust is relatively aseismic at depths ~ 5 km. After [Wolfe et al., 1995].
Plate 1. Shaded relief bathymetry over the southernmost two thirds of the 29°N segment of the Mid-Atlantic Ridge,
illu-minated from the northwest [Searle et al., 1998a] and unpublished data]. Note the well-defined fault scarps facing towards the ridge axis, which outline both the median valley floor (centered at 29°02’N, 43°10’W), and the >1.5 km scarp at 28°55’N, 43°18’W that defines the inside corner high centered near 29°N and 43°20’W. The line corresponds to the axial section showing the microseismicity in Figure 13.
explain variations in seafloor morphology and faulting as a response to variations in the rheological structure along the ridge axis.
Recently this ‘weak crust’ model has been questioned on the basis of new experimental rheological data and geological arguments [Hirth et al., 1998; Hirth and Kohlstedt, in press]. Recent experimental work on the rheology of dry diabase shows that this rock, at geologically relevant conditions, is much stronger than the wet ‘diabase’ reported in earlier exper-imental work, and has a similar strength to that of olivine [Mackwell et al., 1998]. As water is a highly incompatible element in the mantle and present in small quantities, it is partitioned into the melt. As a consequence, both the mantle, having undergone a small amount of melting [Hirth and
Kohlstedt, 1996], and the lower crust, formed by cumulate
gabbros from which the melt (and hence the water) has been extracted, are nominally dry. Therefore, rheological models of the lower crust should adopt a ‘dry’ diabase rheology instead of the ‘wet’ one commonly used. Later hydration of the crust can occur due to circulation of fluids in the lithosphere, but this process requires the presence of fractures and interconnected porosity that is only possible in the brittle regime. This hydra-tion will have consequences for the rheology of the brittle lithosphere (e.g., serpentinisation [Escartin et al., 1997a]), but it is unlikely to affect the plastic, impermeable levels of the lithosphere. [Hirth and Kohlstedt, in press] suggest that in fact weak lower crust is less critical to these models than sug-gested by [Chen and Morgan, 1990a], and that increasing temperature may be the dominant effect rather than a weak lithology. Moreover, the isostatic balance of the axial high has also been questioned, and more recent work suggests that the high is regionally supported by dynamic viscous flow [Eberle and Forsyth, 1998] or by stresses in the brittle litho-sphere [Buck, 2001].
The presence of a continuous magma chamber at fast-spreading ridges [Babcock et al., 1998; Vera et al., 1990] and its absence at slow-spreading ridges [Detrick et al., 1990; Lin
et al., 2003] demonstrates that the rheological structure of
fast and slow-spreading ridges are fundamentally different [Poliakov and Buck, 1998]. A magma lens at shallow crustal levels necessarily implies that the brittle layer above it is very thin and can be easily faulted or dissected by dykes. In con-trast, the emplacement of discrete and ephemeral magma chambers in the thick lithosphere of slow-spreading ridges will result in large temporal variations in the rheological struc-ture of the ridge axis. Over long periods of time, the thickness of the lithosphere at slow-spreading ridges can thus be assumed to be large and to vary gradually along the length of ridge segments, as indicated by the gradual variation in rift valley width and depth along axis. A thin lithosphere may be expected immediately after the emplacement of a magma chamber, but
such events must be limited both spatially and temporarily so as to maintain the axial rift valley.
7. MORPHOLOGY AND CRUSTAL ARCHITECTURE OF RIDGE SEGMENTS
The use of swath bathymetry, gravity and seismic studies along segmented slow-spreading ridges such as the Mid-Atlantic Ridge have revealed systematic along-axis varia-tions from the segment ends to the segment center [Detrick et
al., 1995; Hooft et al., 2000; Hosford et al., 2001; Kuo and Forsyth, 1988; Lin et al., 1990; Magde et al., 2000; Purdy et al., 1990; Searle et al., 1998a; Sempéré et al., 1995; Thibaud et al., 1998] (Plate 1). Segments tend to be shallower and
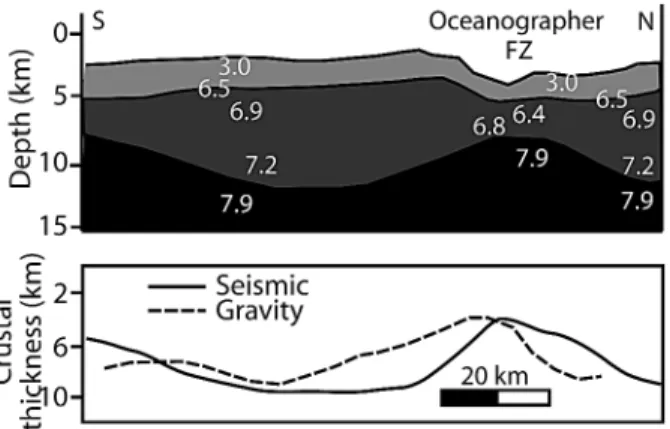
have a thicker crust at the segment center, which is considered to be an indication of focused magmatic accretion at the mid-point [Lin et al., 1990; Magde et al., 1997; Tolstoy et al., 1993]. Crustal thickness variations along a segment can be as large as 7 km, with thicknesses of <3 km at the segment end increasing to >9 km at the center, e.g., [Hooft et al., 2000]. Seismic data also show that the thickness variations occur primarily in layer 3 (Vp~ 6.8 – 7.2 km/s), while the thickness of layer 2 remains relatively constant (Figure 14). Ultra slow-spreading ridges such as the South West Indian Ridge show a more extreme focusing of melt, with the construction of large central volcanoes at the centers of some segments while others are relatively magmatically starved [Cannat et al., 1999; Dick et al., 2003; Fujimoto et al., 1999; Michael et al., 2003]. Segments have a typical length of 40–90 km [Schouten
et al., 1985] and are generally sub-perpendicular to the
direc-tion of relative plate separadirec-tion, although highly oblique seg-ments are found near hotspots [Abelson and Agnon, 1997;
Searle et al., 1998b] and in extended regions of oblique
spread-ing [Taylor et al., 1994].
Figure 14. Along-axis variation of crustal thickness based on
seis-mic observations (top) and gravity modeling (bottom). Note that the direction of the gravity scale is reversed. After [Detrick et al., 1995].
Segments are laterally offset from each other by up to 30 km in “non-transform discontinuities” (NTDs), or by transform faults that normally accommodate larger offsets [Fox et al., 1991; Grindlay et al., 1991; Grindlay et al., 1992]. NTDs leave wakes of depressed seafloor that show along-axis migra-tion rates comparable to the spreading rate or higher
[Klein-rock et al., 1997], and that can lead to the lengthening and
shortening of segments, and to their nucleation or extinction [Gente et al., 1995; Rabain et al., 2001; Tucholke et al., 1997]. NTD migration along axis may be driven by changes in plate motion, differential variations in the relative magma supply or thermal state of adjacent segments [Phipps Morgan and
Sandwell, 1994; West et al., 1999]. In some cases
“magmat-ically robust” segments, characterized by a shallow axis and narrower axial valley at the segment center, and showing evi-dence of voluminous volcanism, tend to grow at the expense of adjacent segments by the migration of the NTDs away from the segment center [Gente et al., 1995; Rabain et al., 2001;
Thibaud et al., 1998]. NTD migrations can also be driven by
pressure gradients induced by topographic gradients across discontinuities [Phipps Morgan and Parmentier, 1985].
In the longer term, asymmetric spreading between adjacent spreading segments can vary the ridge offset, and promote a change from an NTD to a rigid, non-migrating transform fault or vice versa [Grindlay et al., 1991]. The actual mechanism of NTD propagation is poorly understood, but requires the along-axis propagation of dykes and extensional faults into the crust formed at the adjacent segment across the segment boundary. Large offsets (>~30 km) will result in a thicker, cooler and therefore stronger lithosphere across a discontinuity, thus arresting the propagation of dykes and faults across it.
Similar plate-boundary segmentation is observed at both intermediate and fast-spreading ridges, but without the major morphological and crustal thickness changes observed at slow-spreading ridges. Crustal thickness variations along fast-spreading ridges and away from major transform offsets are of a much smaller amplitude (typically < 2 km) than those observed at slow-spreading ridges [Bazin et al., 1998; Canales
et al., 1998; Madsen et al., 1990]. The detailed morphology
of the axial volcanic ridge does not directly correlate with the presence of a magma chamber, as some, but not all, discon-tinuities appear to be underlain by well-developed melt lenses [Bazin et al., 2001; Kent et al., 2000]. The presence of a melt lens above a zone of hot crust, possibly containing small amounts of melt, probably results in a weak crust that can deform plastically to accommodate variations in morphology and structure associated with ridge segmentation at the surface [Bell and Buck, 1992].
Slow-spreading ridges have characteristic tectonic patterns that demonstrate that both the seafloor morphology and the crust formed at the ridge axis undergo significant
modifica-tion at the rift bounding walls [Escartin and Lin, 1998] (see Figures 14, 16). Along the ridge axis, the shallowest point in the rift valley and the thickest crust are located at the seg-ment center, and the thinnest crust is found below the ridge dis-continuities. Outside the rift valley, the shallowest points are commonly located in close proximity to the segment ends, at the inside corners of the ridge-transform or ridge-NTD inter-sections, while the thinnest crust is found under the elevated inside corners, where the topography must be dynamically supported [Escartin and Lin, 1995; Rommevaux-Justin et al., 1997; Tucholke et al., 1997]. The outside corners are com-monly more subdued topographically and tectonically, indi-cating asymmetric tectonic processes and uplift [Severinghaus
and Macdonald, 1988].
Ridge segmentation is generally agreed to be intimately associated with the pattern of melt delivery at mid-ocean ridges, although the ultimate cause of segmentation remains uncertain. While some models have suggested that segmen-tation may be controlled by focused mantle upwelling or mantle diapirs [Lin and Phipps Morgan, 1992; Lin et al., 1990; Whitehead et al., 1984], numerical modeling suggests that, for realistic viscosities, the characteristic size of diapirs exceeds the characteristic length of slow-spreading ridge seg-ments [Barnouin-Jha et al., 1997; Sparks and Parmentier, 1993]. Segmentation is more likely controlled by brittle processes in the lithosphere [Macdonald et al., 1991b;
Mac-donald et al., 1986; Pollard and Aydin, 1984], with some
interaction and feedback with magmatic processes (e.g., focusing of melt to the center of segments at slow-spread-ing ridges). This feedback is supported by the apparent con-stant average melt supply from the mantle to three adjacent segments of different length along the Mid-Atlantic Ridge that otherwise display important differences in the absolute variations in crustal thickness along individual segments [Hooft et al., 2000]. Initial melt focusing at the segment cen-ter can be achieved by melt migration along axis at the base of the lithosphere (following shallowly dipping isotherms), or by focusing within the lithosphere itself [Magde and Sparks, 1997; Magde et al., 1997; Sparks and Parmentier, 1993]. The thinner crust at the ends of slow-spreading ridge seg-ments results from along-axis dyke propagation from the segment center [Hooft et al., 2000; Lawson et al., 1996]. This crustal structure formed at the ridge axis, as mentioned above, is later modified [Canales et al., 2000b; Hosford et al., 2001] by extensional faulting along the rift valley walls [Escartin and Lin, 1998] as the crust is rifted off axis. The asymmetry in crustal thickness between inside and outside corners may result from initial asymmetric crustal accretion [Allerton et al., 2000], possibly followed by asymmetric tec-tonic thinning [Escartin and Lin, 1998]. A summary of these processes is shown in Figure 15.
8. LITHOLOGICAL STRUCTURE OF MID-OCEAN RIDGES
Geological observations and sampling of both fast- and slow-spreading ridges demonstrate that these have funda-mental differences in the composition and architecture of the crust below the ridge axis and the mode of magmatic accre-tion. Sampling of normal oceanic crust formed along fast-spreading ridges yields basaltic rocks extruded at the seafloor
(upper seismic Layer 2). Lithologies that have been emplaced within lithosphere at deeper levels, such as diabase, gabbros (lower seismic layer 2 and layer 3 of the crust) and peridotite (mantle) are only found along transform faults or rift zones [Früh-Green et al., 1996; Karson, 1998; Karson et al., 2002;
MacLeod and Manning, 1996; Mével and Stamoudi, 1996]. In
these areas the pre-existing oceanic crust has been rifted and sections of the crust and deeper lithospheric levels exposed to the seafloor. Ocean drilling at site ODP 504B [Shipboard
Sci-entific Party, 1993; Shipboard SciSci-entific Party, 1995] ,
cor-responding to intermediate-spreading crust, has revealed a 600 m thick layer of extrusive basalts, underlain by an ~200 m thick transitional zone in turn underlain by at least 1 km of sheeted dykes. Correlations of physical properties (e.g., mic velocity) and recovered lithologies demonstrate that seis-mic velocity reflects variations in porosity rather than composition, as often assumed [Detrick et al., 1994].
Sampling of slow-spreading ridges demonstrates that the simple layered structure is not correct for these ridges
[Can-nat, 1993; Can[Can-nat, 1996]. Here, outcrop of gabbro and
peri-dotite (mostly serpentinized) at the seafloor is relatively common, and was recognized early on [Aumento and Loubat, 1971; Auzende et al., 1989; Bonatti and Hamlyn, 1978;
Bon-atti and Harrison, 1976; Dick, 1989; Engel and Fischer, 1953; Hekinian, 1968; Juteau et al., 1990; Melson et al., 1966; Prinz
et al., 1976]. These “deeper” rocks are most commonly found at the ends of slow-spreading segments and at inside corners, where the geophysically defined crust is thinner, and where tec-tonic processes appear to be more effective in exposing deeper lithologies. Tectonic models have been put forward in which the crust is extremely thin or altogether absent from inside corners (Figure 16), and deep lithologies are exposed along large-offset faults [Blackman et al., 1998; Cann et al., 1997;
Cannat, 1993; Cannat, 1996; Dick et al., 1991; Karson, 1998; Karson and Lawrence, 1997; Kurewitz and Karson, 1997; Tucholke and Lin, 1994].
Peridotite outcrops are not restricted to the ends of seg-ments or ridge discontinuities, but may also found along the centers of some segments [Cannat, 1993; Cannat and Casey, 1995; Cannat et al., 1997; Cannat et al., 1995; Dick, 1989;
Lagabrielle et al., 1998]. While it is thought that these
segment-center peridotites may be more common at ultra-slow-spread-ing rates or ridges overlyultra-slow-spread-ing unusually cold mantle, they are not restricted to such cases, and the precise conditions for their occurrence are not yet understood. These peridotite out-crops extend over several kilometers along the ridge axis, and are often capped by a thin layer of extrusive basalts. Although often referred to as “amagmatic”, such crust may actually contain ~ 25% gabbro intruded into the peridotite [Shipboard
Scientific Party, 2003]. Sections of ultra slow-spreading
cen-ters, such as the Gakkel ridge and South West Indian Ridge,
Figure 15. Block model of varying fault style along a
slow-spread-ing ridge segment, modified from [Shaw, 1992; Shaw and Lin, 1993]. Crust is indicated by light grey shading, but the crust-man-tle boundary is dashed to emphasise that it is unlikely to be a sim-ple layered structure, but comprises a mixture of melt-derived rock (gabbro, diabase and basalt) and peridotite (see also Figure 16). Mantle wells up strongly under the segment centre (A), producing a high thermal gradient, enhanced melting and therefore thin lith-osphere but thick crust (B). These conditions yield a weak litho-sphere that deforms by closely-spaced, relatively low-amplitude faulting (C). Weaker mantle upwelling at segment ends (D) leads to lower thermal gradient, less melting, and therefore a thicker litho-sphere and thinner crust (E). However, asymmetric crustal accretion at the segment end (F) leads to thicker crust under the outside cor-ner [Allerton et al., 2000], which weakens the thermally thicker lithosphere there so that the BPT is shallower (G) than under the inside corner (E). Consequently the faulting style at the outside corner (H) is similar to that at the segment centre (C)[Escartin et al., 1999], while the stronger lithosphere at the inside corner can sup-port much larger but more widely spaced faults (J). The different fault styles are accommodated by across-axis linking of faults ([Searle et al., 1998a], K). It is likely that the growth of large faults at the inside corner is also facilitated by weakening of the fault through ser-pentinisation [Escartin et al., 1997a].
in addition to a geophysically thin crust, display ridge sec-tions that correspond to tectonic stretching of the mantle lith-osphere with little or no magmatism [Coakley and Cochran, 1998; Cochran et al., 2003; Dick et al., 2003; Jokat et al., 2003; Lin et al., 2003; Michael et al., 2003].
These geological observations are inconsistent with a lay-ered crustal model, as in most cases the fault scarps do not have sufficient throw to expose lower crustal and upper mantle lev-els. Instead, the geological constraints indicate that the crust can be compositionally heterogeneous [Cannat, 1993; Cannat, 1996; Cannat et al., 1995], that transitions from a “magmatic” to a discontinuous or absent crust can occur along individual segments, and that the process of magmatic accretion is not continuous. Instead, magma is emplaced in discrete bodies in the thick, cold lithosphere, feeding the axial volcanism (Figure 16). The continuity and thickness of the crust will therefore depend on the relative supply of magma (which may itself vary with time and position) with respect to plate sep-aration, and the seismic velocities that define the “crust” may be a complex function of composition, alteration and crack-ing of the lithosphere. Recent seismic studies at slow-spread-ing ridges have shown variations in crustal thickness and seismic velocities that are consistent with this compositionally heterogeneous lithospheric model [Barclay et al., 1998;
Canales et al., 2000a; Canales et al., 2000b]. The size and
distribution of the different lithologies are still largely uncon-strained, due both to the lack of sufficiently high resolution seismic data, and to the impossibility of distinguishing seis-mically between lithologies such as partially serpentinized peridotite and gabbro [Carlson, 2001; Christensen, 1972;
Horen et al., 1996].
Geological observations demonstrate that the crustal archi-tecture and the processes responsible for its build up differ substantially from fast to slow-spreading ridges. Fast-spread-ing ridges display a homogeneous, layered crust that is formed with high melt supply and a relatively stable mag-matic system (i.e., near-continuous axial magma chamber,
frequent eruptions, etc.) In contrast, slow-spreading ridges show a wide range of crustal composition, structure and thickness, with important variations both regionally and along individual segments. This complexity arises from a discontinuous mode of magma emplacement (discrete gab-bro bodies), and from a wide variation in the magma supply to the ridge axis, ranging from no magmatism (e.g., exten-sion by pure stretching of the mantle lithosphere such as at Gakkel Ridge and parts of the South West Indian Ridge [Dick et al., 2003]), to well-developed and magmatically robust ridge segments that locally have crustal thicknesses exceeding 8 or 9 km (e.g., OH1 and Lucky Strike segments along the Mid-Atlantic Ridge [Escartín et al., 2001; Hooft
et al., 2000], or other segments along the South West Indian
Ridge [Cannat et al., 1999]). Realistic rheological models of mid-ocean ridges must treat fast- and slow-spreading ridges separately, as these systems operate differently, and do not appear to represent end-members of an accretion process with gradual variations in magma supply. These fundamen-tal differences relate both to the composition and thermal structure of the lithosphere, and to the time-dependence of the processes involved in magmatic accretion and lithos-pheric construction.
9. FAULTING AT MID-OCEAN RIDGES Tensional stresses induced by plate separation results in disruption of the upper crust (brittle lithosphere) by normal faults that dissect the ocean floor [Searle, 1992]. On the slow-spreading Mid-Atlantic Ridge, most active faulting occurs within about 10–15 km of the ridge axis [McAllister and
Cann, 1996; McAllister et al., 1995; Searle et al., 1998a].
The width of the active tectonic zone at fast-spreading ridges is less well constrained, though there is some evidence that it extends to ~30 km off-axis [Macdonald, 1998]. Variations in faulting patterns regionally (e.g., fast vs. slow-spreading ridges) and locally (along individual segments) can therefore
Figure 16. Along-axis variation in crustal thickness and lithology after [Cannat et al., 1995]. Continuous white line
rep-resents the base of the lithosphere, approximately following an isotherm. White, sub-vertical lines represent mantle dykes. Note variations in crustal thickness and discontinuous nature of lower crust (gabbroic layer) at segment ends.
provide insight into the rheological structure of the lithosphere and its spatial variations.
High-angle faulting is responsible for the formation of abyssal hill terrain, and estimates of tectonic strain at the seafloor indicate that <10–20% of the plate separation is taken up by such faulting [Allerton et al., 1996; Bohnenstiehl and
Carbotte, 2001; Bohnenstiehl and Kleinrock, 1999; Carbotte and Macdonald, 1994; Carbotte et al., 2003; Escartin et al.,
1999; Jaroslow et al., 1996; Macdonald and Luyendyk, 1977], while the rest must be taken up by magmatic emplacement or amagmatic accretion of mantle asthenosphere into the lith-osphere. A similar value of ~10% tectonic strain has been obtained from seismic moment release studies in the case of slow-spreading ridges [Solomon et al., 1988].
Faults are normally orthogonal to the spreading direction, except in oblique-spreading regions such as near hot spots and in proximity to NTDs. Faults identified in shipboard bathymetry and sonar data have a typical spacing on the order of 1–3 km, and lengths of tens of kilometers along the axial direction [Cowie et al., 1994; Macdonald et al., 1991a; Searle, 1984]. Faulting patterns at slow- and fast-spreading ridges differ substantially and reflect the fundamental differences in the structure and thermal state of the lithosphere under the axis in these two environments.
9.1. NormalFaulting at Slow-Spreading Ridges
Slow-spreading ridges are characterized by faults with throws that are an order of magnitude larger than those found at fast-spreading ridges (typically hundreds of meters to kilo-meters compared to <100 m). These faults are mostly fac-ing the ridge axis, and produce a typical ridge-parallel abyssal hill terrain [Bohnenstiehl and Kleinrock, 2000; Goff, 1992;
Tucholke et al., 1997] with vertical relief of ~1 km. The traces
of faults show spatial variations that appear to be systemat-ically linked to the geometry of slow-spreading ridge seg-ments [Escartin et al., 1999; Escartin and Lin, 1995; Searle
et al., 1998a; Shaw, 1992; Shaw and Lin, 1993]. At the
cen-ters of “typical” slow-spreading ridge segments, faults tend to define a symmetrical axial valley with similar fault size and strain distribution at each flank (Figure 15). Mature faults have moderate throws (a few hundred meters at most) and are spaced 1–2 km apart. These faults grow from individual small faults that link to form larger structures [Cowie and
Scholz, 1992; Cowie et al., 1993; Searle et al., 1999; Searle et al., 1998a]. In contrast, segment ends are characterized
by a marked asymmetry in topography and crustal thickness [Escartin and Lin, 1995; Severinghaus and Macdonald, 1988;
Tucholke and Lin, 1994] that is associated with profound
dif-ferences in fault patterns. It was early recognized that faults near segment ends had a larger throw and spacing that those
near the segment center [Shaw, 1992], but the overall tec-tonic strain does not seem to vary between segment end and segment center [Escartin et al., 1999]. Asymmetry in tec-tonic strain can be important and extend along the whole length of a segment, and may be associated with a comple-mentary asymmetry in magmatic accretion [Allerton et al., 2000; Escartin et al., 1999; Searle et al., 1998a].
These variations in fault patterns have been interpreted to reflect broad variations in the overall strength of slow-spread-ing oceanic lithosphere, with a thicker lithosphere at the seg-ment end than at the center [Behn et al., 2002a; Behn et al., 2002b; Jaroslow, 1996; Shaw, 1992; Shaw and Lin, 1996]. Other processes, such as fault weakening due to alteration of the mantle (e.g., via serpentinisation) can promote efficient strain localization and therefore influence faulting patterns observed at the seafloor. While these studies have provided some insight into the expected variations in lithospheric thick-ness along ridge segments, an accurate interpretation of fault patterns in the light of the thermal state of the lithosphere, its composition, and the mode of strain localization is still required. Numerical models incorporating processes such as fault weakening have been successful in reproducing, in two dimen-sions, the broad characteristics of seafloor topography at slow-spreading ridges, with median valley and abyssal hills of the appropriate wavelength and height [Buck and Poliakov, 1998;
Poliakov and Buck, 1998] (Plate 2a). These models
incorpo-rate an elastic-plastic-viscous layer, a temperature- and strain-rate-dependant brittle to plastic transition, and fault weaken-ing by the reduction of cohesion of fault material. The mod-els, which do not include any magmatic accretion, predict strain localization along lithospheric-scale faults. These faults advect mantle asthenosphere whi ch is then accreted into the lithosphere. Models such as this demonstrate the importance of strain localisation in producing the observed ridge topog-raphy, and underline the importance of understanding the rhe-ological properties that cause this to occur.
9.2. Detachment Faulting
Low-angle normal faults accommodating large amounts of displacement (detachment faults) have long been recognized in continental settings [Davis and Lister, 1988]. The presence of oceanic low-angle faults had been proposed early on [Dick
et al., 2000; Dick et al., 1991; Dick et al., 1981; Karson and Dick, 1983; Mével et al., 1991] to explain the outcrop of basalt
and gabbro, but the extent and geometry of the detachment fault surface was not defined. Oceanic detachments were first unambiguously identified on the Mid-Atlantic Ridge at 31°N [Cann et al., 1997], as smooth, curved and sub-horizontal surfaces with corrugations (“mullions”) parallel to the spread-ing direction. Numerous such structures have now been
iden-Plate 2. Numerical simulation of lithospheric stretching and strain localization. a: (top) Amagmatic stretching produces
a seafloor topography that resembles that at slow-spreading ridges, with an axial valley and abyssal hills formed by many cross-cutting shear zones at the ridge axis [Buck and Poliakov, 1998]. b: (bottom) Detachment formation in numerical mod-els that incorporate fault weakening. Under certain conditions deformation stabilizes for long periods of times and produces structures that have a similar geometry to the topography observed at oceanic detachments. The extent of the detachment is indicated by the grey bar, and the advection of mantle lithosphere can be tracked by the left-hand dashed white line, which indicates the present-day position of a marker originally at the base of the model [Lavier et al., 1999].