Electronic Properties of The Mg
2Si Thermoelectric Material
1
Investigated by Linear-Response Density-Functional Theory
2
P. Boulet,1 M. J. Verstraete,2 J.-P. Crocombette,3 M. Briki,4 and M.-C. Record5
3
1Universit´e Aix-Marseille I II et III,
4
Laboratoire Chimie Provence, UMR-CNRS 6462,
5
Avenue Escadrille Normandie-Niemen,
6
13397 Marseille cedex 20, France∗
7
2
D´epartement de Physique, Universit´e de Li`ege, B-4000 Li`ege, Belgium
8
3CEA, Saclay, DEN/SRMP, 91191 Gif-sur-Yvette Cedex, France
9
4Universit´e Aix-Marseille I, II et III,
10
Laboratoire Chimie Provence, UMR-CNRS 6462,
11
Avenue Escadrille Normandie-Niemen,
12
13397 Marseille cedex 20, France
13
5Universit´e Aix-Marseille III, Institut Mat´eriaux
14
Micro´electronique Nanosciences de Provence, UMR-CNRS 6242,
15
case 142, Avenue Escadrille Normandie-Niemen,
16
13397 Marseille Cedex 20, France
Abstract
18
This paper presents Density-Functional Perturbation Theory (DFPT) calculations on
19
the electronic, vibrational, and electron-phonon (EP) coupling properties of the Mg2Si
20
thermoelectric compound. The DFPT yields very satisfactory results for the electronic
21
and vibrational properties when compared to experiment. Regarding the EP interactions,
22
as far as we know, they have never been reported so far. We show that the EP interactions
23
in Mg2Si mainly involve the silicon atom. This result explains the improvement of the
24
thermoelectric properties of Mg2Si using a solid solution Mg2Si1-xAx, where A is a heavier
25
atom than Si. By guiding the choice of the substitution site, the study of the EP coupling
26
properties could be used in the search of new thermoelectric materials based on solid
27
solutions.
28
PACS numbers: 63.20.dk,63.20.kd,71.15.Mb,72.15.Eb
29
Keywords: Ab initio, electron-phonon interaction, thermoelectricity, silicide compounds, Mg2Si
I. INTRODUCTION
31
For about two decades, needs for new sources of energy have made research on
32
thermoelectric materials regaining interest. Among these materials, silicide
com-33
pounds are promising ones for high temperature applications1 (500-800 K). The
34
efficiency of a thermoelectric material is measured by its figure of merit ZT = S2σ
κ T,
35
where S is the Seebeck coefficient, σ is the electrical conductivity, κ is the thermal
36
conductivity, and T is the temperature. ZT can then reach high values when the
37
thermopower S2σ is high and when κ is small. ZT is a dimensionless figure, and
38
good thermoelectric materials are characterized by ZT ≥ 1.0. Both an electronic
39
and lattice conductivity contribution participate to the total thermal conductivity,
40
and in virtue of the Wiedemann-Franz law, the electronic thermal conductivity and
41
the electrical one are related to one another. Since the processes of electrical and
42
electronic thermal conductivities in materials are related to the electron-phonon
43
(EP) interaction, the comprehension of the EP coupling is desired to understand the
44
behaviour of the material and to improve its thermoelectric properties. The work
45
presented in this paper is mainly devoted to the theoretical study of the EP coupling
46
in the Mg2Si silicide compound. Electrical and electronic thermal conductivities
47
were also calculated.
48
49
II. LITERATURE DATA
50
Mg2Si crystallizes in a face centered cubic (FCC) Bravais lattice with primitive
51
translation vectors a = a(0,1 2, 1 2), b = a( 1 2,0, 1 2) and c = a(0, 1 2, 1 2) where a is the 52
lattice parameter which equals to 0.635 nm. The structure symmetry of Mg2Si
53
is O3
h, the corresponding space group is Fm¯3m (group number 225)2. Three
equivalent sites can be specified in the irreducible unit cell, namely Si: a(0, 0, 0), 55 Mg: a(1 4, 1 4, 1 4), and Mg: a( 3 4, 3 4, 3
4). Mg2Si belongs to the antifluorite structure family.
56
57
Elastic constants and bulk modulus of Mg2Si have been given in Ref.3. The values
58
are C11 = 126 GPa, C12= 26 GPa, C44= 48.5 GPa, and B = 49 GPa.
59
60
The electronic and vibrational properties of Mg2Si have been widely studied in
61
the literature.
62
Mg2Si is a n-type semi-conductor with indirect gap of energy 0.66–0.78 eV (Γv →
63
Xc)4–6. The direct gap of Mg2Si was determined by Vazquez et al. using
electrore-64
flectance experiment, and it amounts to 2.27 eV (Γv → Γc)7. Pseudopotential8,
65
density-functional theory (DFT)9, and GW10 methods were used to calculate
elec-66
tronic properties of Mg2Si. The reported data are gathered in Table I. Au-Yang et
67
al. determined the electron band structure of Mg2Si using empirical pseudopotential
68
method11.
69
Phonon dispersion relation of Mg2Si was measured by neutron scattering studies
70
at 293 K in 1988 by Hutchings et al.12. The experimental LO-TO splitting amounts to
71
about 60 cm−1. Raman scattering13
and infrared reflectivity spectroscopy14
measure-72
ments were also reported. Theoretical investigations using density-function theory
73
were carried out on the phonon band structure and infrared vibrational frequencies
74
of Mg2Si9,15. The corresponding data are given in Table II.
75
76
The electrical resistivity and thermal conductivity were recently measured for
77
Mg2Si16–19 and its solid solution with antimony17,18, bismuth16,19, silver19 and tin20.
78
We gather the transport property values for Mg2Si into Table III. The electrical
79
resistivity and total thermal conductivity were found to amount to about 0.07 Ω cm
80
and 10 W m−1 K−1, respectively. Using the Wiedemann-Franz equation, one can
estimate the electronic part of the thermal conductivity, which amounts only to
82
about 0.1 W m−1 K−1, i. e. around 1 % of the total thermal conductivity. Finally, it
83
should also be mentioned that a detailed, experimental study of the lattice thermal
84
conductivity caused by phonon-phonon scattering (normal and umklapp processes)
85
was performed on Mg2Ge and Mg2Si21. Since we do not account for these
phenom-86
ena in the present study, we will not report further on the results of this investigation.
87
88
From the literature data reported above it can be seen that, electronic and
89
phononic structure of Mg2Si have been investigated both by experimental and
theo-90
retical approaches. By contrast, transport properties have never been determined so
91
far using calculation methods.
92
III. CALCULATION DETAILS
93
Density-Functional Theory approach22,23 has been used throughout this work at
94
the generalized gradient approximation (GGA). The Perdew-Becke-Ernzerhof (PBE)
95
exchange and correlation functional was used24,25. Norm-conserving pseudopotential
96
based on the Troullier-Martins scheme were utilised to model core electrons. The
97
cutoff for the kinetic energy was set to 40 Hartree. The integration over the Brillouin
98
zone was performed on a grid of k -points. The corresponding set of k -points were
99
calculated using the Monkhorst-Pack scheme26. The quality of the kinetic energy
100
cutoff and grid of k -points was tested on the calculated cell parameters and
elas-101
tic constants of the Mg2Si structure. The elastic tensor has been calculated using
102
the Density-Functional Linear-Response Theory (DFPT)27–30
. The formula for the
103
shear modulus are given by the Voigt-Reuss-Hill approximations31–33. The best
104
time/quality ratio was achieved with a 83 grid of k -points. The convergence criteria
105
for the energy and gradients were 10−9 Ha and 10−5 Ha bohr−1, respectively.
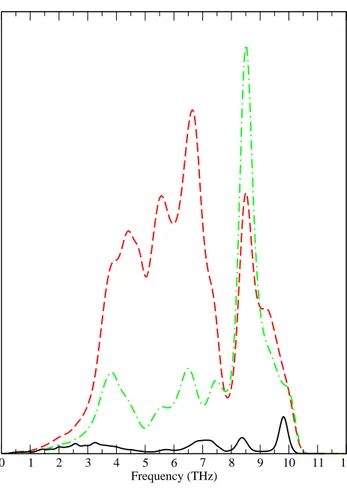
107
The EP interactions, and the thermal and electrical conductivities properties
108
of Mg2Si were calculated on a 243 grid of k -points, which amounts to a full set
109
of 13824 k -points if one omits the time-reversal symmetry in the Brillouin zone.
110
The DFPT method was used. We used the EP interaction theory as developped
111
by Savrasov34 in the realm of linear response theory. Perturbations were
calcu-112
lated on a set of 29 high-symmetry k -points selected among the full set of k -points,
113
and the full integration over the Fermi surface was performed by an interpolation
114
procedure. The calculations were performed using ABINIT package35(version 5.8.4).
115
116
IV. RESULTS
117
The calculated cell parameter is 0.6382 nm. As expected from a gradient corrected
118
functional, our theoretical prediction is slightly overestimated, though by less than
119
0.5%, compared to experiment2 (0.635 nm). Regarding the elastic constants (C 11 =
120
114.5 GPa, C12 = 21.5 GPa, C44 = 45.6 GPa) and the bulk modulus (B = 52.5 GPa),
121
excepted for the C11 which is underestimated by about 12 GPa, our results are
122
in agreement with experimental data3
(126 GPa, 26 GPa, 48.5 GPa and 49 GPa,
123
respectively). Our predictions for the Young modulus, shear modulus and Poisson
124
ratio are E = 107.1 GPa, G = 46.2 GPa and ν = 0.16, respectively.
125
As mentioned in the introduction, Mg2Si is a semiconductor with indirect gap.
126
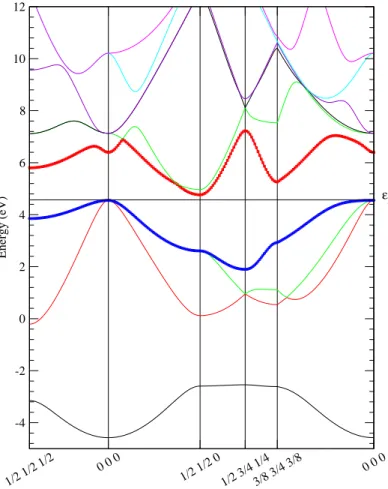
The calculated electronic band structure depicted in Figure 1 shows that the gap
127
energy at the Γv →Xc transition amounts to 0.21 eV. As expected, this value is to
128
low compared to the experimental one (see Table I), however DFT is able to capture
129
the essential features of the electronic band structure of Mg2Si (see Section V). The
130
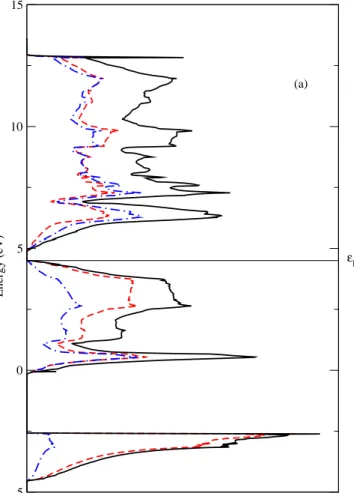
direct band gap is predicted to amount to 1.75 eV (Exp. 2.27 eV). On Figure 2 are
depicted the DOS projections on silicon and magnesium atoms (Figure 2a), on the
132
s, p, d and f channels of silicon (Figure 2b), and on the s, p, d and f channels of
133
magnesium (Figure 2c). The s bands are located below −2.5 eV. The valence band
134
near the Fermi level is largely dominated by the p orbitals, the silicon contribution
135
prevailing over that of magnesium. In the conduction band both the silicon and
136
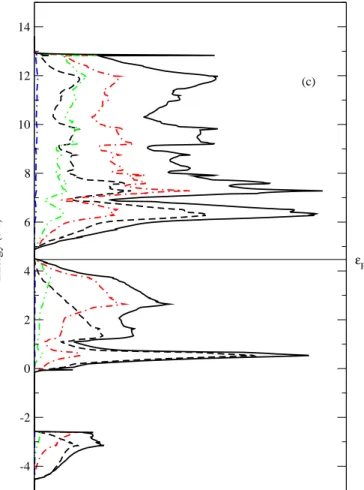
magnesium contribute to roughtly the same amount. Concerning the bottom of the
137
conduction band, between 5 and 7 eV, the s, p and d orbitals of silicon have roughtly
138
that same statistical weight, and they combine mostly with the s orbitals of
magne-139
sium, and to a lower extend with the p and d ones. At higher energies, i.e. above
140
7 eV, the p orbitals of Mg and Si dominate the DOS. We can notice that the s
or-141
bitals of magnesium still contribute significantly to the DOS compared to the d ones
142
up to about 9 eV. Above this threshold the s and d orbital contributions are reversed.
143
144
The phonon band structure of Mg2Si has been calculated using perturbation
the-145
ory and is depicted in Figure 3. Since the primitive unit cell contains only three
146
atoms, nine phonon bands have been calculated at a set of special k -points with high
147
symmetry. A Fourier interpolation scheme has been used to build the whole band
148
structure. At the Γ k -point the bands feature an optical branch which is threefold
149
degenerate at 7.61 THz. At higher frequencies, the second optical branch, which
150
should also be threefold degenerate, is split by the macroscopic electric field into
151
a low-lying, twofold transverse optical mode at 8.03 THz and a single, high-lying
152
longitudinal optical mode at 9.98 THz. Therefore, the LO-TO splitting amounts to
153
1.95 THz (65 cm−1) which is in good agreement with experimental data (60 cm−1)
154
and other theoretical predictions (see Table II). In Figure 4 is depicted the phonon
155
density of states (ph-DOS) and the corresponding DOS projected onto the
magne-156
sium and silicon atoms. The peak of the ph-DOS centered at around 8.5 THz is
157
dominated by the states pertaining to the magnesium vibrational modes whereas the
modes below 7.5 THz and above 9 THz belong mostly to the silicon atom vibrational
159
modes.
160
161
Using the Savrasov formalism we calculated by response theory the electrical
resis-162
tivity and electronic thermal conductivity. The results are presented in Table III. We
163
note that the electrical resistivity is too low compared to experimental measurements
164
by about two orders of magnitudes. By contrast, the calculated electronic thermal
165
conductivity is overestimated. The reason for these discrepancies is explained in
166
the next section. The electron-phonon interaction is one of the key quantity to
ex-167
plain transport properties. The Eliashberg spectral function α2F(ω) and the spectral
168
transport function α2
Ftr(ω) are depicted on Figure 5. The Eliashberg function does
169
not differ significantly from the transport function, the latter being only slightly less
170
intense than the former. Therefore we only describe the transport function. A broad
171
peak is observed at low frequency that span from about 1 THz to 4 THz. Then four
172
peaks are depicted: the less intense one is centrered at 5.8 THz, then a broader peak
173
is centrered at 7 THz, and two sharp peaks are found at 8.5 THz and 9.9 THz, the
174
latter one being the most intense one over the whole spectrum.
175
V. DISCUSSION
176
The electronic band structure depicted in Figure 1 shows that, at the Γ (0,0,0)
177
k -point the Fermi state is threefold degenerate whereas the first conduction state
178
is not degenerate and the second one is threefold degenerate. This feature is also
179
observed when using the Perdew-Wang (PW91) exchange-correlation GGA
func-180
tional9. By contrast, the band structure is different at the Hartree-Fock (HF) and
181
hybrid (HF+DFT using the adiabatic connection) theoretical levels9. In effect, at the
182
Hartree-Fock level the first conduction state is threefold degenerate at the Γ k -point.
When mixing Hartree-Fock with the PW91 functional, the first conduction state
184
becomes twofold degenerate only. Hence, as expected, the admixture of electronic
185
correlation into the hamiltonian tends to correct, at least partially, the Hartree-Fock
186
deficiencies, though not enough to yield a correct picture of the conduction band. In
187
addition, the band gap is still to high (about the same in magnitude as the HF one).
188
Note that our description of the electronic band structure is also consistent with that
189
of D. M. Wood and A. Zunger36 and M. Y. Au-Yang and M. L. Cohen11 whom used
190
perturbation theory and empirical pseudopotential approaches, respectively.
191
192
Although DFT provides a qualitatively satisfactory description of the electronic
193
band structure of Mg2Si, we believe that, the misfit between the calculated energy
194
gap and the experimental one leads to wrong estimates of the electrical and
elec-195
tronic thermal conductivities, as we shall see. At first sight, the discrepancies could
196
be explained by noting that, several effects are neglected in the calculations, namely,
197
the electron-electron diffusion and the thermal activation. Both effects can increase
198
the electrical resistivity of Mg2Si. However, the bad description of the electronic
199
gap may also play a important role. Indeed, if we assume that, Mg2Si behaves as
200
a semi-conductor, the resistivity should vary with the temperature according to the
201
exponential law: ρ(T ) = ρ0exp( Eg
2kT). Therefore, we have at 300 K, using data from
202
Table I: Eg,calc. = Eg,exp. + 2kT ln ρ
calc.
ρexp. = 0.46 eV. We see that the gap is
sig-203
nificantly improved, by a factor of two. As a consequence, improving the electronic
204
gap should significantly increase the resistivity of Mg2Si. The prediction of the gap
205
energy could be improved by implementing a scissors operator or by performing GW
206
calculations, though the latter option would be computationally too expensive.
207
208
In order to understand the electron-phonon (EP) interactions in the case of Mg2Si,
209
we show in Figure 6 both the phonon DOS projected onto the Mg and Si atoms
and the transport spectral function α2
Ftr(ω). One can see that the EP coupling
211
is generally stronger for frequencies corresponding to vibrational modes in which
212
the contribution of silicon prevails. The only exception is for ν =8.4 THz where
213
the contribution of Mg atoms is slightly larger than that of Si one. This could
214
explain why the replacement of silicon atoms by heavier ones (e.g. Sb, Bi, Ag,
215
Sn)17,18,20 improves the Mg
2Si thermoelectric properties. Heavy atoms lead to a
216
reduction of atomic vibrations, and as a consequence to a decrease of the trapping
217
of charge carriers which is large when EP interactions are strong37. In addition, the
218
introduction of heavy atoms into the Mg2Si lattice increases phonon scattering and
219
therefore, reduces the lattice thermal conductivity.
220
VI. CONCLUSION
221
In this work we studied the electronic, vibrational and EP coupling properties of
222
the Mg2Si compound.
223
The features of the electronic band structure agree with previous calculations
ob-224
tained with different exchange-correlation functional. However, the DFT approach
225
improves the description of the electron bands over the Hartree-Fock and hybrid
226
Hartree-Fock-DFT approaches. The gap energy calculated by pure DFT method is
227
much too small compared to experimental findings and to GW calculations. The
228
electrical resistivity is also too low compared to experimental data. We infered that
229
the discrepancy between the calculated and experimental electrical resistivity is
re-230
lated to the underestimation of the gap energy.
231
The EP coupling was found to be stronger for frequencies corresponding mainly to
sil-232
icon vibrational modes. This phenomenon could be at the origin of the improvement
of the thermoelectric properties of Mg2Si by designing solid solutions.
234
∗ Corresponding author: pascal.boulet@univ-provence.fr
235
1 V. K. Zaitsev, M. I. Fedorov, I. S. Eremin, and E. A. Gurieva, Thermoelectrics Handbook:
236
Macro to Nano-Structured Materials (New York: CRC press, 2006).
237
2 J. G. Barlock and L. F. Mondolfo, Zeitschrift F¨ur Metallkunde 66 (1975).
238
3 O. Madelung, in Landbolt-B¨ornstein Numercal Data and Functional Relationships in
239
Science and Technology, New Series, Group III, Vol. 17e (Springer-Verlag, Berlin, 1983)
240
pp. 163, 432.
241
4 U. Winckler, Helv. Phys. Acta 28, 633 (1955).
242
5 R. G. Morris, R. D. Redin, and G. C. Danielson, Phys. Rev. 109, 1909 (1958).
243
6 P. Koenig, D. Lynch, and G. Danielson, J. Phys. Chem. Sol. 20, 122 (1961).
244
7 F. Vazquez, R. A. Forman, and M. Cardona, Phys. Rev. 176, 905 (1968).
245
8 P. M. Lee, Phys. Rev. 135, A1110 (1964).
246
9 P. Baranek and J. Schamps, J. Phys. Chem. B 103, 2601 (1999).
247
10 B. Arnaud and M. Alouani, Phys. Rev. B 64, 033202 (2001).
248
11 M. Y. Au-Yang and M. L. Cohen, Phys. Rev. 178, 1358 (1969).
249
12 M. T. Hutchings, T. W. D. Farley, M. A. Hackett, W. Hayes, S. Hull, and U.
Steigen-250
berger, Sol. State Ion. 28-30, 1208 (1988).
251
13 C. J. Buchenauer and M. Cardona, Phys. Rev. B 3, 2504 (1971).
252
14 D. McWilliams and D. W. Lynch, Phys. Rev. 130, 2248 (1963).
253
15 J. ichi Tani and H. Kido, Comput. Mater. Sci. 42, 531 (2008).
254
16 J. ichi Tani and H. Kido, Phys. B 364, 218 (2005).
255
17 J. ichi Tani and H. Kido, Interm. 15, 1202 (2007).
256
18 G. S. Nolas, D. Wang, and M. Beekman, Phys. Rev. B 76, 235204 (2007).
19 M. Akasaka, T. Iida, A. Matsumoto, K. Yamanaka, Y. Takanashi, T. Imai, and
258
N. Hamada, J. Appl. Phys. 104, 013703 (2008).
259
20 V. K. Zaitsev and M. I. Fedorov, Semicond. 29, 490 (May 1995).
260
21 A. H. Awad and K. S. Dubey, J. Therm. Anal. 24, 233 (1982).
261
22 P. Hohenberg and W. Kohn, Phys. Rev. 136, B864 (1964).
262
23 W. Kohn and L. J. Sham, Phys. Rev. 140, A1133 (1965).
263
24 J. Perdew, K. Burke, and M. Ernzerhof, Phys. Rev. Lett. 77, 3865 (1996).
264
25 J. Perdew, K. Burke, and M. Ernzerhof, Phys. Rev. Lett. 78, 1396 (1997).
265
26 H. J. Monkhorst and J. D. Pack, Phys. Rev. B 13, 5188 (1976).
266
27 X. Gonze, Phys. Rev. A 52, 1096 (1995).
267
28 X. Gonze, Phys. Rev. B 55, 10337 (1997).
268
29 X. Gonze and C. Lee, Phy. Rev. B 55, 10355 (1997).
269
30 S. Baroni, S. de Gironcoli, A. D. Corso, and P. Giannozzi, Rev. Mod. Phys. 73, 515
270
(2001).
271
31 W. Voigt, Lehrbuch der Kristallphysiks (B. B. Teubner, Leipzig, 1928).
272
32 A. Reuss, Z. Angew. Math. Mech. 9, 49 (1929).
273
33 R. Hill, Proc. Phys. Soc. 65, 349 (1952).
274
34 S. Y. Savrasov, Phys. Rev. B 54, 16470 (1996).
275
35 X. Gonze, B. Amadon, P. Anglade, J. Beuken, F. Bottin, P. Boulanger, F. Bruneval,
276
D. Caliste, R. Caracas, M. Cˆot´e, T. Deutsch, L. Genovese, P. Ghosez, M. Giantomassi,
277
S. Goedecker, D. Hamann, P. Hermet, F. Jollet, G. Jomard, S. Leroux, M. Mancini,
278
S. Mazevet, M. Oliveira, G. Onida, Y. Pouillon, T. Rangel, G. Rignanese, D. Sangalli,
279
R. Shaltaf, M. Torrent, M. Verstraete, G. Zerah, and J. Zwanziger, Comput. Phys.
280
Comm. 180, 2582 (2009).
281
36 D. M. Wood and A. Zunger, Phys. Rev. B 34, 4105 (1986).
37 D. Emin, Thermoelectrics Handbook: Macro to Nano-Structured Materials (New York:
283
CRC press, 2006).
Table I. Experimental (300 K) and calculated electronic properties of Mg2Si.
Property Calc. (from literature) Calc. (this work) Exp. Direct gap Γv →Γc (eV) 1.55a 10,1.65b9, 2.20c 10 1.75 2.277
Indirect gap Γv →Xc (eV) 1.3d8 0.12a10, 0.65c10 0.21 0.66–0.784–6
Effective mass mk/m0 0.698 0.58 – Effective mass m⊥/m0 0.258 0.19 – aLDA functional. b GGA functional. c GW calculations. dEmpirical pseudopotential.
Table II. Experimental and calculated phonon frequencies of Mg2Si.
Property Calc. (from literature) Calc. (this work) Exp. Phonon modes ∆′2, ∆5 (TO) (THz) 7.949, 7.7015 7.61 7.7312,13
Phonon mode ∆5 (TO) (THz) 8.069, 8.1815 8.03 7.9712, 8.0014
Table III. Electrical resistivity and thermal conductivities of Mg2Si at 300 K.
Property Calc. (this work) Exp.
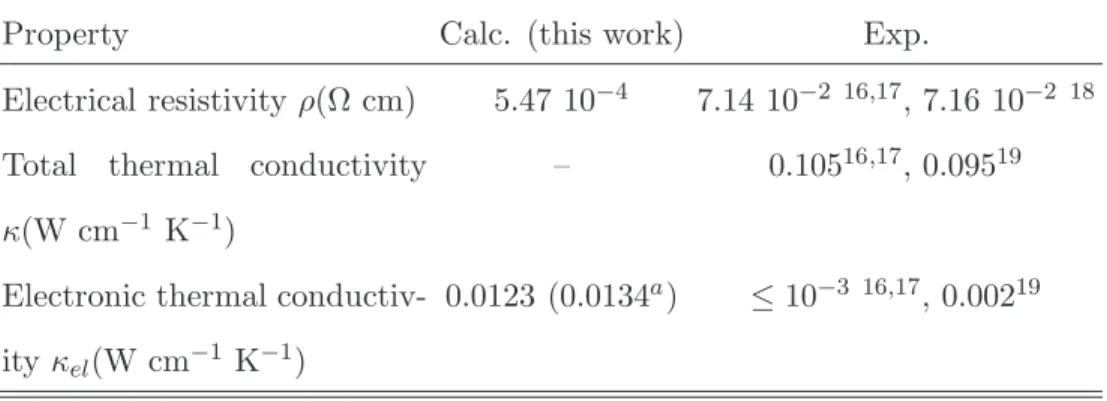
Electrical resistivity ρ(Ω cm) 5.47 10−4 7.14 10−2 16,17, 7.16 10−2 18 Total thermal conductivity
κ(W cm−1 K−1)
– 0.10516,17, 0.09519
Electronic thermal conductiv-ity κel(W cm−1 K−1)
0.0123 (0.0134a) ≤10−3 16,17, 0.00219
a Using Wiedemann-Franz law: κ
FIGURE CAPTIONS
285
Figure 1: Electronic band structure of Mg2Si calculated with the PBE density
286
functional.
287
288
Figure 2a: Total electron density of states (DOS) and and DOS projected on
289
magnesium and silicon atoms. Legend: − total DOS; −− Si contribution; −· Mg
290
contribution.
291
292
Figure 2b: Electron density of states projected on the s, p, d and f channels of
293
silicon. Legend: − Si total contribution; −− s; −· p; − · · d; · − − f.
294
295
Figure 2c: Electron density of states projected on the s, p, d and f channels of
296
magnesium. Legend: − Mg total contribution; −− s; −· p; − · · d; · − − f.
297
298
Figure 3: Phonon band structure of Mg2Si.
299
300
Figure 4: Phonon density of state and contribution of silicon and magnesium
301
atoms.
302
303
Figure 5: Eliashberg function α2F(ω) and transport spectral function α2
Ftr(ω).
304
305
Figure 6: Contribution of silicon and magnesium atoms to the phonon density
306
of state and transport spectral function α2
Ftr(ω). Legend: − transport spectral
307
function α2
Ftr(ω); −− Si contribution to the phonon DOS; −· Mg contribution to
308
the phonon DOS.
Figure 1 310 1/2 1/2 1/2 0 0 0 1/2 1/2 0 1/2 3/4 1/43/8 3/4 3/8 0 0 0 -4 -2 0 2 4 6 8 10 12 Energy (eV) εF 311 312
Figure 2a 313 -5 0 5 10 15 Energy (eV) (a) εF 314 315
Figure 2b 316 -5 0 5 10 15 Energy (eV) (b) εF 317 318
Figure 2c 319 -4 -2 0 2 4 6 8 10 12 14 Energy (eV) (c) εF 320 321
Figure 3
322
323
F ig u re 4 3 2 5 0 5 10 frequency (THz) 0 1 2 3 4 Density of states total Mg Si 3 2 6 3 2 7 22
F ig u re 5 3 2 8 0 2 4 6 8 10 12 Frequency (THz) 0 0,05 0,1 0,15 0,2 0,25 α2F(ω) α2Ftr(ω) 3 2 9 3 3 0 23
Figure 6 331 0 1 2 3 4 5 6 7 8 9 10 11 12 Frequency (THz) 332 333