arXiv:1211.7255v2 [hep-ex] 22 Mar 2013
EUROPEAN ORGANISATION FOR NUCLEAR RESEARCH (CERN)
CERN-PH-EP-2012-295
Submitted to: PRD
Measurement of Upsilon production in
7 TeV
pp
collisions at ATLAS
The ATLAS Collaboration
Abstract
Using 1.8 fb
−1of
pp
collisions at a center-of-mass energy of 7
TeV
recorded by the ATLAS
de-tector at the Large Hadron Collider, we present measurements of the production cross sections of
Υ (1S, 2S, 3S)
mesons.
Υ
mesons are reconstructed using the di-muon decay mode. Total
produc-tion cross secproduc-tions for
p
T<
70 GeV and in the rapidity interval
|y
Υ| <
2.25 are measured to be
8.01
±
0.02
±
0.36
±
0.31 nb, 2.05
±
0.01
±
0.12
±
0.08 nb, 0.92
±
0.01
±
0.07
±
0.04 nb, respectively, with
uncertainties separated into statistical, systematic, and luminosity measurement effects. In addition,
differential cross section times di-muon branching fractions for
Υ (1S)
,
Υ (2S)
, and
Υ (3S)
as a function
of
Υ
transverse momentum
p
Tand rapidity are presented. These cross sections are obtained
as-suming unpolarized production. If the production polarization is fully transverse or longitudinal with
no azimuthal dependence in the helicity frame the cross section may vary by approximately
±
20
%
.
If a non-trivial azimuthal dependence is considered, integrated cross sections may be significantly
enhanced by a factor of two or more. We compare our results to several theoretical models of
Υ
meson production, finding that none provide an accurate description of our data over the full range of
Measurement of Upsilon production in 7 TeV pp collisions at ATLAS
ATLAS Collaboration
Using 1.8 fb−1 of pp collisions at a center-of-mass energy of 7 TeV recorded by the ATLAS
detector at the Large Hadron Collider, we present measurements of the production cross sections of Υ (1S, 2S, 3S) mesons. Υ mesons are reconstructed using the di-muon decay mode. Total production
cross sections for pT< 70 GeV and in the rapidity interval |yΥ| < 2.25 are measured to be 8.01 ±
0.02 ± 0.36 ± 0.31 nb, 2.05 ± 0.01 ± 0.12 ± 0.08 nb, and 0.92 ± 0.01 ± 0.07 ± 0.04 nb, respectively, with uncertainties separated into statistical, systematic, and luminosity measurement effects. In addition, differential cross section times di-muon branching fractions for Υ (1S), Υ (2S), and Υ (3S)
as a function of Υ transverse momentum pTand rapidity are presented. These cross sections are
obtained assuming unpolarized production. If the production polarization is fully transverse or longitudinal with no azimuthal dependence in the helicity frame the cross section may vary by approximately ±20%. If a non-trivial azimuthal dependence is considered, integrated cross sections may be significantly enhanced by a factor of two or more. We compare our results to several theoretical models of Υ meson production, finding that none provide an accurate description of our data over the full range of Υ transverse momenta accessible with this dataset.
PACS numbers: 12.38.-t,13.20.Gd,14.40.Pq
I. INTRODUCTION
Since the discovery of the J/ψ and Υ mesons [1, 2] the study of heavy quark-antiquark systems has provided valuable input for our understanding of Quantum Chro-modynamics (QCD). However, despite being one of the simplest systems in QCD it has proven difficult histori-cally to describe the production properties of these states adequately. Results on J/ψ and Υ hadroproduction and polarization [3–12] exhibit inconsistencies between mea-surements and theoretical predictions [13].
Measurements at the Large Hadron Collider (LHC) of differential production spectra of various charmonium and bottomonium states together with measurement of their spin-alignments, prompt double-quarkonia produc-tion, and production of quarkonia in association with photons, vector bosons or open heavy-flavor final states will allow discrimination between different theoretical ap-proaches based on singlet corrections [14–16], color-octet terms [17], the kT-factorization approach [18] and
other production models [19], and provide additional in-put toward an improved understanding of quarkonium hadroproduction.
Studies of bottomonium production complement con-current studies of charmonium systems due to the larger mass of the bottom quark compared to the charm quark, allowing more dependable theoretical calculations than in the charmonium family, which suffer from poor pertur-bative convergence [17]. Extension of cross-section mea-surements to higher meson transverse momenta provides valuable input to improvements in the theoretical de-scription since in this regime different processes can dom-inate and, experimentally, the impact of spin-alignment uncertainties are mitigated.
Taking advantage of the large increase in integrated luminosity delivered by the LHC in 2011, this paper up-dates a previous measurement [8] and reports the Υ (1S) cross section presented differentially in two intervals of
absolute Υ rapidity [20], |yΥ|, and fifty intervals of Υ
transverse momentum, pΥ
T, and as a pT-integrated result
in forty-five bins of absolute Υ rapidity. In addition, new measurements of the equivalent Υ (2S) and Υ (3S) differ-ential spectra and their production ratios relative to the Υ (1S) are reported.
Υ production can proceed directly, where the Υ me-son of interest is produced in the hard interaction, or via the production of an excited state which subsequently decays. This so-called “feed-down” contribution compli-cates the theoretical description of quarkonium produc-tion as calculaproduc-tion of colsinglet P -wave and higher or-bital angular momentum quarkonium production suffers from the presence of infrared divergences [21]. From the experimental perspective, separation of direct and feed-down contributions is hindered by the small mass split-ting between the bottomonium states, which impedes the detection of additional decay products that would indi-cate indirect production. Contributions from feed-down vary between the Υ (1S), Υ (2S) and Υ (3S) states due to the changing presence of various kinematically-allowed decays and influence the inclusive production rate. Study of the Υ production ratios as a function of kinematic variables as presented here thus provides an indirect but precise measure of these feed-down contributions.
This new analysis extends the pTrange of our previous
cross-section result [8] to 70 GeV, at which new contribu-tions to Υ production [15, 16] such as from associated Υ + bb production may play a more important role and the impact of the dependence of the production cross section on the spin-alignment of the Υ is relatively small. Both the fiducial cross section, measured in the kinematic region with muon transverse momentum pµT> 4 GeV and muon pseudorapidity |ηµ| < 2.3, and the corrected cross
section, which is defined in this paper as the cross sec-tion in the pT–η phase space of the Υ corrected for the
acceptance of the decay products to the full Υ produc-tion phase space, are reported. In the former case, the
results have no dependence on assumptions about Υ spin alignment, while the latter measurements are more eas-ily compared to model predictions and to the results of other experiments.
II. THE ATLAS DETECTOR
The ATLAS detector [22] is composed of an inner tracking system, calorimeters, and a muon spectrome-ter. The inner detector directly surrounds the inter-action point and consists of a silicon pixel detector, a silicon microstrip detector, and a transition radiation tracker, all immersed in a 2 T axial magnetic field. It covers the pseudorapidity [20] range |η| < 2.5 and is en-closed by a calorimeter system containing electromag-netic and hadronic sections. Surrounding the calorime-ters is the large muon spectrometer built with three air-core toroids. This spectrometer is equipped with precision detectors (monitored drift tubes and cathode strip chambers) that provide precise measurements in the bending plane within the pseudorapidity range |η| < 2.7. In addition, resistive plate and thin gap chambers with fast response times are used primarily to construct muon triggers in the ranges |η| < 1.05 and 1.05 < |η| < 2.4 re-spectively, but are also used to provide position measure-ments in the non-bending plane and to improve pattern recognition and track reconstruction. Momentum mea-surements in the muon spectrometer are based on track segments formed in at least two of the three precision chamber planes.
The ATLAS detector employs a three-level trigger sys-tem [23], which reduces the 20 MHz proton bunch colli-sion rate to the several hundred Hz transfer rate to mass storage. The Level-1 muon trigger searches for hit coin-cidences between different muon trigger detector layers inside pre-programmed geometrical windows that bound the path of triggered muons of given transverse momen-tum and provide a rough estimate of its position within the pseudorapidity range |η| < 2.4. At Level-1, muon candidates are reported in “regions of interest” (RoIs). Only a single muon can be associated with a given RoI of spatial extent ∆φ × ∆η ≈ 0.1 × 0.1. This limitation has a small effect on the trigger efficiency for Υ mesons, corrected for in the analysis using a data-driven method based on analysis of J/ψ → µ+µ− and Υ → µ+µ−
de-cays. The Level-1 trigger is followed in sequence by two subsequent higher-level, software-based trigger selection stages. Muon candidates reconstructed at these higher levels incorporate, with increasing precision, information from both the muon spectrometer and the inner detec-tor and reach position and momentum resolution close to that provided by the offline muon reconstruction.
III. DATASET AND EVENT SELECTION
Data for this study were collected during the 2011 LHC proton-proton running period between March and Au-gust using a trigger that requires the presence of two muon candidates with opposite charges that are subject to a fit constraining them to a common vertex while tak-ing into account track parameter uncertainties. A very loose selection on vertex χ2 which is fully efficient for signal candidates, was imposed to ensure proper fit con-vergence, as well as the requirement of opposite charge and that pµT > 4 GeV and |ηµ| < 2.3. This trigger was
largely unprescaled and collected data at a rate of ap-proximately 20 Hz in this period of data-taking.
Events are required to contain at least one primary vertex candidate that has at least five tracks with pT>
0.4 GeV, and at least two muons identified by associating candidates found in the muon spectrometer with tracks reconstructed in the inner detector [8, 22]. Multiple scat-tering in the calorimeters and toroids of the ATLAS de-tector degrades the muon spectrometer resolution for low energy particles. As the majority of muons selected for this analysis have low momentum, we assign values for parameters such as pTand η to the muons based on track
fits using inner detector information only. To ensure ac-curate inner detector measurements, each muon track must contain at least six silicon microstrip detector hits and at least one pixel detector hit. Muon candidates passing these criteria are required to have pµT > 4 GeV
and |ηµ| < 2.3 and a successful fit to a common vertex.
Good spatial matching (∆R ≡ p(∆φ)2+ (∆η)2 <
0.01) between the muon candidate in both the offline construction and the trigger used to select the event is re-quired to facilitate data-driven estimates of the di-muon trigger efficiency. Furthermore, both muons forming an Υ candidate must be associated to their trigger-level can-didates in this manner. In this way, the efficiency of the trigger requirements on the di-muon candidate are incor-porated into the trigger efficiency correction. All di-muon candidates passing these criteria are retained for analysis.
The distribution of the invariant mass of the µ+µ−
system is shown in Fig. 1 for the selected di-muon candi-dates. As is apparent from the plot, the mass resolution (120 MeV) for di-muon candidates detected in the central region of the detector (|yµµ| < 1.2) is significantly
bet-ter than the resolution (214 MeV) for those candidates falling into the forward region (1.2 ≤ |yµµ| < 2.25).
A total of 3.9 × 10⁶ and 2.3 × 10⁶ candidates with
8 < mµµ < 11.5 GeV are reconstructed in the central
[GeV]
µ µm
8
9
10
11
Entries / 50 MeV
0
50
100
150
200
250
310
×
| < 1.2 µ µ |y Data = 120 MeV σ (1S) : ϒ = 127 MeV σ (2S) : ϒ = 131 MeV σ (3S) : ϒATLAS
= 7 TeV s -1 L dt = 1.8 fb∫
[GeV]
µ µm
8
9
10
11
Entries / 50 MeV
0
50
100
150
310
×
| < 2.25 µ µ |y ≤ 1.2 Data = 214 MeV σ (1S) : ϒ = 227 MeV σ (2S) : ϒ = 235 MeV σ (3S) : ϒATLAS
= 7 TeV s -1 L dt = 1.8 fb∫
FIG. 1: The di-muon invariant mass spectum for events used in this analysis. Separate spectra are shown for those events with
the di-muon candidate (left) in the central region of the detector (|yµµ| < 1.2) and (right) in the forward region (1.2 ≤ |yµµ| <
2.25). Overlaid are individual shapes of the fitted Υ (nS) signals (shaded regions), background-only fit (dashed curve) and the total signal plus background shape (solid curve). The background shape is modelled here by a fourth-order polynomial and the signal peaks each modelled by a single Gaussian. Also quoted are the fitted mass resolutions of each of the three signal peaks, determined from the fit with a common resolution parameter scaling with invariant mass.
IV. CROSS SECTION DETERMINATION
Differential Υ cross sections are measured according to the relation: d2σ dpTdy× Br(Υ → µ +µ−) = NΥ R Ldt × ∆pT× ∆|y| (1) where Br(Υ → µ+µ−) represents the appropriate
branch-ing fraction of the Υ (nS) to di-muons, R Ldt is the in-tegrated luminosity, ∆pT and ∆|y| are the bin sizes in
Υ transverse momentum and rapidity, respectively, and NΥ is the corrected number of observed Υ (1S), Υ (2S), or
Υ (3S) mesons in a bin. Corrections are applied to ac-count for selection efficiencies, bin migration effects due to finite detector resolution, and, in the case of corrected cross-section measurements, acceptance.
Determination of the cross sections proceeds through several steps. Firstly, a weight is determined for each selected di-muon candidate equal to the inverse of the total efficiency for the candidate. Secondly, a fit is per-formed to the distribution of weighted events binned in di-muon invariant mass, mµµ, to determine the number
of Υ (nS) mesons (with n = 1,2,3) produced in each (pµµT , yµµ) bin. Thirdly, these values are corrected for (pµµ
T ,
yµµ) bin migrations. Finally, the differential cross
sec-tion multiplied by the Υ → µ+µ− branching fraction is
calculated for each state using the integrated luminosity and the pTand y bin widths as in Eq. (1).
The weight, w, for each Υ candidate includes the fraction of produced Υ → µ+µ− decays with both
muons falling into the kinematic region pµT> 4 GeV and |ηµ| < 2.3 (the acceptance, A, is used only in
calcu-lating corrected cross sections), the probability that a candidate falling within the acceptance passes the off-line reconstruction requirements (the reconstruction ef-ficiency, εreco), and the probability that a reconstructed
event passes the trigger selection (the trigger efficiency, εtrig). The weights assigned to a given candidate when
calculating the fiducial (wfid) and corrected (wtot) cross
sections are then given by:
wfid= (εreco· εtrig)−1,
wtot= (A · εreco· εtrig)−1.
(2)
A. Acceptance
The kinematic acceptance A(pT, y) is the probability
that the muons from an Υ with transverse momentum pT
and rapidity y fall into the fiducial volume of the detec-tor defined by the pµT > 4 GeV and |ηµ| < 2.3 selection
applied to each muon in the di-muon pair. In order to calculate the acceptance as a function of the rapidity and transverse momentum of each of the Υ states, taking into account possible angular dependences in their decays, we use an analytic formula describing the decay of Υ states
in their decay frame [24], d2N d cos θ∗dφ∗ ∝ 1 + λθcos 2θ∗+ λ φsin2θ∗cos 2φ∗ + λθφsin 2θ∗cos φ∗. (3)
The helicity frame is used, where θ∗ is the polar
an-gle between the µ+ momentum in the Υ decay frame
and the direction of the Υ momentum in the laboratory frame. The corresponding azimuthal angle φ∗ is the
an-gle between the quarkonium production plane (defined in the quarkonium decay frame by the two momenta of the incoming protons in that frame) and the quarkonium decay plane in the lab frame.
The λi coefficients parameterize the spin-alignment
state of the Υ . In some parts of the phase space the ac-ceptance may depend on these parameters quite strongly. We have identified five extreme cases that lead to the largest possible variations of acceptance within the phase space of this measurement and define an envelope in which the results may vary under any physically-allowed spin-alignment assumption: isotropic distribution inde-pendent of θ∗ and φ∗ (λ
θ = λφ = λθφ = 0, labeled
FLAT); longitudinal alignment (λθ = −1, λφ = λθφ = 0,
labeled LONG); and three types of transverse alignment (λθ = +1, λφ = λθφ = 0, labeled T +0; λθ = +1, λφ =
+1, λθφ = 0, labeled T ++; λθ = +1, λφ = −1, λθφ = 0,
labeled T +−). The central values of our measurements are derived under the isotropic production assumption. The spread in corrected cross-section results derived un-der all five assumptions is used to quantify the full en-velope of possible variations of the result due to spin-alignment. Some constraints on physically-allowed λi
combinations exist [24, 25]. In particular, λθφ must be
zero for λθ = ±1 and any λφ, and |λθφ| ≤ 0.5 for
λθ = λφ = 0. Acceptance corrections with non-zero
λθφ were found to lead to corrections with smaller or
equal variations from the isotropic scenario than any parameter-space scenarios on the λθ–λφ plane.
Accep-tance weights for each polarization scenario, including those with non-zero λθφ can be found in hepdata [26].
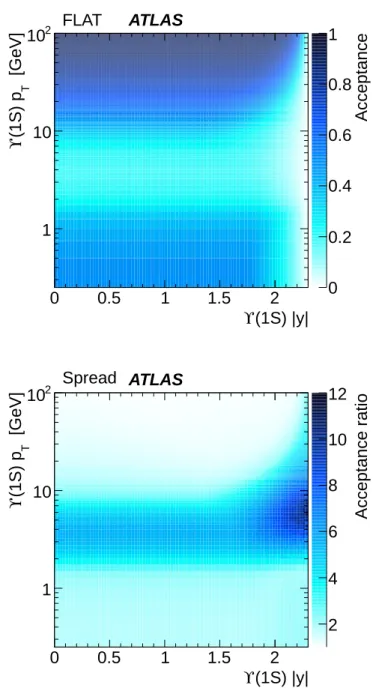
Figure 2 presents the two-dimensional acceptance map for Υ (1S), as a function of the Υ transverse momentum and absolute rapidity in the unpolarized (FLAT) accep-tance scenario as well as the maximum relative variation (ratio of largest to smallest acceptance correction) of the acceptance maps across all spin-alignment scenarios.
Acceptance is significantly decreased at very high ra-pidities due to the muon pseudorapidity requirement of |ηµ| < 2.3. When Υ are produced at rest, both muons
are likely to be reconstructed in the muon spectrome-ter on opposite sides of the detector. When the Υ has a sufficient boost, the two muons are more likely to be found in the same side of the detector and the probability that at least one muon is below the required pµT
thresh-old increases, leading to a drop in acceptance. At higher pTthe Υ imparts greater momentum to the two muons,
the likelihood of a muon being below threshold decreases
(1S) |y|
ϒ
0
0.5
1
1.5
2
[GeV]
T(1S) p
ϒ
1
10
210
Acceptance
0
0.2
0.4
0.6
0.8
1
FLAT
ATLAS
(1S) |y|
ϒ
0
0.5
1
1.5
2
[GeV]
T(1S) p
ϒ
1
10
210
Acceptance ratio
2
4
6
8
10
12
Spread ATLAS
FIG. 2: (Top) Acceptance as a function of Υ pTand rapidity
for the Υ (1S) in the unpolarized acceptance scenario; (bot-tom) the ratio of largest to smallest acceptance correction between extreme spin-alignment scenarios.
and the acceptance asymptotically approaches 100%. As Υ transverse momentum increases the variation of the acceptance corrections between spin-alignment scenarios decreases, becoming . 10% at the largest pTranges
stud-ied. Similar behaviours are observed in the acceptance maps for the Υ (2S) and Υ (3S).
This spin-alignment systematic uncertainty only ap-plies to the corrected cross-section measurements. For fiducial cross sections, measured in the kinematic region
pµT > 4 GeV and |ηµ| < 2.3, we do not have to correct
our results to the full phase space of produced Υ mesons. Spin-alignment can thus affect only our estimates of the reconstruction and trigger efficiencies. Since we measure these in many bins of muon pT and η, effects from
dif-fering distributions of events over individual bins due to different spin-alignment assumptions are negligible com-pared to other sources of systematic uncertainty.
B. Reconstruction and trigger efficiencies
The efficiency of the offline reconstruction criteria for events with muons within the fiducial region is given by:
εreco=εtrk(pT1, η1) × εtrk(pT2, η2)
× εµ(pµT1, q1· ηµ1) × εµ(pµT2, q2· ηµ2).
(4) In this equation, q represents the charge of the muon and the identities of the two muons are labeled with indices 1, 2. The efficiency of the track selection criteria, εtrk,
for tracks originating from real muons is determined in Ref. [7] using data collected in 2010. Due to the presence of additional pp interactions in the same and neighbour-ing bunch crossneighbour-ings in 2011 data the systematic uncer-tainty on the tracking efficiency has increased, with εtrk
assessed to be 99 ± 1.0% over the whole kinematic range. The efficiency to reconstruct a muon, εµ, is derived
using a tag-and-probe method on J/ψ → µ+µ− data.
The tag muon corresponds to a muon candidate with pµT> 4 GeV and |ηµ| < 2.4, and must have fired a
single-muon trigger in the event, as required by the trigger matching algorithms. The probe track is only required to pass the inner detector track quality, pT, and η cuts
and be consistent with having the same vertex as the identified tag muon. This technique provides a sample of muon candidates unbiased with respect to both trigger and offline reconstruction, and with favorable signal to background ratio.
The muon reconstruction efficiency is then derived in two-dimensional pT–η bins (fourteen muon pT intervals
and twenty-six charge-signed muon pseudorapidity [q · η] intervals). The ratio of the fitted J/ψ → µ+µ− signal
yield for those probe tracks identified as muons to the fitted signal yield for all probe tracks in these double-differential intervals is identified as the single-muon re-construction efficiency.
Due to the toroidal magnetic field, muons with positive (negative) charge are bent towards larger (smaller) pseu-dorapidity. This introduces a charge dependence in the muon reconstruction efficiency. We calculate efficiencies as a function of charge-signed pseudorapidity as nega-tive muons at posinega-tive rapidities are affected in the same manner as positive muons in negative rapidities. The charge dependence is particularly noticeable at very large |η| where the muon can be bent outside of the geometri-cal acceptance of the detector. In particular at low pT,
where the muons of particular charge may be bent away
from (rather than toward for the opposing charge) the middle/outer spectrometer planes, they will not be iden-tified as muons.
The efficiency of the di-muon trigger to select events that have passed the offline selection criteria, εtrig, is also
calculated from data. This can be factorized into three terms:
εtrig=εRoI(pµT1, q1· η1µ) × εRoI(pµT2, q2· ηµ2)
× cµµ(∆R, |yµµ|)
(5) where εRoI is the efficiency of the trigger system to find
an RoI for a single muon with transverse momentum, pµT, and charge-signed pseudorapidity, q · |ηµ|, and c
µµ is
a correction for effects related to the di-muon elements of the trigger. This correction accounts for the di-muon vertex and opposite charge requirements, and for loss of efficiency in the di-muon trigger if the two muons are close enough together to register only as a single RoI.
The di-muon correction, cµµ, itself consists of two
com-ponents
cµµ(∆R, yµµ) = ca(yµµ) × c∆R(∆R, yµµ) (6)
each evaluated in three separate regions of di-muon ra-pidity: barrel (|yµµ| ≤ 1.0), barrel-endcap transition
(1.0 < |yµµ| ≤ 1.2), and endcap (1.2 ≤ |yµµ| < 2.25),
to account for the different behaviors of these corrections in these regions. The correction ca is due to the effect
of vertex and opposite charge requirements on the trig-ger and is determined from the efficiency at large di-muon angular separations. No difference was observed from de-riving the result as a function of ∆η and ∆φ separately rather than versus ∆R. The asymptotic values are found using the ratio of candidate J/ψ → µ+µ−decays selected
by the standard di-muon trigger to those selected by a similar di-muon trigger that makes no charge or vertex requirements. These values are found to be 99.1 ± 0.4%, 97.5 ± 0.9%, 95.2 ± 0.4% in the barrel, transition, and endcap regions, respectively.
We extract this dependence on ∆R in the same three regions of di-muon rapidity as used for ca from a
sam-ple of offline reconstructed J/ψ → µ+µ− and Υ → µ+µ−
candidates with pµT2>8 GeV selected using a single-muon trigger with a threshold of 18 GeV. The 8 GeV require-ment on the lower pT muon is made to ensure that the
efficiency for the trigger system to identify RoIs compat-ible with muons of pT> 4 GeV reached its plateau value.
The ∆R dependence of c∆R is then extracted from the
fraction of fitted di-muon candidates in a ∆R interval within this control sample selected using auxiliary trig-gers that additionally pass the di-muon trigger used in this analysis.
The final component of the di-muon trigger efficiency, εRoI, represents the single-muon trigger efficiency with a
threshold of pµT > 4 GeV. This is measured using well-reconstructed J/ψ → µµ candidates in data that pass a single-muon trigger (with a threshold of 18 GeV). The ratio of the yield of J/ψ candidates (determined by fit-ting the invariant mass distributions) that pass both this
single-muon trigger and the 4 GeV pµTthreshold di-muon trigger used in this analysis, to the yield of J/ψ can-didates that pass the single-muon trigger is identified as the single-muon trigger efficiency εRoI in the pµT and
q·|ηµ| interval considered. In each case, the reconstructed
muon(s) are matched to the muon(s) that triggered the event for each of the single or di-muon triggers. The num-ber of candidates passing the di-muon trigger is then fur-ther corrected by cµµfor di-muon correlation effects [27].
The individual and overall efficiencies and weight cor-rections, calculated using the methods described above, are shown as functions of pµµT and |yµµ| in Fig. 3 for the
Υ (1S).
C. Extracting the number ofΥ mesons
The number of produced Υ (nS) mesons used in our cross-section determination is found by fitting signal and background functions to the mµµ spectrum of weighted
Υ candidates. The use of per-candidate weights rather than average weights allows us to correct for acceptance and efficiency without introduction of biases associated with the use of average values for these quantities. We determine the Υ differential cross sections separately for each spin-alignment scenario. We perform least squares fits to mµµ histograms filled using the weights, w, for
each candidate in bins of di-muon transverse momentum, pµµT , and rapidity, yµµ. The form of the χ2 for each (pµµ
T , |yµµ|) bin is: χ2= X i=mbin µµ ndata i − n pred i σi !2 ndatai = X j=Ni wj; σ2i = X j=Ni w2j (7)
where Ni represents the number of Υ (nS) candidates in
bin i.
Predictions for each bin are constructed using four sources of di-muon candidates:
npred(mµµ) =N1SF1S(mµµ; f1S)
+ N2SF2S(mµµ; f2S)
+ N3SF3S(mµµ; f3S)
+ Fbgd(mµµ; fbgd)
(8)
where the fX here represent fit function parameters and
the FX are normalized probability density functions. In
order to avoid bias due to the choice of fit model, sev-eral parameterizations of signal and background, which describe the data well, are used.
Each of the three Υ resonances are parameterized by single Gaussian, double Gaussian, or Crystal Ball func-tions, chosen to provide a reasonable description of the experimental mass resolution and energy loss effects that dominate the observed signal line-shapes. The back-ground parameterizations vary with di-muon pT. At low
0 10 20 30 40 50 60 70 W e ig h t 1 10 | < 1.2 µ µ |y Corrected Acceptance (Flat polarization) Fiducial Muon Reco. Trigger ATLAS [GeV] T (1S) p ϒ 0 20 40 60 E ff ic ie n c y 0 0.5 1 -1 L dt = 1.8 fb
∫
= 7 TeV s 0 10 20 30 40 50 60 70 W e ig h t 1 10 | < 2.25 µ µ |y ≤ 1.2 Corrected Acceptance (Flat polarization) Fiducial Muon Reco. Trigger ATLAS [GeV] T (1S) p ϒ 0 20 40 60 E ff ic ie n c y 0 0.5 1 -1 L dt = 1.8 fb∫
= 7 TeV s 0 0.2 0.4 0.6 0.8 1 1.2 1.4 1.6 1.8 2 2.2 W e ig h t 1 10 2 10 Corrected Acceptance (Flat polarization) Fiducial Muon Reco. Trigger ATLAS (1S) |y| ϒ 0 0.5 1 1.5 2 E ff ic ie n c y 0 0.5 1 -1 L dt = 1.8 fb∫
= 7 TeV sFIG. 3: Efficiency and acceptance corrections contributing to the overall fiducial and corrected efficiencies (and the inverse
of the efficiency, the weight) as a function of the Υ (1S) pµµ
T in the central (top) and forward (middle) regions of the detector
[GeV] µ µ m 9 10 11 12 Entries / 50 MeV 0 10 20 30 40 3 10 × ATLAS -1 L dt = 1.8 fb
∫
= 7 TeV s Data Fitting results Background (1S) Υ (2S) Υ (3S) Υ | < 1.20 µ µ |y < 1.0 GeV µ µ T p ≤ 0.5 [GeV] µ µ m 9 10 11 12 Entries / 50 MeV 0 5 10 15 20 3 10 × ATLAS -1 L dt = 1.8 fb∫
= 7 TeV s Data Fitting results Background (1S) Υ (2S) Υ (3S) Υ | < 2.25 µ µ |y ≤ 1.2 < 1.0 GeV µ µ T p ≤ 0.5 [GeV] µ µ m 8 9 10 11 12 Entries / 50 MeV 0 1 2 3 3 10 × ATLAS -1 L dt = 1.8 fb∫
= 7 TeV s Data Fitting results Background (1S) Υ (2S) Υ (3S) Υ | < 1.20 µ µ |y < 21.0 GeV µ µ T p ≤ 20.0 [GeV] µ µ m 8 9 10 11 12 Entries / 50 MeV 0 0.5 1 3 10 × ATLAS -1 L dt = 1.8 fb∫
= 7 TeV s Data Fitting results Background (1S) Υ (2S) Υ (3S) Υ | < 2.25 µ µ |y ≤ 1.2 < 21.0 GeV µ µ T p ≤ 20.0 [GeV] µ µ m 8 9 10 11 12 Entries / 100 MeV 0 200 400 600 ATLAS -1 L dt = 1.8 fb∫
= 7 TeV s Data Fitting results Background (1S) Υ (2S) Υ (3S) Υ | < 1.20 µ µ |y < 45.0 GeV µ µ T p ≤ 40.0 [GeV] µ µ m 8 9 10 11 12 Entries / 100 MeV 0 100 200 300 400 ATLAS -1 L dt = 1.8 fb∫
= 7 TeV s Data Fitting results Background (1S) Υ (2S) Υ (3S) Υ | < 2.25 µ µ |y ≤ 1.2 < 45.0 GeV µ µ T p ≤ 40.0FIG. 4: Fits to the efficiency-corrected mµµspectra for candidates in the low (0.5–1.0 GeV; top), mid (20–21 GeV; middle), and
high (40–45 GeV; bottom) pµµ
T intervals, for central (left) and forward (right) di-muon rapidities. Fit results are shown for the
simplest fit model considered: a single Gaussian signal plus either a second-order polynomial multiplied by an error function
pµµT , and for all rapidity bins, an error function multiplied by either a second-order polynomial, or a second-order polynomial plus an exponential, is used to model mµµ
turn-on effects accurately. At mid pµµT a second-order polynomial, or second-order polynomial plus an expo-nential is adequate to describe the shape of the back-ground under the Υ peaks. At high pµµT a first-order polynomial or a first-order polynomial plus an exponen-tial is sufficient to describe the background contribution. Average fitted values for the numbers of Υ (nS) mesons (N1S, N2S, N3S) taken over all combinations of signal and
background models are used in the extraction of cross sections, while the maximum deviation of any fit result from the average is used as an estimate of the fit model systematic uncertainty.
In the fits N1S, N2S, N3S, the peak mass of the Υ (1S)
meson (M1S), parameters describing the shape of the
Υ → µ+µ− mass distribution, and the background
pa-rameters are allowed to vary freely while M2S, M3S are
fixed relative to M1Susing measured mass splittings [28];
and the line-shape width parameters σ2S, σ3S are
re-lated linearly in mµµ to σ1S. The distribution of the
χ2-probabilities from the fits are uniformly distributed
indicating that our signal and background parameteri-zations provide good descriptions of the data. Figure 4 shows the invariant mass distribution of the fitted signal region for representative low, mid, and high Υ pT
inter-vals, in both the central and forward rapidity regions. In order to account for bin migrations due to finite de-tector resolution, corrections in pµµT are derived by first fitting a smooth analytic function to the background-subtracted pµµT spectra of Υ events in data. This fitted distribution is deconvolved with a Gaussian distribution using a Gauss-Hermite quadrature integration technique, with a pT resolution derived from the fitted invariant
mass and muon angular resolutions in data. From the distributions with and without convolution, migration corrections bin-by-bin are derived. These corrections are found to be within 0.5% of unity for central rapidities and within 1% of unity for forward rapidities. The num-ber of efficiency-corrected Υ → µ+µ− decays extracted
from the fits in each (pµµT , yµµ) bin are corrected for the
difference between true and reconstructed values of the di-muon pTand rapidity. Using a similar technique,
bin-migration corrections as functions of yµµ are found to be
negligible.
V. SYSTEMATIC UNCERTAINTIES
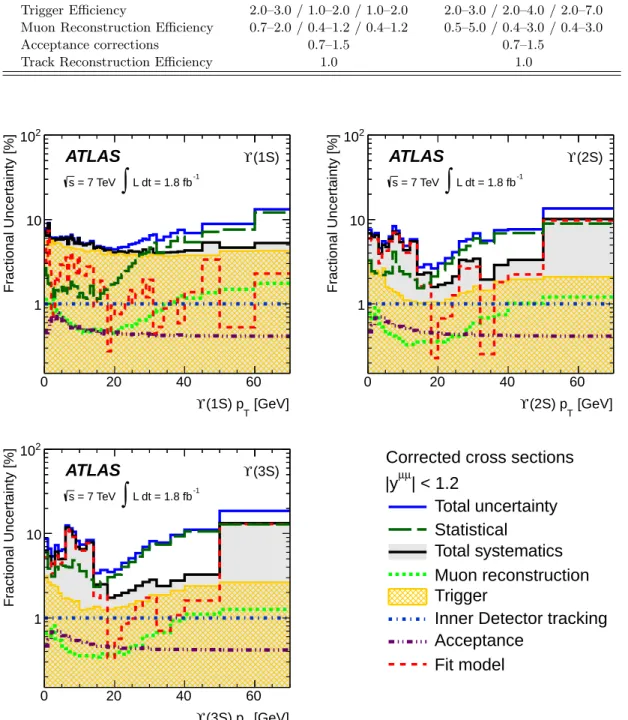
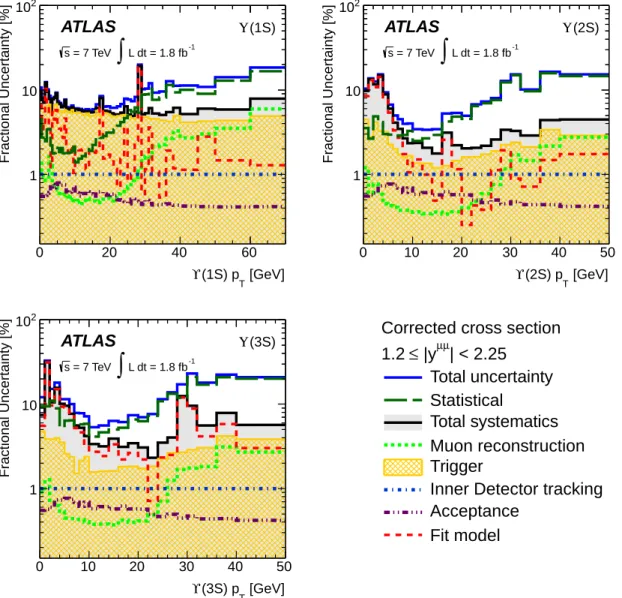
We consider the following sources of systematic uncer-tainty on the Υ (nS) differential cross sections: luminos-ity determination, reconstruction and trigger efficiencies, migration between pµµT and |yµµ| bins due to resolution,
acceptance corrections, and the background and signal fit models used. The range of these uncertainties for the three Υ states is summarized in Table I and their breakdown in each source is given for the corrected
cross-section analysis in Figs. 5–7.
The relative luminosity uncertainty of 3.9% is de-scribed in more detail in Ref. [29]. Other sources of systematic uncertainty are discussed below. As the sta-tistical components of the uncertainties associated with the determination of εreco and εtrig are dominant, the
uncertainties on the cross sections are derived from the statistics of the control samples used to extract them us-ing a series of pseudo-experiments, randomly varyus-ing the weights used for each Υ candidate in data, according to the uncertainties on the efficiency maps. Systematic un-certainties associated with the fit model used to extract the number of Υ (nS) decays from our di-muon data sam-ple, are quantified by taking the largest deviation of the fitted values of NnSfound in the six possible model
com-binations from the average value. Systematic effects, due to differences in the underlying kinematic distributions of the control sample and the data distributions, are found to be negligible due to the fine differential binning of the efficiency and acceptance corrections.
Uncertainties associated with the acceptance correc-tion include statistical uncertainties on the determina-tion of the correcdetermina-tion in fine pT and rapidity bins. This
constitutes approximately a 0.5% uncertainty across the measured spectrum. A shift in the interaction point along the beamline axis, z, influences the acceptance particu-larly at large rapidity. To estimate the impact of this ef-fect, the acceptances were recalculated with shifts in z by ±62 mm, corresponding to one Gaussian standard devia-tion of the vertex z posidevia-tion distribudevia-tion in the analyzed data, and the variation in the measured cross sections was calculated as a function of Υ pTand rapidity. These
variations result in uncertainties on the acceptance cor-rections of 0.4–0.7% as a function of pT, and 0.6–1.5%
as a function of rapidity, growing toward larger rapidi-ties and lower transverse momenta. Our estimate of the correction to the number of Υ → µ+µ− decays fitted in
each (pµµT , yµµ) bin for differences between reconstructed
and true values of pµµT due to bin migration depends on a knowledge of the di-muon pTresolution. Allowing this
resolution to vary within its uncertainty results in a neg-ligible change in the Υ (nS) cross sections.
As mentioned earlier, Υ spin-alignment effects have an impact on the determination of cross sections extrapo-lated to full phase space. As in the ATLAS measurement of J/ψ production [7], we quote an uncertainty due to Υ spin-alignment by comparing results obtained using the unpolarized assumption (λθ = λφ = λθφ = 0) to those
derived under the other four extreme parameter combi-nations. The size of the possible variation in each bin is taken to be the largest positive and negative devia-tion from the unpolarized baseline result. We provide the cross-section results for each of the spin-alignment scenarios along with tabulated values [26] of the weight corrections so that the corrected data can be determined in terms of any spin-alignment scenario.
TABLE I: Summary of statistical and systematic uncertainties on the cross-section measurements. The systematic uncertainty due to the acceptance determination applies only to the corrected cross-section measurements and does not include possible
variation of the result due to spin-alignment. Values quoted refer to the range of uncertainties over pµµ
T in each of the y µµ regions considered. Relative Uncertainty [Υ (1S) / Υ (2S) / Υ (3S)] [%] Source |yµµ| < 1.2 1.2 ≤ |yµµ| < 2.25 Statistical Uncertainty 1.5–10 / 2–10 / 3–10 2–15 / 2.5–12 / 4–18 Fit Model 0.3–2 / 0.3–10 / 0.3–15 0.4–10 / 0.3–5.0 / 0.2–12 Luminosity 3.9 3.9 Trigger Efficiency 2.0–3.0 / 1.0–2.0 / 1.0–2.0 2.0–3.0 / 2.0–4.0 / 2.0–7.0
Muon Reconstruction Efficiency 0.7–2.0 / 0.4–1.2 / 0.4–1.2 0.5–5.0 / 0.4–3.0 / 0.4–3.0
Acceptance corrections 0.7–1.5 0.7–1.5
Track Reconstruction Efficiency 1.0 1.0
[GeV] T (1S) p ϒ 0 20 40 60 Fractional Uncertainty [%] 1 10 2 10 (1S) ϒ
ATLAS
-1 L dt = 1.8 fb∫
= 7 TeV s [GeV] T (2S) p ϒ 0 20 40 60 Fractional Uncertainty [%] 1 10 2 10 (2S) ϒATLAS
-1 L dt = 1.8 fb∫
= 7 TeV s [GeV] T (3S) p ϒ 0 20 40 60 Fractional Uncertainty [%] 1 10 2 10 (3S) ϒATLAS
-1 L dt = 1.8 fb∫
= 7 TeV sCorrected cross sections
| < 1.2
µ µ|y
Total uncertainty
Statistical
Total systematics
Muon reconstruction
Trigger
Inner Detector tracking
Acceptance
Fit model
FIG. 5: Sources of statistical and systematic uncertainty on the corrected Υ (nS) production cross-section measurements in the central rapidity region. A common luminosity uncertainty of ±3.9% is not included.
[GeV] T (1S) p ϒ 0 20 40 60 Fractional Uncertainty [%] 1 10 2 10 (1S) Υ
ATLAS
-1 L dt = 1.8 fb∫
= 7 TeV s [GeV] T (2S) p ϒ 0 10 20 30 40 50 Fractional Uncertainty [%] 1 10 2 10 (2S) ΥATLAS
-1 L dt = 1.8 fb∫
= 7 TeV s [GeV] T (3S) p ϒ 0 10 20 30 40 50 Fractional Uncertainty [%] 1 10 2 10 (3S) ΥATLAS
-1 L dt = 1.8 fb∫
= 7 TeV sCorrected cross section
| < 2.25
µ µ|y
≤
1.2
Total uncertainty
Statistical
Total systematics
Muon reconstruction
Trigger
Inner Detector tracking
Acceptance
Fit model
FIG. 6: Sources of statistical and systematic uncertainty on the corrected Υ (nS) production cross-section measurements in the forward rapidity region. A common luminosity uncertainty of ±3.9% is not included.
VI. RESULTS AND DISCUSSION
We measure the differential cross section multiplied by the di-muon branching fractions of Υ (1S), Υ (2S), and Υ (3S) mesons as a function of Υ transverse momen-tum and rapidity, both in a fiducial region defined by pµT> 4 GeV, |ηµ| < 2.3 (free from spin-alignment
uncer-tainties), and corrected back to the full muon decay phase space with |yΥ| < 2.25. We additionally present
mea-surements of the production cross sections of the Υ (2S) and Υ (3S) relative to the Υ (1S) as a function of Υ (1S) transverse momentum and rapidity. Tabulated results of all measurements presented in this paper are available in hepdata [26].
A. Fiducial cross sections
Differential cross sections multiplied by the Υ → µ+µ−
branching fractions, d2σ/dp
Tdy × Br(Υ → µ+µ−), are
calculated within the fiducial acceptance of our analy-sis (pµT > 4 GeV, |ηµ| < 2.3) using the results of fits
to di-muon candidates in data corrected, candidate by candidate, for efficiencies using the fiducial weights, wfid,
defined in Eq. (2). These differential fiducial cross sec-tions along with total uncertainties are shown in Figs. 8 and 9 and span four orders of magnitude across the pT
range studied.
Integrating over all pΥ
Tand both rapidity bins we find
cross sections within the fiducial acceptance of the detec-tor as shown in Table II. The results for the Υ (1S) are consistent with our previous measurement [8] but extend
(1S) |y| ϒ 0 0.5 1 1.5 2 Fractional Uncertainty [%] 1 10 (1S) ϒ
ATLAS
-1 L dt = 1.8 fb∫
= 7 TeV s (2S) |y| ϒ 0 0.5 1 1.5 2 Fractional Uncertainty [%] 1 10 (2S) ϒATLAS
-1 L dt = 1.8 fb∫
= 7 TeV s (3S) |y| ϒ 0 0.5 1 1.5 2 Fractional Uncertainty [%] 1 10 (3S) ϒATLAS
-1 L dt = 1.8 fb∫
= 7 TeVs
Corrected cross sections
Total uncertainty
Statistical
Total systematics
Muon reconstruction
Trigger
Inner Detector tracking
Acceptance
Fit model
FIG. 7: Sources of statistical and systematic uncertainty on the corrected Υ (nS) production cross-section measurements as a function of Υ rapidity. A common luminosity uncertainty of ±3.9% is not included.
to a significantly higher pΥ
Tand with increased precision.
TABLE II: Integrated fiducial cross-section measurements for Υ (nS). Uncertainties quoted represent statistical, systematic, and luminosity terms respectively.
Integrated fiducial cross sections
pµ T> 4 GeV, |η µ| < 2.3 State σfid(pp → Υ ) × Br(Υ → µ+µ−) Range: pΥ T< 70 GeV, |y Υ| < 2.25 Υ (1S) 1.890 ± 0.007 ± 0.095 ± 0.074 nb Υ (2S) 0.601 ± 0.003 ± 0.040 ± 0.023 nb Υ (3S) 0.304 ± 0.003 ± 0.021 ± 0.012 nb
Presenting the results in a restricted kinematic phase space removes any uncertainty due to the spin-alignment of quarkonia. This allows unambiguous comparison of differential spectra with any theoretical approaches which can provide predictions with kinematic restrictions applied to the decay products of the Υ .
NLO color-singlet [14] predictions [30] have previously been compared to differential Υ (1S) fiducial production cross sections [8] and were found to underestimate the measured production rates by approximately an order of magnitude and to not reflect the pT dependence of the
data. This is not surprising as it has been known [16] for some time that higher-order corrections are both large and necessary in order to adequately describe quarko-nium production at high pT with color-singlet terms.
[GeV] T p ϒ 0 10 20 30 40 50 60 70 ) [pb/GeV] -µ + µ → ϒ Br( × dy T /dp σ 2 d 10-2 -1 10 1 10 2 10 | < 2.3) µ η > 4 GeV, | µ T
Fiducial cross sections (p
ATLAS
-1 L dt = 1.8 fb∫
= 7 TeV s | < 1.2 ϒ |y (1S) ϒ (2S) ϒ (3S) ϒ [GeV] T p ϒ 0 10 20 30 40 50 60 70 ) [pb/GeV] -µ + µ → ϒ Br( × dy T /dp σ 2 d 10-2 -1 10 1 10 2 10 | < 2.3) µ η > 4 GeV, | µ TFiducial cross sections (p
ATLAS
-1 L dt = 1.8 fb∫
= 7 TeV s | < 2.25 ϒ |y ≤ 1.2 (1S) ϒ (2S) ϒ (3S) ϒFIG. 8: Differential cross sections multiplied by the di-muon
branching fraction, d2σ/dp
Tdy × Br(Υ → µ+µ−), for
cen-tral (top) and forward (bottom) rapidities, for Υ (1S), Υ (2S), Υ (3S) production within the fiducial acceptance. Points with error bars indicate results of the measurements with statisti-cal uncertainties while shaded areas correspond to total un-certainties on the measurement, including systematic effects.
are available for quarkonium production measurements quoted in a restricted muon acceptance, nor are Color Octet [17] or Color Evaporation [19] approaches currently able to account for the kinematics of leptons from the quarkonium decay. The fiducial measurements presented here are precise and free from any assumptions on the angular dependencies of the di-muon system, accurately reflecting the production dynamics in proton-proton col-lisons at√s = 7 TeV. |y| ϒ 0 0.5 1 1.5 2 ) [pb/0.05] -µ + µ → ϒ Br( × /dy σ d 1 10 2 10 3 10 ATLAS -1 L dt = 1.8 fb
∫
= 7 TeV s | < 2.3) µ η > 4 GeV, | µ TFiducial cross sections (p
< 70 GeV ϒ T p (1S) ϒ (2S) ϒ (3S) ϒ
FIG. 9: Differential cross sections multiplied by the di-muon
branching fraction, dσ/dy × Br(Υ → µ+µ−)(p
T-integrated)
dσ/dy × Br(Υ → µ+µ−)for Υ (1S), Υ (2S), Υ (3S) production
within the fiducial acceptance. Points with error bars indi-cate results of the measurements with statistical uncertain-ties while shaded areas correspond to total uncertainuncertain-ties on the measurement, including systematic effects.
B. Corrected cross sections
We also calculate differential cross sections multiplied by the Υ → µ+µ− branching fractions extrapolated to
the full muon phase space within |yΥ| < 2.25. For these
corrected cross sections, the results of fits to di-muon candidates in data are corrected, candidate by candi-date, for efficiencies using the total weights, wtot,
de-fined in Eq. (2). Results are shown for the isotropic spin-alignment scenario in Figs. 10 and 11 as a function of Υ pT and y for all three states and, integrated over all pΥT
and both rapidity bins, in Table III.
Our results are consistent with measurements by CMS [6] and, in the small region of rapidity overlap from 2.0 < |y| < 2.25, with LHCb [11]. These results allow us to test phenomenological models of Υ production not just at low pT(for complementarity with results from the
Tevatron experiments) but in a newly-probed region of significantly boosted Υ , where higher-order contributions become particularly important.
Figures 12–17 show the differential cross sections as a function of pT and rapidity for each of the Υ states
in comparison with theoretical predictions. The effects of varying spin-alignment assumptions from the nominal assumption of isotropic muon angular distributions inde-pendent of θ∗ and φ∗ are indicated by a shaded band.
Clearly, spin-alignment has a large effect on the Υ pro-duction cross sections, especially at low pΥ
[GeV] T p ϒ 0 20 40 60 ) [pb/GeV] -µ + µ → ϒ Br( × dy T /dp σ 2 d -2 10 -1 10 1 10 2 10 ATLAS -1 L dt = 1.8 fb
∫
= 7 TeV sCorrected cross sections
| < 1.2 ϒ |y (1S) ϒ (2S) ϒ (3S) ϒ [GeV] T p ϒ 0 20 40 60 ) [pb/GeV] -µ + µ → ϒ Br( × dy T /dp σ 2 d 10-2 -1 10 1 10 2 10 ATLAS -1 L dt = 1.8 fb
∫
= 7 TeV sCorrected cross sections
| < 2.25 ϒ |y ≤ 1.2 (1S) ϒ (2S) ϒ (3S) ϒ
FIG. 10: Differential cross sections multiplied by the di-muon branching fraction, for Υ (1S), Υ (2S) and Υ (3S) production
extrapolated to the full phase space for the (top) |yΥ| < 1.2,
(bottom) 1.2 ≤ |yΥ| < 2.25 rapidity intervals. Points with
error bars indicate the results of the measurements with total statistical and systematic errors. Results are shown assuming an isotropic spin-alignment scenario.
ular if there is a non-trivial azimuthal component to the spin-alignment. New results [4, 12] of Υ spin-alignment from CDF and CMS suggest that the spin-alignment is consistent with unpolarized production. Our central as-sumption of isotropic Υ decays is consistent with these results. Nevertheless, as these spin-alignment measure-ments are made at different center-of-mass energies or in a restricted phase space in both pΥ
Tand rapidity with
respect to measurements presented here, we provide the
|y| ϒ 0 0.5 1 1.5 2 ) [pb/0.05] -µ + µ → ϒ Br( × /dy σ d 10 2 10 3 10 ATLAS -1 L dt = 1.8 fb
∫
= 7 TeV sCorrected cross sections
< 70 GeV ϒ T p (1S) ϒ (2S) ϒ (3S) ϒ
FIG. 11: Differential cross sections multiplied by the di-muon branching fraction, for Υ (1S), Υ (2S) and Υ (3S) production
extrapolated to the full phase space, pT-integrated as a
func-tion of absolute Υ rapidity. Points with error bars indicate the results of the measurements with total statistical and sys-tematic errors. Results are shown assuming an isotropic spin-alignment scenario.
TABLE III: Corrected cross-section measurements in the isotropic spin-alignment scenario. Uncertainties quoted rep-resent statistical, systematic, and luminosity terms, respec-tively.
Integrated corrected cross sections
State σ(pp → Υ ) × Br(Υ → µ+µ−) Range: pΥ T< 70 GeV, |y Υ| < 2.25 Υ (1S) 8.01 ± 0.02 ± 0.36 ± 0.31 nb Υ (2S) 2.05 ± 0.01 ± 0.12 ± 0.08 nb Υ (3S) 0.92 ± 0.01 ± 0.07 ± 0.04 nb
results under a variety of polarization scenarios so that the impact of spin-alignment on the corrected cross sec-tions can be quantified across the full range of study.
The contributions of the five polarization scenarios can be seen in the lower panes of each plot where the ratio of the differential cross section under these spin-alignment assumptions to the unpolarized scenario is shown. Across the whole pTrange studied the envelope is bounded from
above by the T ++ (λθ= +1, λφ= +1, λθφ= 0) scenario
with a maximal φ∗ variation. From below, the
cross-section envelope is bounded by fully longitudinal spin-alignment at very low pT, with the T +− (λθ= +1, λφ=
−1, λθφ = 0) scenario resulting in the largest downward
0 10 20 30 40 50 60 70 ) [pb/GeV] -µ +µ → (1S) ϒ Br( × dy T /dp σ 2 d 10-2 -1 10 1 10 2 10 3 10 |yϒ(1S)| < 1.2
(1S) corrected cross sections
ϒ
Spin-alignment envelope NNLO* CSM (direct only) CEM (inclusive) ATLAS -1 L dt = 1.8 fb
∫
= 7 TeV s [GeV] T (1S) p ϒ 0 10 20 30 40 50 60 70 R a ti o t o F L A T 0.3 1 2 T++ T+0 T+- LONG [GeV] T (1S) p ϒ 0 10 20 30 40 50 60 70 R a ti o t o F L A T 0.3 1 2 T++ T+0 T+- LONG 0 10 20 30 40 50 60 70 ) [pb/GeV] -µ + µ → (1S) ϒ Br( × dy T /dp σ 2 d 10-2 -1 10 1 10 2 10 3 10 1.2 ≤ |yϒ(1S)| < 2.25(1S) corrected cross sections
ϒ
Spin-alignment envelope NNLO* CSM (direct only) CEM (inclusive) ATLAS -1 L dt = 1.8 fb
∫
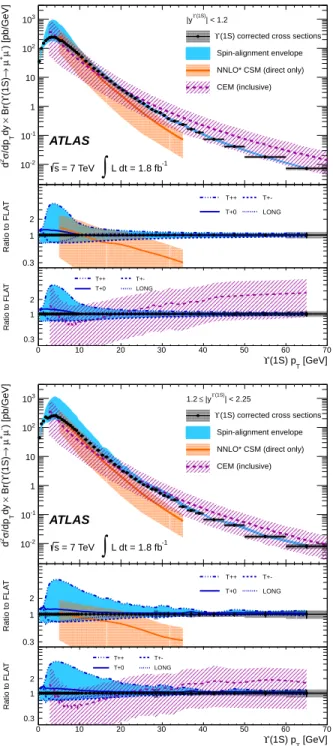
= 7 TeV s [GeV] T (1S) p ϒ 0 10 20 30 40 50 60 70 R a ti o t o F L A T 0.3 1 2 T++ T+0 T+- LONG [GeV] T (1S) p ϒ 0 10 20 30 40 50 60 70 R a ti o t o F L A T 0.3 1 2 T++ T+0 T+- LONGFIG. 12: Differential cross sections multiplied by the di-muon
branching fraction, d2σ/dp
Tdy × Br(Υ → µ+µ−), for Υ (1S)
production extrapolated to the full phase space for (top) cen-tral and (bottom) forward rapidities. Points with error bars indicate results of the measurements with total (statistical and systematic) uncertainties. The maximal envelope of vari-ation of the result due to spin-alignment uncertainty is indi-cated by the solid band. Also shown are predictions of direct production with the NNLO* Color Singlet Mechanism (CSM) and inclusive predictions from the Color Evaporation Model (CEM). These theory predictions are shown as a ratio to the data in the lower panes for CEM (middle) and CSM (bottom), along with detail of the variations of the cross-section mea-surement under the four anisotropic spin-alignment scenarios as a ratio to the nominal data.
0 10 20 30 40 50 60 70 ) [pb/GeV] -µ +µ → (2S) ϒ Br( × dy T /dp σ 2 d 10-2 -1 10 1 10 2 10 | < 1.2 (2S) ϒ |y
(2S) corrected cross sections
ϒ
Spin-alignment envelope NNLO* CSM (direct only) CEM (inclusive) ATLAS -1 L dt = 1.8 fb
∫
= 7 TeV s [GeV] T (2S) p ϒ 0 10 20 30 40 50 60 70 R a ti o t o F L A T 0.3 1 2 T++ T+0 T+- LONG [GeV] T (2S) p ϒ 0 10 20 30 40 50 60 70 R a ti o t o F L A T 0.3 1 2 T++ T+0 T+- LONG 0 5 10 15 20 25 30 35 40 45 50 ) [pb/GeV] -µ + µ → (2S) ϒ Br( × dy T /dp σ 2 d -2 10 -1 10 1 10 2 10 | < 2.25 (2S) ϒ |y ≤ 1.2(2S) corrected cross sections
ϒ
Spin-alignment envelope NNLO* CSM (direct only) CEM (inclusive) ATLAS -1 L dt = 1.8 fb
∫
= 7 TeV s [GeV] T (2S) p ϒ 0 5 10 15 20 25 30 35 40 45 50 R a ti o t o F L A T 0.3 1 2 T++ T+0 T+- LONG [GeV] T (2S) p ϒ 0 5 10 15 20 25 30 35 40 45 50 R a ti o t o F L A T 0.3 1 2 T++ T+0 T+- LONGFIG. 13: As for Fig. 12, but for Υ (2S) production.
the pT range above 45 GeV where the maximal possible
impact due to the unknown spin-alignment of Υ is below ±10%. This is significantly smaller than the theoreti-cal uncertainties and is of similar magnitude to current experimental uncertainties. As such, this region will of-fer a precision environment to compare future theoretical studies of Υ production to data.
In Figs. 12–14 a comparison is also made to two the-oretical predictions of Υ production. The first [16], is
0 10 20 30 40 50 60 70 ) [pb/GeV] -µ +µ → (3S) ϒ Br( × dy T /dp σ 2 d 10-2 -1 10 1 10 2 10 | < 1.2 (3S) ϒ |y
(3S) corrected cross sections
ϒ
Spin-alignment envelope NNLO* CSM (direct only) CEM (inclusive) ATLAS -1 L dt = 1.8 fb
∫
= 7 TeV s [GeV] T (3S) p ϒ 0 10 20 30 40 50 60 70 R a ti o t o F L A T 0.3 1 2 T++ T+0 T+- LONG [GeV] T (3S) p ϒ 0 10 20 30 40 50 60 70 R a ti o t o F L A T 0.3 1 2 T++ T+0 T+- LONG 0 5 10 15 20 25 30 35 40 45 50 ) [pb/GeV] -µ + µ → (3S) ϒ Br( × dy T /dp σ 2 d 10-2 -1 10 1 10 2 10 | < 2.25 (3S) ϒ |y ≤ 1.2(3S) corrected cross sections
ϒ
Spin-alignment envelope NNLO* CSM (direct only) CEM (inclusive) ATLAS -1 L dt = 1.8 fb
∫
= 7 TeV s [GeV] T (3S) p ϒ 0 5 10 15 20 25 30 35 40 45 50 R a ti o t o F L A T 0.3 1 2 T++ T+0 T+- LONG [GeV] T (3S) p ϒ 0 5 10 15 20 25 30 35 40 45 50 R a ti o t o F L A T 0.3 1 2 T++ T+0 T+- LONGFIG. 14: As for Fig. 12, but for Υ (3S) production.
a QCD-based calculation using the color-singlet mech-anism [14], referred to as NNLO* CSM and presumes that Υ meson production occurs via a color-singlet state and includes full corrections up to next-to-leading order (NLO), as well as some of the most important next-to-next-to-leading-order (NNLO) terms. This inclusion significantly modifies the prediction. The partial na-ture of the higher-order calculation limits the applicabil-ity of the calculation to values above a particular Υ pT
threshold and increases the sensitivity of the prediction to the choice of renormalization and factorization scales. The second prediction, known as the Color Evaporation Model [19, 31], labeled as CEM, is a phenomenological model for inclusive Υ production based on quark-hadron duality. This model assumes that any heavy Q ¯Q pair pro-duced in the initial hard scattering evolves to a quarko-nium state if its mass is below the threshold of open heavy-flavor meson pairs. Predictions of the CEM model involve a single constant that must be determined from corrected cross-section measurements for each quarko-nium state and use a b-quark mass of 4.75 GeV. As in the case of the CSM, divergences in the predictions re-strict the applicability of the model at low Υ pT.
Uncer-tainties from factorization and renormalization scales are estimated from varying the scales independently up and down by a factor of two and additional uncertainties are estimated from varying the b-quark mass [32].
Color-singlet calculations at NLO/NNLO* predict a largely longitudinal polarization of direct Υ particularly at high pT (although the effect of feed-down introduces
large uncertainties to this prediction). The Color Evap-oration Model offers no explicit prediction of the spin-alignment evolution of Υ but the nature of the model suggests no strong polarization should be observed as no single production mechanism dominates.
As can be seen in Figs. 12–14, the two models pro-vide quite different descriptions of Υ production. Predic-tions from CSM are for direct Υ production only, and so do not account for Υ production that arises from feed-down from the production of higher Υ states or from ra-diative decays of the χbJ(nP). From previous
measure-ments [33] the contribution of feed-down to Υ (1S) pro-duction is known to be approximately 50%, but the pT
dependence of the feed-down is not well-known and can-not be reliably predicted and so no explicit correction is made to the CSM predictions shown. No correction is needed for the CEM as this is already an inclusive calcu-lation. Feed-down contributions are expected to similarly contribute to Υ (2S) production, but no measurement or reliable prediction for the relative contribution exists, so we do not apply a correction to the direct Υ (2S) CSM predictions either. For Υ (3S) there is no feed-down from higher Υ states. Recently, the ATLAS experiment discov-ered [34] the existence of a state or states interpreted as the χbJ(3P) below the BB threshold that are expected to
have a significant branching fraction for radiative decays into Υ (3S) + γ and thus induce a feed-down contribution to Υ (3S) (and other Υ states). As the relative production and decay rates of these states are also as yet unknown no correction is applied to the CSM predictions for Υ (3S) production either.
For each of the three Υ (nS) states, the NNLO* CSM predictions (considering also the additional normaliza-tion uncertainty due to the poorly-known contribunormaliza-tions from feed-down) fit our data well in the moderate pΥ
T
region, but exhibit a steeper pT dependence than seen
under-estimate the cross section at high pT. Theoretical
de-velopments in the prediction of feed-down contributions may improve this description. CEM predictions appear to show a better match with data at high pΥ
T. These
predictions underestimate the rate (favouring a smaller choice of renormalization/factorization scale or larger b-quark mass) and have problems in modeling the shape of the spectrum, particularly at lower pT. Shape
discrep-ancies cannot be accommodated within the uncertainties quoted as changes in the scale choice introduce correlated changes in the prediction as a function of pT.
0 0.2 0.4 0.6 0.8 1 1.2 1.4 1.6 1.8 2 2.2 ) [pb/0.05] -µ + µ → (1S) ϒ Br( × /dy σ d 3 10 4 10
(1S) corrected cross sections
ϒ Spin-alignment envelope ATLAS -1 L dt = 1.8 fb
∫
= 7 TeV s (1S) |y| ϒ 0 0.5 1 1.5 2 R a ti o t o F L A T 0.6 1 2 T++ T+0 T+- LONGFIG. 15: Differential cross sections multiplied by the di-muon
branching fraction, dσ/dy × Br(Υ → µ+µ−), for Υ (1S)
pro-duction extrapolated to the full phase space. Points with error bars indicate results of the measurements with total (statis-tical and systematic) uncertainties. The maximal envelope of variation of the result due to spalignment uncertainty is in-dicated by the solid band. The variations of the cross-section measurement under the four anisotropic spin-alignment sce-narios are shown in the lower pane as ratios to the unpolarized scenario.
Figures 15 to 17 show the variation of the production cross section as a function of absolute Υ rapidity inte-grated across all pT. The dependence on rapidity is
rel-atively flat in the interval of rapidities in the ATLAS acceptance.
Variations between spin-alignment scenarios lead largely to a change in the normalization of the distri-butions with little variation in shape except at high ra-pidity. There, the T ++ scenario leads to an increase in the cross section with increasing rapidity, while the fully longitudinal scenario leads to a drop in cross section at high (|y| & 1.7) rapidity.
0 0.2 0.4 0.6 0.8 1 1.2 1.4 1.6 1.8 2 2.2 ) [pb/0.05] -µ + µ → (2S) ϒ Br( × /dy σ d 2 10 3 10
(2S) corrected cross sections
ϒ Spin-alignment envelope ATLAS -1 L dt = 1.8 fb
∫
= 7 TeV s (2S) |y| ϒ 0 0.5 1 1.5 2 R a ti o t o F L A T 0.6 1 2 T++ T+0 T+- LONGFIG. 16: As for Fig. 15, but for Υ (2S) production.
0 0.2 0.4 0.6 0.8 1 1.2 1.4 1.6 1.8 2 2.2 ) [pb/0.05] -µ + µ → (3S) ϒ Br( × /dy σ d 2 10 3 10
(3S) corrected cross sections
ϒ Spin-alignment envelope ATLAS -1 L dt = 1.8 fb
∫
= 7 TeV s (3S) |y| ϒ 0 0.5 1 1.5 2 R a ti o t o F L A T 0.6 1 2 T++ T+0 T+- LONGFIG. 17: As for Fig. 15, but for Υ (3S) production.
C. Cross section ratios
From our differential cross-section measurements, we explore the pT and rapidity dependence of Υ (2S) and
Υ (3S) production relative to the Υ (1S) by deriving the ratios d2σ(pp → Υ (nS))/dp Tdy d2σ(pp → Υ (1S))/dp Tdy × Br(Υ (nS) → µ+µ−) Br(Υ (1S) → µ+µ−) (9)
for |yΥ| < 2.25 with n=2,3. Such observables are
sen-sitive to the magnitude and kinematic dependencies of feed-down contributions between the three Υ states. Re-sults of the differential cross-section ratio measurements are presented in Figs. 18 and 19.
|y| ϒ 0 0.5 1 1.5 2 ) Ratio -µ + µ → ϒ Br( × σ 0 0.2 0.4 ATLAS -1 L dt = 1.8 fb
∫
= 7 TeV sCorrected cross sections
< 70 GeV ϒ T p (1S) ϒ (2S)/ ϒ (1S) ϒ (3S)/ ϒ
FIG. 18: Ratios of differential Υ (2S)/Υ (1S) and Υ (3S)/Υ (1S) cross sections multiplied by the di-muon branching fractions as a function of di-muon rapidity. Points with error bars in-dicate results of the measurements with statistical uncertain-ties while shaded areas correspond to total uncertainuncertain-ties on each point, including systematic effects, but excluding spin-alignment effects.
These measurements are made under the assumption of unpolarized Υ (nS) mesons, and take into account sta-tistical correlations between the fitted numbers of Υ (1S), Υ (2S) and Υ (3S) mesons. Systematic uncertainties are estimated by varying acceptance, efficiency, and fit model assumptions coherently in the numerator and denomina-tor when calculating the ratios, thereby partially cancel-ing uncertainties in the ratio. Luminosity uncertainties cancel entirely.
The measured Υ (nS)/Υ (1S) ratios are relatively con-stant in the 0 < pT < 5 GeV interval at ∼ 20% and
∼ 7% respectively for the Υ (2S) and Υ (3S). At higher pT a significant and steady rise in the relative
produc-tion rates of higher Υ states is apparent, in agreement with measurements by CMS [6]. However, at the larger pΥ
Tvalues (above pΥTof 30–40 GeV) accessible for the first
time with these measurements, evidence of a saturation in this rise is apparent, suggesting that we are probing a regime where direct production dominates over contribu-tions from the decays of excited states. In contrast, the rapidity dependence of these production ratios is quite flat across the full |y| < 2.25 rapidity interval.
Higher-order color-singlet calculations are not
[GeV] T p ϒ 0 20 40 60 ) Ratio -µ + µ → ϒ Br( × σ 0 0.2 0.4 0.6 0.8 1 ATLAS -1 L dt = 1.8 fb
∫
= 7 TeV sCorrected cross sections
| < 1.2 ϒ |y (1S) ϒ (2S)/ ϒ (1S) ϒ (3S)/ ϒ [GeV] T p ϒ 0 10 20 30 40 50 ) Ratio -µ + µ → ϒ Br( × σ 0 0.2 0.4 0.6 0.8 1 ATLAS -1 L dt = 1.8 fb
∫
= 7 TeV sCorrected cross sections
| < 2.25 ϒ |y ≤ 1.2 (1S) ϒ (2S)/ ϒ (1S) ϒ (3S)/ ϒ
FIG. 19: Ratios of differential Υ (2S)/Υ (1S) and Υ (3S)/Υ (1S) cross sections multiplied by the di-muon branching fractions
versus Υ pT in the (top) central and (bottom) forward
ra-pidity regions. Points with error bars indicate results of the measurements with statistical uncertainties while shaded ar-eas correspond to total uncertainties on each point, including systematic effects, but excluding spin-alignment effects.
rently able to predict the evolution of these production ratios in pΥ
T due to the significant feed-down
contribu-tions. At leading order in the quark velocity in the per-turbative expansion, the production ratio of the direct contributions is proportional to the ratio of the squares of the magnitudes of the wavefunction at the origin (or the partial decay widths), multiplied by the branching fractions to di-muons for each of the states in question. The predicted ratios then are 36% for Υ (2S)/Υ (1S) and
29% for Υ (3S)/Υ (1S) for direct production. At high pT,
where the measured production ratio plateaus, the val-ues are somewhat higher than these predictions suggest-ing that there is some enhancement (with respect to the simple picture above) of the Υ (2S) and Υ (3S) production relative to Υ (1S) production.
VII. CONCLUSIONS
We have measured differential production cross sec-tions and relative production rates for Υ (1S), Υ (2S), and Υ (3S) mesons in pp collisions at √s = 7 TeV at the LHC up to pΥ
T < 70 GeV in the rapidity
inter-val |yΥ| < 2.25. The possible impact of the Υ
spin-alignment on these measured spectra is also quantified. These measurements are compatible with measurements by the CMS and LHCb collaborations. We have mea-sured integrated corrected cross sections multiplied by the Υ → µ+µ− branching fractions, within the
rapid-ity region |yΥ| < 2.25 of 8.01 ± 0.02 ± 0.36 ± 0.31 nb,
2.05±0.01±0.12±0.08 nb, and 0.92±0.01±0.07±0.04 nb for the Υ (1S), Υ (2S), and Υ (3S), respectively. Uncertain-ties correspond to statistical, systematic, and luminosity measurement effects.
These cross-section estimates assume unpolarized pro-duction corresponding to λθ = λφ = λθφ = 0 in
Eq. (3). If the production polarization is fully trans-verse or longitudinal with no dependence on the az-imuthal decay angle φ∗, corresponding to λ
θ= ±1, λφ=
λθφ = 0, the integrated cross sections may vary by up
to (+19, −23)%, (+18, −21)% and (+17, −19)% respec-tively for the Υ (1S), Υ (2S) and Υ (3S). However, accep-tances corresponding to certain non-zero values of λφcan
become extremely low, especially at low transverse mo-menta of the muon pair. This would lead to a significant increase of the corrected cross sections in these configu-rations, up to +217%, +155% and +126% for the three Υ states.
We compare our differential cross-section results to predictions from two theoretical approaches describing Υ production. Our measurements find both the NNLO* CSM and the CEM predictions have some problems in describing the normalization and shape of the differen-tial spectra. In particular, NNLO* dramatically under-estimates the rate at high transverse momenta, where the data tend to agree better with the CEM. The in-clusion of P -wave feed-down contributions in the theo-retical calculation may help to improve the description. Large scale uncertainties in these predictions allow pos-sible contributions from color-octet terms to contribute
to the production rate in addition to singlet diagrams. The differential production ratios indicate that the in-crease in the production of higher Υ states as a function of pΥ
Trelative to the Υ (1S) observed previously begins to
saturate at 30–40 GeV. Above ∼ 40 GeV, the envelope of possible variations in the differential cross sections due to spin-alignment is reduced to below ±10%. This, along with the expected reduction in feed-down contributions, results in a relatively well-controlled region in which to study quarkonium production without the dominant ex-perimental and theoretical effects that complicate such studies at lower pT.
VIII. ACKNOWLEDGEMENTS
We thank CERN for the very successful operation of the LHC, as well as the support staff from our institutions without whom ATLAS could not be operated efficiently. We acknowledge the support of ANPCyT, Argentina; YerPhI, Armenia; ARC, Australia; BMWF and FWF, Austria; ANAS, Azerbaijan; SSTC, Belarus; CNPq and FAPESP, Brazil; NSERC, NRC and CFI, Canada; CERN; CONICYT, Chile; CAS, MOST and NSFC, China; COLCIENCIAS, Colombia; MSMT CR, MPO CR and VSC CR, Czech Republic; DNRF, DNSRC and Lundbeck Foundation, Denmark; EPLANET, ERC and NSRF, European Union; IN2P3-CNRS, CEA-DSM/IRFU, France; GNSF, Georgia; BMBF, DFG, HGF, MPG and AvH Foundation, Germany; GSRT and NSRF, Greece; ISF, MINERVA, GIF, DIP and Benoziyo Center, Israel; INFN, Italy; MEXT and JSPS, Japan; CNRST, Morocco; FOM and NWO, Netherlands; BRF and RCN, Norway; MNiSW, Poland; GRICES and FCT, Portugal; MERYS (MECTS), Romania; MES of Rus-sia and ROSATOM, RusRus-sian Federation; JINR; MSTD, Serbia; MSSR, Slovakia; ARRS and MVZT, Slovenia; DST/NRF, South Africa; MICINN, Spain; SRC and Wallenberg Foundation, Sweden; SER, SNSF and Can-tons of Bern and Geneva, Switzerland; NSC, Taiwan; TAEK, Turkey; STFC, the Royal Society and Lever-hulme Trust, United Kingdom; DOE and NSF, United States of America.
The crucial computing support from all WLCG part-ners is acknowledged gratefully, in particular from CERN and the ATLAS Tier-1 facilities at TRIUMF (Canada), NDGF (Denmark, Norway, Sweden), CC-IN2P3 (France), KIT/GridKA (Germany), INFN-CNAF (Italy), NL-T1 (Netherlands), PIC (Spain), ASGC (Tai-wan), RAL (UK) and BNL (USA) and in the Tier-2 fa-cilities worldwide.
[1] J. J. Aubert et al., Phys. Rev. Lett. 33 (1974) 1404; J. E. Augustin et al., Phys. Rev. Lett. 33 (1974) 1406. [2] D. C. Hom et al., Phys. Rev. Lett. 39 (1977) 252.
[3] CDF Collaboration, T. Aaltonen et al., Phys. Rev. D 71 032001 (2005) arXiv:hep-ex/0412071; D0