HAL Id: hal-01948169
https://hal.archives-ouvertes.fr/hal-01948169
Submitted on 11 Jan 2019
HAL is a multi-disciplinary open access archive for the deposit and dissemination of sci-entific research documents, whether they are pub-lished or not. The documents may come from teaching and research institutions in France or abroad, or from public or private research centers.
L’archive ouverte pluridisciplinaire HAL, est destinée au dépôt et à la diffusion de documents scientifiques de niveau recherche, publiés ou non, émanant des établissements d’enseignement et de recherche français ou étrangers, des laboratoires publics ou privés.
Migrant Remittances and Economic Growth: The Role
of Financial Development and Institutional Quality
Imad El Hamma
To cite this version:
Imad El Hamma. Migrant Remittances and Economic Growth: The Role of Financial Development and Institutional Quality. Economie et Statistique / Economics and Statistics, INSEE, 2019, pp.123-142. �10.24187/ecostat.2018.503d.1961�. �hal-01948169�
Received on 25 August 2017, accepted after revisions on 24 August 2018
The Role of Financial Development and Institutional
Quality
Imad El Hamma*
Abstract – This paper investigates the conditional effects of remittances on economic growth in 14 Middle East and North Africa (MENA) countries. Using unbalanced panel data over the period 1982‑2016, we study the hypothesis that the effect of remittances on economic growth varies depending on the level of financial development and institutional environment in recipient countries. We use Two‑Stage Least Squares (2SLS/IV) instrumental variables method in which we address the endogeneity of remittances. Our results reveal a complementary relationship between financial development and remittances to ensure economic growth. The estimations show that remittances promote growth in countries with a developed financial system and a strong institutional environment.
JEL Classification: G23, O17, O22
Keywords: remittances, economic growth, financial development, institutions quality
Reminder:
The opinions and analyses in this article are those of the author(s) and do not necessarily reflect their institution’s or Insee’s views.
To cite this article: El Hamma, I. (2018). Migrant Remittances and Economic Growth: The Role of Financial Development and Institutional Quality. Economie et Statistique / Economics and Statistics, 503‑504, 123‑142.
* Université Paris‑Est‑Marne‑la‑Vallée, ERUDITE, and Université Côte d’Azur, GREDEG, CNRS (Imad.elhamma@gmail.com)
The author would like to thank the Arab Council for the Social Sciences for the financial support, as well as the participants at the AFSE meeting in Nice and two anonymous referees. The author is also responsible for any error or omission in this document.
T
he increase in the volume of interna‑ tional migration over recent decades has led to an unprecedented increase in financial flows to labor‑exporting countries. Indeed, international migrant remittances,1 or moneysent from migrants to households in the coun‑ try of origin, have begun to be a significant source of external financing for developing countries. Considering only the remittances passing through formal channels their amount increased by 8.5 percent in 2017, rising to US$ 466 billion (World Bank, 2018). In all regions, remittances have rebounded in 2017: by 20.9 percent in Europe and Central Asia, 11.4 per‑ cent in Sub‑Saharan Africa, 9.3 percent in the Middle East and North Africa (MENA), 8.7 percent in Latin America and the Caribbean, and by 5.8 percent in East Asia and the Pacific or in South Asia. The trend is expected to con‑ tinue in 2018, with remittance flows to devel‑ oping countries growing by an estimated 4.1 percent to reach $485 billion. With US$ 73 bil‑ lion of remittances, the MENA region is one of the top remittance recipients in the world after East Asia and the Pacific, Latin America and the Caribbean.
In the last decade, remittances have expanded while other financial inflows have declined. This has made remittances one of the most important sources of foreign exchange and household income. They contribute signifi‑ cantly to GDP surpassing Official Development Assistance (ODA), as well as to private debt and portfolio equity. In the countries of MENA region, in 2017, personal remittances received represented on average 6.5% of GDP (World Bank, 2018). The top receivers in terms of percentage of GDP are Lebanon (15.3%) and Palestine (14.3%) closely followed by Jordan (11%), Egypt (9.5%) and Morocco (6.2%) (cf. Appendix, Figure A‑I).
However, recorded data on remittances are imperfect and underestimate the actual flows. On the one hand, a number of developing coun‑ tries do not report remittances in their balance of payments (e.g. Afghanistan, Cuba). On the other hand, since fees for sending money (bank or transfer operators fees) are relatively high, remittances are often sent via informal chan‑ nels such as friends, relatives and the Hawala system.2 El Qorchi et al. (2003) estimate infor‑
mal flows in the range of 10 to 50% of recorded remittances. Remittances fees are known to be high, they depend on the transferred amount, the exchange rate and the country of desti‑ nation. The World Bank estimates that these
fees represent about 10% of the amount sent. Consequently, the high costs of operations may discourage migrants from sending small amounts through formal channels. Moreover, while migrants might be able to access formal operators or banking services to send money, this is not necessarily the case for recipients.12
In the literature, the macroeconomic effects of remittances have been the subject of renewed attention in recent years. As other financial flows, remittances have positive and negative effects. They may increase investments, affect human capital accumulation and alleviate pov‑ erty. They may also significantly reduce work effort, create moral hazards or lead to Dutch disease effects. However, the majority of these studies have only focused on the direct effects and they do not incorporate the indirect or the conditional effects. Potential endogeneity problem may also affect these estimations. Remittances are endogenous to education, household income and labour supply of fam‑ ily members and relatives left behind. Reverse causality,3 common factors affecting both
remittances, economic growth, and measure‑ ment error are also sources of endogeneity. To address the endogeneity of remittances, in addition to their direct effect, this paper exam‑ ines the conditional effects of remittances on economic growth in 14 MENA countries.4 Our
contribution to the literature consists in looking specifically at the interaction between remit‑ tances and financial development, on the one hand, and between remittances and the level of institutional quality, on the other hand. Thus, we include a number of interaction variables in the empirical investigations. Our regressions show that a solid financial system and good level of institutional quality complement the positive effect of remittances on economic growth. The remainder of this paper is organised as follows. The next section provides a litera‑ ture survey of the relationship between remit‑ tances and economic growth. The following
1. Transfers in kind are not included in international statistics. 2. Hawala system is a parallel, informal remittance system. A Hawala transaction does not involve any physical transfer of cash from one country to another one. The system relies on a network of operators called Hawaldars or Hawala dealers. A person willing to transfer money contacts a Hawala operator at the source location. The Hawala operator collects the money and indicates the beneficiary. He then contacts his counterpart in the destination place/country (another Hawala operator) who will deliver the money to the designated beneficiary.
3. Migrants’ remittances may reduce income volatility, promote the finan‑ cial sector and increase the quality of institutions.
4. Algeria (DZA), Egypt (EGY), Iran (IRN), Iraq (IRQ), Israel (ISR), Jordan (JOR), Lebanon (LBN), Turkey (TUR), Morocco (MAR), Syria (SYR), Malta (MLT), Tunisia (TUN) and Palestine (PSE).
section describes the data, model specification and econometric technique. Then the empirical results are discussed.
Literature Survey
Existing studies on remittances do not provide conclusive evidence of their macroeconomic impacts. While some have found that remit‑ tances may increase investments (Woodruff & Zenteno, 2007; Giuliano & Ruiz‑Arranz, 2009), make human capital accumulation easy (Edwards & Ureta, 2003; Rapoport & Docquier, 2005; Calero et al., 2009; Combes & Ebeke, 2011), enhance total factor produc‑ tivity (Abdih et al., 2012) and alleviate poverty (Akobeng, 2016; Majeed, 2015; Adams Jr & Cuecuecha, 2013), others have pointed out that remittances may significantly reduce recipient households’ work effort (El Hamma, 2017; Chami et al., 2005), create moral hazards (Gubert, 2002), accelerate inflation (Khan & Islam, 2013), and lead to Dutch disease effects i.e. an appreciation in the real exchange rate accompanied by resource re‑allocation from the traded sector towards the non‑traded sec‑ tor (Amuedo‑Dorantes et al., 2010; Bourdet & Falck, 2006; Acosta et al., 2009).
Likewise, neither theoretical nor empirical studies have provided conclusive answers regarding the specific effect of remittances on economic growth. Faini (2002) provides evidence of their positive effect on economic growth, but Chami et al. (2003) find a negative correlation between remittances and growth, due to moral hazard and the reduction of recip‑ ients’ labour force participation. However, Lucas (2005) criticised Chami’s study for not taking into account the remittances’ endo‑ geneity problem. In the Philippines, using simple correlation and vector autoregression technique (Impulse Response Functions) on annual data for 1985‑2002, Burgess and Haksar (2005) argue that the long‑term eco‑ nomic effects of remittances are ambiguous. However, they find evidence of a stabilising impact of remittances on private consumption. For the same country, Ang (2009) finds that the overall impact of remittances on growth is positive. Ziesemer (2012) provides evidence suggesting that the effect of remittances on economic growth is stronger in low‑income countries (i.e. income lower than US $ 1,200 per capita). Moreover, the author shows the presence of remittances would increase the growth rate by two percentage points. For
Latin American countries, Mundaca (2009), using the domestic bank credit as a regressor to examine the effect of remittances on growth, also finds a positive effect of remittances on economic growth. According to this author, a 10% increase in remittances (measured as a percentage of GDP) contributes to increasing per capita GDP by 3.49%. When she drops domestic bank credit from the equation, the GDP per capita increases only by 3.18%. More recently, in Sub‑Saharan African (SSA) countries, Singh et al. (2011) report that the impact of international remittances on eco‑ nomic growth is negative. However, countries with good governance have more opportu‑ nity to unlock the potential for remittances to improve economic growth. In a related study, using annual panel data for 64 African, Asian, and Latin American‑Caribbean countries from 1987‑2007, Fayissa and Nsiah (2012) find that remittances boost growth in countries with less developed financial systems, by providing an alternative way to finance investment and help‑ ing overcome liquidity constraints. In contrast, Ahamada and Coulibaly (2013) report that remittances do not increase growth in 20 SSA countries: for the authors, remittances do not increase physical capital investment. Adams and Klobodu (2016) using the General Method of Moments estimation technique, examine the effect of remittances and regime durability on economic growth find no evidence that remit‑ tances have contributed to economic growth in the SSA region.
Until the last decade, most empirical stud‑ ies seemed to neglect other channels through which remittances can stimulate economic growth. As stated above, remittances can increase the volume of disposable income and savings. Thus, they can stimulate the invest‑ ment rate and hence economic growth. In Pakistan, Adams Jr (2003) shows that interna‑ tional remittances have a positive effect on the saving rate. For the author, the marginal pro‑ pensity to save on international remittances is 0.71, while it is only 0.085 on rental income. Moreover, the author demonstrates that the Pakistani households who receive remittances have a very high propensity to save, and the effect of remittances on growth could be amplified if remittances are channelled by the banking sector. In Kyrgyzstan, Aitymbetov (2006) also finds that remittances positively affect economic growth because about 10% of these transfers are invested. Using survey data from Mexico, Woodruff and Zenteno
(2007) find that 5% of remittances received are invested in micro‑enterprises. For the authors, remittances have a positive effect on economic growth because they boost investment in the long term. Finally, in five Mediterranean coun‑ tries, Glytsos (2005) investigates the impact of exogenous shocks of remittances on consump‑ tion, investment, imports, and output. Building a Keynesian model in which he includes the remittances as part of disposable income, he demonstrates that remittances boost growth. For the author, the effect of remittances on growth passes through the income disposable and investment channels.
These empirical studies investigate the direct effect of remittances on the determinants of economic growth. However, other research‑ ers have investigated the conditional effect by incorporating an interaction term between international remittances and other variables that could complement the direct effect in stimulating growth. Fajnzylber et al. (2008) explore for Latin American countries the remittances’ effect on real per capita growth. The authors include as a regressor a term of interaction between remittances and human capital, political institutions and the financial development. They find a negative indication of the remittances’ coefficient and a positive sign of the interaction term when human cap‑ ital and institutions are included. However, the remittances coefficient has a positive sign and the interaction term has a negative sign when the financial system depth is included. Fajnzylber et al. (2008) conclude that human capital accumulation and improvement in institutional quality enhance the positive effect of remittances on economic growth. But the financial development substitutes for inter‑ national remittances in stimulating growth. On the basis of these findings, remittances are considered to be ineffective in enhancing economic development in countries where financial institutions are weak or where there is low human capital accumulation. Giuliano and Ruiz‑Arranz (2009) conducted a study similar to Mundaca’s. They used financial development in interaction with remittances as regressor and found that remittances are an alternative way to finance investment, help overcome liquidity constraints (substitute for the absence of financial development). In addi‑ tion, Bettin and Zazzaro (2012) include an interaction variable (remittances multiplied by bank efficiency index) and find a complemen‑ tary relation between remittances and financial development. As Giuliano and Ruiz‑Arranz
(2009), Catrinescu et al. (2009) use political and institutional variables as terms of inter‑ action with remittances. The authors, using the Anderson‑Hsio estimator, found a posi‑ tive relation between remittances and growth. However, Barajas et al. (2009) use microeco‑ nomics variables as instruments to deal with the potential endogeneity between remittances and growth. They find non‑significant direct effects of growth of remittances in an estimate for a panel of 84 developing countries.
The literature review above reveals that the impact of remittances on economic growth found in the studies highly depends on the estimation method, the sample period, the country characteristics (strong financial devel‑ opment, good institutions quality, strong bank efficiency), observed and unobserved country‑ specific effects and the endogeneity of regres‑ sors. However, as far as we know, no studies have directly investigated the conditional effect of remittances on growth in the MENA region, having focused only on the direct effect. This paper is an attempt to fill the gap. Specifically, we investigate the interaction between remit‑ tances, financial development and the level of institutional quality. To do this, a number of interaction variables have been included in the specifications to assess the conditions in which remittances can improve economic growth in MENA countries.
Model Specification, Data and Variables We investigate empirically the links between remittances, financial development, insti‑ tutional quality and economic growth by using an extended version of the growth model of Barro (1991, 1996). The following reduced‑form regression is used:
GrowthGDPit 0� + GDP + REM0 � ‑� 1 1 it it t i it X = + + + + α β β θ it η ν ε� (1) Here, GrowthGDPit indicates the growth of real GDP per capita in country i at time t. GDPit − 1 is the initial (logarithm) GDP per capita, REMit is the key explanatory variable referring to the ratio of the remittances to GDP,
ηt is the time‑specific effect, νi an unobserved
country‑specific effect and εit is the error term.
Xit is the matrix of control variables.
Following the definition of the World Bank, remittances are the current transfers sent by
resident or non‑resident workers to their coun‑ tries of origin. They include personal transfers and compensation of employees. Personal transfers consist of all current transfers in cash received (sent) by resident households from (to) nonresident households. Personal transfers thus include all current transfers between resident and nonresident individ‑ uals. Compensation of employees refers to the income of border, seasonal, and other short‑term workers who are employed in an economy where they are not resident and of residents employed by nonresident entities. The remittances variable is scaled by the home country’s GDP. It should be kept in mind that the data underestimate the amounts because they do neither include transfers through infor‑ mal channels (either such as hand‑carries by friends or family members or organised as through Hawala), nor in‑kind remittances (clothes and other consumer goods).
The choice of control variables and prox‑ ies of the determinants of growth are guided by the literature (Barro, 1996; Giuliano & Ruiz‑Arranz, 2009; Combe & Ebeke, 2011; Imai et al., 2014). These variables consist of: ‑ The initial GDP per capita (log(GDPt−1)) to test the convergence hypothesis (Barro, 1996); ‑ The ratio of gross fixed capital formation to real GDP used as a proxy for investment in physical capital;
‑ A proxy for the country’s degree of openness, measured by the ratio of the sum of exports and imports to GDP;
‑ The inflation rate, as a proxy for monetary discipline and macroeconomic stability; ‑ Government spending, measured as the ratio of government consumption to GDP;
‑ The age dependency ratio, that is, the ratio of dependents (people younger than 15 or older than 64) to the working‑age population (those ages 15‑64), as a proxy of capital human. To capture the role of financial development on the effect of remittances on growth, we use three proxies related to the banking sector: the domestic credit to the private sector by banks as a percentage of GDP, M3 (the sum of cur‑ rency and deposits in the central bank) as part of GDP and bank efficiency ratio. The first variable evaluates financial intermediation. The second one is used as a proxy of the size of financial intermediaries (relative to the size of the economy). The bank efficiency ratio is
defined as the sum of expenses (without inter‑ est expenses) divided by the revenue. This is a quick and easy measure of banking productiv‑ ity, i.e. a bank’s ability to turn resources into revenue. All these variables have been cho‑ sen to form the financial indicator of World Development Indicators (WDI).
To evaluate the role of the institutional quality level on the effect of remittances on growth, we use four proxies: Political Institutions index, Law and Order, Government Stability and Democratic Accountability indexes. The first index is used to assess the political sta‑ bility of the countries, Law and Order is used to assess the strength, impartiality of the legal system and popular observance of the law. Government Stability and Democratic Accountability indexes are used to respectively evaluate the government’s ability to carry out its declared program(s) and its ability to stay in office, and how responsive government is to its people. These indices on institutional quality are available in data from the PRS Group, who specializes in country risk analysis.5
Apart from the variables on institutions quality, all the others are drawn from the World Bank’s indicators (World Development Indicators, WDI). WDI is a collection of time‑series data for 217 economies, with many indica‑ tors going back to more than 50 years, that provides cross‑country comparable statistics about development and people’s lives around the globe. Summary statistics for all varia‑ bles and availability of the data are detailed in the Appendix (see Table A‑1). The model is estimated on annual observations, as well as 4‑years averaged data. All the variables are described in the Appendix (see Table A‑2). The paper implements a panel regression analysis of 14 countries (N = 14) from 1982 to 2015 (T = 34). The countries are Algeria, Egypt, Iran, Iraq, Israel, Jordan, Lebanon, Malta, Morocco, Palestine, Syria, Tunisia, Turkey and Yemen. These countries were cho‑ sen for being the top emigration countries in the region, and also countries for which rele‑ vant data on remittances inflows was available over the period 1982‑2016.
As a starting point (equation (1)), we do not include variables for financial development
5. Detailed definitions and calculation method for institutional quality data are available at https://www.prsgroup.com/wp‑content/uploads/2012/11/ icrgmethodology.pdf.
or institutional quality. Then, in a second set of regressions, we test the hypothesis that the responsiveness of economic growth to remit‑ tances depends on the level of financial devel‑ opment and the level of institutional quality. In other words, we explore how the level of finan‑ cial development or the institutional quality level of the recipient country affects the impact of remittances on economic growth. The nov‑ elty of the present paper lies in the estimation of the combined effect of remittances and conditional variables (financial development or the institutional quality). To this end, we introduce an interaction term between remit‑ tances and the financial development level or the institutional quality in equation (1). The modified versions of equation (1) that include the interactive terms can be written as:
GrowthGDP GrowthGDP
REM REM Findvp
it i it it it it = + + + × + − α β β β 0 1 1 2( ) ββ3Findvpit +θXit + + +
η ν
t i µit (2) GrowthGDP GrowthGDPREM REM InstQ
it = + + + × + − α β β β β i it it it it 0 1 1 2( ) 33InstQit +θXit+ + +
η ν
t i εit (3)In equation (2) and (3), the interaction term indicates that the effect of remittances on eco‑ nomic growth is different for different value of financial development or institutions qua‑ lity, respectively. The unique effect of remit‑ tances on economic growth is not limited to β1 but also depends on the value of β2 and financial development/institutions quality. In other words, β1 and β2 provide information on the marginal impact6 of remittances on growth
conditional upon the financial development level or the institutional quality. Moreover, in equation (2), if β1 is positive and β2 is negative, remittances are more effective in promoting growth in countries with a shallower finance system. In other words, a negative interaction means that remittances have de facto acted as a substitute for financial services to enhance economic growth. However, when the effect of remittances is significantly negative, a pos‑ itive interaction suggests that remittances and the financial system are complements (a bet‑ ter functioning financial system would lead remittances towards growth‑enhancement). In a similar way, in equation (3), a positive interaction (β2 > 0) would indicate that the institutional quality enhances the positive
effect of remittances on growth when (β1 > 0). Otherwise, when the interaction is negative (β2 < 0), the institutional quality diminishes (β1 > 0) or aggravates (β1 < 0) the negative impact of remittances on growth. 6
A panel fixed effect (FE‑OLS / OLS) estimation is used to estimate the effect of remittances on economic growth. However, we apply a Fixed Effects Two‑Stage Least Squares (FE 2SLS) developed by Bollen (1996) to deal with the potential endogeneity problem and measure‑ ment errors. For example, remittances and finance development are likely to be correlated with the error terms because of the reverse cau‑ sality from growth to those variables. However, when we run FE 2SLS, we test if the instru‑ ments selected are correlated with the endog‑ enous regressors using the weak instrument test developed by Cragg and Donald (1993) and test their endogeneity using the Sargan’s overidentifying restrictions test. According to the literature (Bollen, 1996; Bollen & Paxton, 1998; Pesaran & Taylor, 1999; Bollen et al., 2007), 2SLS method not only deals with the endogeneity problem and the possible causal‑ ity between remittances and growth: it easily caters for non‑linear and interactions effects, it permits the routine use of often ignored diag‑ nostic testing procedures for problems such as heteroscedasticity and specification error, and simulation evidence from econometrics sug‑ gests that 2SLS may perform better in small samples. For the endo genous variables, we rely on the internal instruments that are one lag variables. To check the validity of our estima‑ tions, collinearity, causality and endogeneity tests have been applied. In all the regressions, time‑dummy variables were included to deal with any specific time effect. This should help to reduce the degree of heteroscedasticity in the error terms. We believe that would make the FE 2SLS more reliable because they are asymptotically efficient as estimates from Generalized Method of Moments developed by Arellano and Bond (1991) and Blundell and Bond (1998).
Differentiating equations (2) and (3) with respect to remittances, equations (4) and (5) capture the marginal effect of remittances on GDP per capita growth for different levels of financial development and institutional quality, respectively. Moreover, according to equation (4) and (5), the minimum level (threshold) of
6. β1 measures the direct effect while β2 represents to the conditional effect.
financial development and institutional quality at which the effect of remittances on economic growth is equal to zero is (‑β1/β2).
ν
Findvp REM GDP + Findvp = ∂ ∂ � =‑β β1 2× it (4)ν
InstQ
REM
GDP
+
InstQ
= ∂
∂
�
=
‑
β β
1 2×
it (5) Econometric ResultsTables 1 and 2 (models 9‑11) report FE‑OLS and 2SLS regression based on equation 2 and using both annual and 4‑year averaged data to avoid any potential simultaneity bias. However, we only interpret the results of the 2SLS estimation, because OLS results are likely to be biased: the relationship between remittances‑growth and remittances‑financed development is certainly endogenous. Fixed effects and period effects are added to the whole regression, which makes sense as far as the level of remittances may change over time. Tables 1, 2 and 3 show that the regressions satisfy mutually the Kleibergan‑Paap test for weak instruments, and overidentification test of all instruments. The estimations reported in Table 1 (Model 1) show that the coefficient of the GDP lag is negative and strongly signifi‑ cant, and investment and trade openness are positively correlated with economic growth. Human capital, population growth rate and government spending negatively affect the growth rate (Jongwanich, 2007; Acosta et al., 2009). This finding seems to validate the idea that higher involvement of the govern‑ ment in the economy will have significant consequences on economic growth (Fer & Henrekson, 2001). Finally, high inflation is associated with a lower growth rate. These results are confirmed by estimation based on 4‑year averaged data (see Table 2).
Moving to the key variables, we can see that all the measures of financial development have a positive and statistically different from zero effect. However, the estimated coefficients of remittances are not statistically different from zero (i.e. remittances do not have a significant impact on economic growth). These findings contrast with previous literature which found a positive effect of remittances on economic growth (Klobodu et al., 2016; Imai et al., 2014; Nyamongo et al., 2012). These results suggest that remittances inflows to MENA countries could be sent in the presence of asymmetric information. The latest creates an imbalance
of power between migrants and recipients: the latter may adopt an opportunistic behaviour and display a deterioration in their living con‑ ditions in order to receive more remittances. In other words, recipients who opt to live off the transfers they receive are likely to decrease their labour force participation or work effort, limit their job search, or engage in risky ven‑ tures (Ebeke, 2012). In these cases, remittances arguably create moral hazard which is harmful to economic growth.
These results also lead to questioning the nature of the relationship between remittances and growth. In other words, the effect of remit‑ tances on economic growth may depend on other variables. Therefore, we explore this issue by investigating whether the financial develop‑ ment and the institutional level of the receiving countries influence the effect of remittances on the performance of economic growth. First, we estimate equation (2) in which a number of interaction variables have been added. We explore whether there is a substitutability or complementarity relationship between remit‑ tances and financial development in promoting economic growth in MENA countries. Models 2 to 4 (Table 1) and Models 9 to 11 (Table 2) present the outcomes of the regression models for both annual and four‑year averaged data. In each model, we use one proxy for financial development. The estimated coefficients of remittances and the interaction term are sig‑ nificantly negative and positive, respectively. As we explain above, the remittances and the financial development have a complementary effect in boosting the growth of GDP. This finding suggests that remittances have a pos‑ itive effect on economic growth only if the domestic banking system is sufficiently sound. Similar findings were also obtained by Bettin and Zazzaro (2012) and Nyamongo et al. (2012). However, these results are not in line with those of Barajas et al. (2009) or Giuliano and Ruiz‑Arranz (2009) that supported the substitution view. Unlike our study, Giuliano and Ruiz‑Arranz only used measures of the size of the financial sector, ignoring its effi‑ ciency (i.e.the ability to provide high‑quality products and services at the lowest cost). Solving equation (4), the threshold for a posi‑ tive effect of remittances on economic growth is equal to ‑(‑β1/β2). Based on 2SLS estimations of model 1, and taking into account the ratio of domes‑ tic credit provided by banks to GDP as meas‑ ure of the level of financial development, one obtain a value of ‑(‑0.31/0.07309 = 4.2413). The
Table 1
Growth, Remittances and Financial Development (Annual Data)
Independent variables
Dependent variable: GDP per capita growth (Annual data)
Model 1 Model 2 Model 3 Model 4 OLS 2SLS OLS 2SLS OLS 2SLS OLS 2SLS GDP per capita (initial) ‑0.0997 ‑1.281*** ‑0.106 ‑1.661*** ‑0.143 ‑1.582*** ‑0.113 ‑1.875*** (0.108) (1.467) (0.0986) (0.578) (0.0902) (1.583) (0.0933) (0.523) Investment ‑0.515 3.151*** 1.638* 5.591*** 1.615* 4.904*** 1.569* 5.905*** (1.083) (1.184) (0.881) (1.571) (0.875) (1.637) (0.878) (1.590) Inflation ‑0.00250 ‑0.00733* ‑0.0113 ‑0.0312** ‑0.0120 ‑0.0300*** ‑0.0109 ‑0.0295*** (0.0118) (0.00722) (0.00938) (0.0181) (0.00935) (0.0168) (0.00936) (0.0171) Trade openness 0.137 ‑0.751 0.504 0.916 0.317 0.935 0.363 1.414 (0.755) (1.666) (0.594) (1.453) (0.588) (1.449) (0.582) (1.526) Population growth ‑1.996***(0.655) ‑2.932***(0.766) ‑1.378**(0.570) ‑3.232***(0.643) ‑1.987***(0.600) ‑2.566***(0.650) (0.578)‑1.443** ‑3.406***(0.656) Government spending ‑1.135 ‑3.915** ‑1.757* ‑3.623** ‑2.081** ‑2.523 ‑1.777** ‑3.479** (1.151) (1.924) (0.928) (1.741) (0.905) (1.751) (0.905) (1.765) Human capital ‑0.338 ‑7.638*** 0.162 ‑5.805*** 1.231 ‑5.590*** 0.105 ‑5.444*** (1.616) (2.835) (1.349) (2.023) (1.343) (1.879) (1.317) (2.109) Remittances (REM) 0.479 1.005 ‑0.226 ‑0.310** ‑0.541** ‑0.4580** ‑0.330 ‑0.1421* (0.274) (0.486) (0.172) (0.017) (0.227) (0.099) (0.222) (0.084) Findvp1 0.0113* ‑0.0560* (0.0142) (0.0330) REM * Findvp1 0.0033 0.07309** (0.069) (0.0085) Findvp1 ‑0.373* 0.4945* (0.199) (0.0289) REM * Findvp2 0.0564 0.1438* (0.0234) (0.0122) Findvp3 ‑0.0487 0.0140** (0.0357) (0.0068) REM * Findvp3 0.373* 0.0757** (0.199) (1.0164) Constant ‑0.163** 0.0331* 0.0289 0.0393* (0.0733) (0.0847) (0.0851) (0.0847) Observations 359 355 311 309 331 324 311 303 R‑squared 0.331 0.292 0.292 0.295 0.234 0.276 0.234 0.290 Kleibergen
Paap test stat. 0.269 2.873 1.270 1.321 P‑value
Overidentit 0.311 0.728 0.292 0.172 Number of id 14 14 14 14 14 14 14 14 Notes: * p<0.05, ** p<0.01, *** p<0.001. Standard errors in parentheses and their significance were calculated using the robust procedure in the Stata software application. Findvp1 = Domestic credit to private sector by banks in % of GDP; Findvp 2 = Liquide Liabilities (Broad money) in % GDP sector to GDP; Findvp3 = Claims on private sector (annual growth as % of broad money).
Table 2
Growth, Remittances, Financial Development and Institutional Quality (4-Year Average Data)
Independent variables
Dependent variable: GDP per capita growth (4 year average)
Financial development Institutions quality Findvp & InstQ Model 9 Model 10 Model 11 Model 12 Model 13 Model 14 Model 15 Model 16 Model 17 Findvp1 Findvp2 Findvp3 Polit. risk Law and order Instab.Gov. Account..Demo. Pol. RiskFindev1/ Gov. Sta.Findvp2/ GDP per capita initial ‑0.057***(0.02) ‑0.052***(0.03) ‑0.087***(0.01) (0.02)‑0.024*** ‑0.016***(0.03) ‑0.018***(0.00) (0.04)‑0.231*** (0.08)‑0.058*** ‑0.015***(0.06) Investment 1.060*** 1.063** 1.026** 1.724** 1.313*** 1.420*** 3.994* 1.179** 1.280** (0.13) (0.11) (0.10) (0.08) (0.00) (0.08) (0.04) (0.25) (0.41) Human capital 1.195 1.234 1.038 8.978 3.499 5.163 3.214 6.385 ‑3.291 (0.79) (0.97) (0.18) (0.23) (0.85) (0.32) (0.04) (0.35) (0.98) Government spending 0.0483* (0.02)0.0471** (0.01)0.0560** (0.22)1.161** (0.06)0.421*** (0.03)0.761* (0.04)1.354*** (0.33)0.846** (0.99)0.398** Inflation (coefficient * 100) ‑0.02***(0.06) ‑0.034***(0.13) ‑0.0475***(0.08) (0.19)‑2.41*** ‑0.719***(0.58) ‑1.47***(0.28) (0.04)‑1.40*** (0.26)‑1.53** ‑0.641**(0.65) Population Growth ‑0.321***(0.10) (0.09)0.301*** (0.05)0.259** (0.20)1.823** (0.61)5.012** (0.29)3.0444* (0.04)6.138 (0.26)3.459* (0.64)4.330* Trade Openness ‑0.0311 ‑0.0252 ‑0.0714 ‑0.333 ‑0.0601 0.148 ‑1.110 ‑0.114 0.0266 (0.08) (0.06) (‑0.09) (0.10) (0.01) (0.17) (0.04) (0.07) (0.06) Remittances (REM) ‑0.0135**(0.03) ‑0.254**(0.05) ‑0.975***(0.05) (‑0.08)0.897** (0.39)0.646* (‑0.26)2.207*** (‑0.04)21.46** (‑0.00)‑0.0259* ‑0.749(0.48) Findvp1 0.154** 0.072 ** (0.14) (0.03) REM * Findvp1 (0.20)0.0626* (0.65)0.094* Findvp2 0.0345** 0.0305 (0.01) (0.10)* REM * Findvp2 (0.00).0181 *** (0.44).0364** Findvp3 0.894*** (0.15) REM * Findvp3 (0.05)0.0885** Political Risk Index ‑0.144(0.22) (0.34)*0.0984 REM * Pol.Risk Index (0.04)0.0270 (0.16)0.176 Government Instability ‑0.436***(0.84) ‑0.382*(0.9) REM * Gov. Instability 0.0687***(0.05) (0.03)0.0397
Law and Order ‑0.295**
(0.15) REM * Law and Order 0.0540***(0.27) Democratic Accountability (0.04)7.488 REM * Demo. Account. (0.04)0.062 Observations 61 61 58 58 58 58 58 58 58 R‑squared 0.232 0.231 0.254 0.392 0.119 0.230 0.131 0.219 0.323 Kleibergen Paap test stat. 0.000 0.001 0.000 0.000 0.000 0.000 0.001 0.001 0.000 P‑value Overidentit. 0.458 0.456 0.468 0.789 0.759 0.843 0.755 0.525 0.568 Number of id 14 14 14 13 13 13 13 13 13 Notes: * p<0.05, ** p<0.01, *** p<0.001. No data from Institutional Quality Database being available for Palestine, the country was excluded from the sample in models 12 to 17.
sample mean is equal to log(68.435) = 4.2196, indicating that the main part of the sample could benefit from remittance flows.
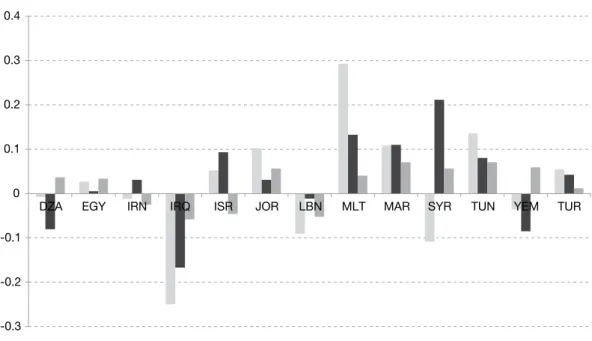
Table 3 provides the list of countries satisfying the threshold for the estimated models (mod‑ els 2 to 4). We can see that 8 out of 14 coun‑ tries satisfy the requested threshold of models 2 and 3. However, only 6 countries reach the requested threshold estimated with model 4. In the other countries, the impact of remittances on growth is negative.
For example, in the case of Egypt, when financial development is measured as the ratio of domes‑ tic credit provided by the financial sector to GDP, the total effect is ∂GDP / ∂REM = ‑0.4352 + (0.1873 × 4.4775) = 0.0172. This indicates that a 1% increase in the share of remittances in GDP leads to a 0.0172% increase in GDP per capita growth rate. However, in Algeria, a 1% increase in remittances leads to a 0.046% decrease in the GDP growth rate. Figure I presents the impact of remittances on GDP per capita growth calculated for each country at the mean level of the three financial development indicators. This figure shows that whatever the financial development indicator, only 6 countries of the sample seem to benefit from remittances.
As for the last estimations, all control va ria‑ bles have the expected sign and are on the whole significant, whatever the nature of the specification. From Table 4, we can note that the direct effect of the institutional variables is positive (with one exception, the case of the democratic accountability). This suggests that countries with high level of institutions qual‑ ity (lower risk) register a higher growth rate than countries with low level of institutions quality. This finding is in line with Farooq et
al. (2013) for Pakistan, Agostino et al. (2016)
for African countries, Huang (2015) for Asia Pacific countries and Alam (2017) for a panel of 86 countries.
Results of equation (3) appear in Table 4 (annual data) and in Table 2 (4‑year averaged data, models 12 to 15). In this estimation, we test the interaction between remittances and the institutional environment. In other words, the specification allows us to test the hypoth‑ esis that the effect of remittances on growth is conditioned by the institutional quality. We present five specifications. In the first one, we use the composite Political Risk Index. This index is the sum of 12 components measuring various dimensions of the political and busi‑ ness environment faced by the firms operating Table 3
Financial Development Threshold (Annual Data)
Mean by component
Model 2 Model 3 Model 4 β1 β2 β1 β2 β1 β2
‑0.3100 0.0730 ‑0.458 0.1438 ‑0.1421 0.0757 Findvp1 Findvp2 Findvp3 Threshold
Algeria 3.601424 2.735302 1.382847 4.2413 3.1850 1.8771 Egypt 4.477593 3.554391 1.709718 Countries satisfying the threshold by model
Iran 4.247697 3.364963 2.721709
Iraq 1.019601 1.317312 1.173017 Egypt Egypt
Israel 4.487161 4.152959 2.537411 Iran Iran Iran Jordan 4.545133 4.240894 1.564242 Israel Israel Israel Lebanon 4.913593 4.240236 1.956086 Jordan Jordan Lebanon Malta 4.958192 4.691771 2.4798 Lebanon Lebanon Malta Morocco 4.253182 3.630694 1.6798 Malta Malta Tunisia Palestine 3.209784 3.127658 1.240927 Morocco Morocco Turkey Syria 3.837318 2.241324 0.8459081 Tunisia Tunisia
Tunisia 4.24037 4.026381 2.286178 Turkey Turkey Turkey 4.66627 3.443014 3.372612
Yemen 2.813941 1.700788 1.23657
in a country. The value of this index varies from 0 for very high risk to 100 for very low risk. Then we replace the Political Risk Index by indices of Government Stability, Law and Order, and Democratic Accountability to bet‑ ter assess which of these components is effec‑ tive in transmitting the effect of remittances to economic growth.
Considering our variables of interest, we note that all the interaction terms are positive and significant (exception for democratic account‑ ability). The coefficients of remittances are negative, meaning that a higher level of insti‑ tutional quality could eliminate the negative effect of remittances on economic growth. Remittances and institutional quality are complements in enhancing growth. Thus, the strength and impartiality of the legal system, popular observance of the law, the govern‑ ment’s ability to carry out its declared pro‑ grams, and its ability to stay in office send a positive sign to recipient households, which may correct the asymmetry of information and promote growth. This implies that, in MENA countries, the economic performance is pos‑ itively correlated with the quality of institu‑ tions. Based on these results, Table 5 compares this calculated threshold with the level of the
institutional quality in each country of the sample. As we can see, out of 14 countries con‑ sidered in the analysis, only Iraq and Lebanon do not have the robust and resilient institu‑ tional system required to benefit from remit‑ tances. Figure II shows the marginal effect of remittances on growth based on each country’s Institutions quality index value. As we can see, remittances may have a negative effect on economic growth. However, the institutions of the country of origin can moderate this effect. First, a legal and regulatory system involving protection of property rights, contract enforce‑ ment, and good accounting practices has been identified as essential for financial develop‑ ment (Huang, 2010). A solid financial system in the country of origin increases migrants’ confidence in the banking system, and money will be sent through banks. In the country of origin, remittances tend to reduce the liquidity constraints of the financial system, allowing to finance other projects stimulating econo mic growth.
Policy implications are of different orders. First, remittances might become a substitute for inefficient or non‑existent credit markets, providing local entrepreneurs with an alterna‑ tive source of credit, and helping bypass the Figure I
Marginal Effect of Remittances on Economic Growth Based on Each Country’s Findvp Index Value
-0.3 -0.2 -0.1 0 0.1 0.2 0.3
DZA EGY IRN IRQ ISR JOR LBN MLT MAR SYR TUN PSE YEM TUR
Model 2 Model 3 Model 4 Sources: See Table A‑1 in Appendix; author's calculations.
Table 4
Growth, Remittances and Institutional Quality (Annual Data)
Independent variables
Dependent variable: GDP per capita growth (Annual data)
Model 5 Model 6 Model 7 Model 8
OLS 2SLS OLS 2SLS OLS 2SLS OLS 2SLS
GDP per capita (initial) (0.0909)‑0.161* ‑1.983***(0.804) (0.0879)‑0.105 ‑1.478***(0.669) (0.0926)‑0.120 ‑1.304***(0.488) (0.0886)‑0.132 ‑1.320***(0.490) Investment 1.639* 4.642*** 1.648* 5.057*** 1.363 4.738*** 1.601* 5.780*** (0.896) (1.618) (0.897) (1.531) (0.883) (1.593) (0.883) (1.598) Inflation ‑0.0116 ‑0.0270* ‑0.0113 ‑0.0290* ‑0.00760 ‑0.0272* ‑0.0133 ‑0.0288* (0.00942) (0.0154) (0.00945) (0.0164) (0.00957) (0.0153) (0.00973) (0.0160) Trade Openness (0.614)0.276 (1.418)0.854 (0.578)0.508 (1.434)0.880 (0.584)0.162 (1.449)0.830 (0.590)0.246 (1.520)1.037 Population Growth ‑2.092***(0.621) ‑2.836***(0.611) ‑1.410**(0.574) ‑3.033***(0.602) ‑1.785***(0.603) ‑2.582***(0.656) ‑1.513***(0.561) ‑3.219***(0.575) Government spending ‑2.133**(0.911) (1.723)‑2.611 ‑1.746*(0.906) ‑3.365**(1.695) ‑1.707*(0.936) ‑2.943*(1.696) ‑2.028**(0.931) ‑3.353**(1.699) Human capital 0.841 ‑5.893*** 0.125 ‑5.661*** 1.137 ‑5.313*** 0.436 ‑5.606*** (1.279) (1.991) (1.419) (1.936) (1.351) (1.824) (1.355) (2.031) Remittances (REM) ‑0.588**(0.239) ‑0.6821**(0.075) (0.071)‑0.220 (0.024)‑0322* ‑0.410**(0.014) ‑0.428**(0.045) (0.216)‑0.296 (0.340)0.570 Political Risk Index (0.0246)‑0.0175 0.0520**(0.0351) REM * Pol. Risk
Index 0.218**(0.090) 0.0124**(0.0137)
Law and Order ‑0.0327 0.0725* (0.192) (0.280) REM *
Law and Order (0.0999)0.0974 0.0981**(0.144) Government Stability (0.117)0.180 (0.130)0.245* REM * Gov. Stability (0.0548)0.098* (0.0113)0.0569* Democratic Accountability (0.170)0.163 ‑0.0399(0.244) REM * Demo. Account. (0.0890)0.00991 (0.105)‑0.105 Constant 1.907* 1.133 ‑2.149 1.423 (7.653) (7.998) (7.681) (7.896) Observations 316 310 313 310 313 310 313 310 R‑squared 0.246 0.659 0.252 0.242 Kleibergen
Paap test stat. 0.365 1.863 1.654 1.761 P‑value
Overidentit. 0.311 0.728 0.292 0.342 Number of id 13 13 13 13 13 13 13 13 * p<0.05, ** p<0.01, *** p<0.001. Standard errors in parentheses; significance is calculated using Stata’s robust procedure.
Note: Data from Institutional Quality Database are not available for Palestine. Sources: See Table A‑1 in Appendix; author's calculations.
Figure II
Marginal Effect of Remittances on Growth Based on Each Country’s Institutions Quality Index Value
-0.3 -0.2 -0.1 0 0.1 0.2 0.3 0.4
DZA EGY IRN IRQ ISR JOR LBN MLT MAR SYR TUN YEM TUR
Political Risk Index Low and Order Government Stability
Note: Data from Institutional Quality Database are not available for Palestine. Sources: See Table A‑1 in Appendix; author's calculations.
Table 5
Institutional Quality’s Threshold (Annual Data)
Mean by component
Model 5 Model 6 Model 7 β1 β2 β1 β2 β1 β2
‑0.6821 0.0124 ‑0.322 0.0981 ‑0.428 0.0569 Political Risk
Index and OrderLaw Government Stability Threshold
Algeria 54.2 2.5 8.2 54.7871 3.2824 7.5220 Egypt 57.0 3.3 8.1 Countries satisfying the threshold by model Iran 53.8 3.6 7.1
Iraq 34.7 1.6 6.5 Egypt Egypt Algeria Israel 59.0 4.2 6.7 Israel Jordan Egypt Jordan 63.0 3.6 8.5 Jordan Israel Jordan Lebanon 47.6 3.2 6.6 Malta Malta Malta Malta 78.3 4.6 8.2 Morocco Morocco Morocco Morocco 63.5 4.4 8.8 Turkey Turkey Turkey Syria 46.1 5.4 8.5 Yemen Yemen Tunisia Tunisia 65.7 4.1 8.8 Tunisia Tunisia
Turkey 59.2 3.7 7.7 Yemen 51.9 2.4 8.6
Note: Data from Institutional Quality Database are not available for Palestine. Sources: See Table A‑1 in Appendix; author’s calculations based on Table 3.
lack of collateral or high lending costs to start productive activities (Giuliano & Ruiz‑Arranz, 2009). Second, a higher level of institutions quality (enforcement of contracts, property rights, absence of corruption), might reassure the migrants regarding the situation of their home country, possibly leading to virtuous cir‑ cles of migrants increasing their transfers to invest, innovate and take part in the economic activity, and recipient families further moti‑ vated to invest in physical and human capital.
* * *
In the last two decades, remittances reached the highest level in history and the receiving coun‑ tries realized their importance. However, despite the growing literature, economists and research‑ ers do not have a clear consensus regarding their impact on economic growth. Indeed, since many channels exist, it is challenging to establish the direction of relationship between migrants’ transfers and economic growth. In this paper, we were interested in the role of financial sector and institutions quality as channels from which
remittances may affect growth. Thus, we use, respectively, three and four indexes of finan‑ cial development and institutions quality. Our Two‑Stage Least Squares estimations show that high level of financial development and a strong institutional environment are required to enable remittances to enhance growth, independently of the measure of financial development and insti‑ tutions quality used. However, our data have several limitations. First, we could not find an indicator taking into account the complex mul‑ tidimensional nature of financial development. In other words, there is no composite measure that would encompass simultaneously the size, depth and efficiency of financial institutions. Second, the frequency and availability of data on institutions quality within the time horizon of the study vary between countries, making international comparisons difficult. Third, we did not include informal remittances and in‑kind transfers, which may affect our estimations. Finally, within these limits, a policy implication for MENA countries could be that it is important not only attract more remittances inflows, but also to should provide more incentives for the‑ ses inflows to be spent in productive investments contributing to economic growth.
BIBLIOGRAPHY
Alam, M. R., Kitenge, E. & Bedane, B. (2017).
Government Effectiveness and Economic Growth.
Economics Bulletin, 37(1), 222–227.
https://ideas.repec.org/a/ebl/ecbull/eb‑16‑00708.html
Amuedo‑Dorantes, C. & Mazzolari, F. (2010). Remit‑
tances to Latin America from migrants in the United States: Assessing the impact of amnesty programs.
Journal of Development Economics, 91(2), 323–335.
http://doi.org/10.1016/j.jdeveco.2009.06.006
Ang, A. (2009). Workers’ remittances and its impact
on rural development in the Philippines. Asia‑Pacific
Social Science Review, 9(2), 63–77.
http://doi.org/10.3860/apssr.v9i2.1462
Arellano, M. & Bond, S. (1991). Some Tests of
Specification for Panel Data: Monte Carlo Evidence and an Application to Employment Equations. The
Review of Economic Studies, 58(2), 277–297.
http://doi.org/10.2307/2297968
Ayana Aga, G. & Martinez Peria, M. S. (2014).
International Remittances and Financial Inclusion in Sub‑Saharan Africa. World Bank, Policy Research
Working Paper N° 6991.
http://hdl.handle.net/10986/19383
Barajas, A. & Chami, R. (2009). Do Workers’
Remittances Promote Economic Growth? IMF Wor‑
king Papers N° 09.
https://www.imf.org/en/Publications/WP/Issues/2016/ 12/31/Do‑Workers‑Remittances‑Promote‑Economic‑ Growth‑23108
Barro, R. J. (1991). Economic Growth in a Cross
Section of Countries. The Quarterly Journal of Eco‑
nomics, 106(2), 407.
http://doi.org/10.2307/2937943
Barro, R. J. & Sala‑I‑Martin, X. (2003). Economic Growth : Second Edition. Cambridge, Massachu‑
setts: The MIT Press.
Barro, R. J. (1996). Determinants of economic
growth: a cross‑country empirical study. NBER Wor‑
king Paper 5698.
http://doi.org/10.3386/w5698
Bekaert, G., Harvey, C. R. & Lundblad, C. (2006).
Growth volatility and financial liberalization. Journal
of International Money and Finance, 25(3), 370–403.
http://doi.org/10.1016/j.jimonfin.2006.01.003
Bettin, G. & Zazzaro, A. (2012). Remittances and
financial development: Substitutes or complements
Abdih, Y., Chami, R., Dagher, J. & Montiel, P. (2012). Remittances and Institutions: Are Remit‑
tances a Curse? World Development, 40(4), 657–666. http://doi.org/10.1016/j.worlddev.2011.09.014
Acosta, P. A., Lartey, E. K. K. & Mandelman, F. S. (2009). Remittances and the Dutch disease. Journal of International Economics, 79(1), 102–116.
http://doi.org/10.1016/j.jinteco.2009.06.007
Acosta, P. A., Baerg, N. R. & Mandelman, F. S. (2009). Financial Development, Remittances, and
Real Exchange Rate Appreciation. Federal Reserve
Bank of Atlanta Economic Review, 94(1), 14.
http://hdl.handle.net/10419/57669
Adams, R. H., Jr. (2003). International Migration,
Remittances, and the Brain Drain: A Study of 24 Labor‑ Exporting Countries. World Bank, Policy Research
Working Paper N° 3069.
https://openknowledge.worldbank.org/handle/ 10986/18161
Adams, R. H., Jr. & Cuecuecha, A. (2013). The
Impact of Remittances on Investment and Poverty in Ghana. World Development, 50, 24–40.
http://doi.org/10.1016/j.worlddev.2013.04.009
Adams, S. & Klobodu, E. K. M. (2016). Remit‑
tances, regime durability and economic growth in Sub‑Saharan Africa (SSA). Economic Analysis and
Policy, 50, 1–8.
http://doi.org/10.1016/j.eap.2016.01.002
Agostino, G. d’, Dunne, J. P. & Pieroni, L. (2016).
Corruption and growth in Africa. European Journal
of Political Economy, 43, 71–88.
http://doi.org/10.1016/j.ejpoleco.2016.03.002
Ahamada, I. & Coulibaly, D. (2013). Remittances
and growth in sub‑saharan african countries: Evi‑ dence from a panel causality test. Journal of Interna‑
tional Development, 25(3), 310–324.
http://doi.org/10.1002/jid.2830
Aitymbetov, S. (2006). Emigrant remittances:
impact on economic development of Kyrgyzstan. ICEG European Center, Working Paper N° 31. http://pdc.ceu.hu/archive/00003286/01/emigrant_ remittances.pdf
Akobeng, E. (2016). Out of inequality and poverty:
Evidence for the effectiveness of remittances in Sub‑Saharan Africa. The Quarterly Review of Eco‑
nomics and Finance, 60, 207–223.
in economic growth? Bulletin of Economic Research, 64(4), 509–536.
http://doi.org/10.1111/j.1467‑8586.2011.00398.x
Blundell, R. & Bond, S. (1998). Initial conditions
and moment restrictions in dynamic panel data models. Journal of Econometrics, 87(1), 115–143. https://doi.org/10.1016/S0304‑4076(98)00009‑8
Bollen, K. A. (1995). Structural Equation Models That
are Nonlinear in Latent Variables: A Least‑Squares Estimator. Sociological Methodology, 25, 223–251. https://www.jstor.org/stable/271068
Bourdet, Y. & Falck, H. (2006). Emigrants’ remit‑
tances and Dutch Disease in Cape Verde. Internatio‑
nal Economic Journal, 20(3), 267–284.
http://doi.org/10.1080/10168730600879323
Burgess, R. & Haksar, V. (2005). Migration and
Foreign Remittances in the Philippines. IMF Wor‑
king Papers 2005/111, 1–18.
http://doi.org/10.5089/9781451861303.001
Calero, C., Bedi, A. S. & Sparrow, R. (2009).
Remittances, Liquidity Constraints and Human Capital Investments in Ecuador. World Development, 37(6), 1143–1154.
http://doi.org/10.1016/j.worlddev.2008.10.006
Catrinescu, N., Leon‑Ledesma, M., Piracha, M. & Quillin, B. (2009). Remittances, Institutions, and Eco‑
nomic Growth. World Development, 37(2139), 81–92. http://doi.org/10.1016/j.worlddev.2008.02.004
Chami, R., Fullenkamp, C. & Jahjah, S. (2005). Are
Immigrant Remittances Flows a Source of Capital for Development. IMF Working Papers 03/189, 55–81. http://www.imf.org/external/pubs/cat/longres. aspx?sk=16801
Combes, J.‑L. & Ebeke, C. (2011). Remittances and
Household Consumption Instability in Developing Countries. World Development, 39(7), 1076–1089. http://doi.org/10.1016/j.worlddev.2010.10.006
Edwards, A. C. & Ureta, M. (2003). International
migration, remittances, and schooling: Evidence from El Salvador. Journal of Development Econo‑
mics, 72(2), 429–461.
http://doi.org/10.1016/S0304‑3878(03)00115‑9
El Qorchi, M., Munzele, M. S. & Wilson, J. F. (2003). Informal Funds Transfer Systems: An Analy‑
sis of the Informal Hawala System. IMF Occasional
Paper N° 222.
https://econpapers.repec.org/RePEc:imf:imfocp:222
El Hamma, I. (2017). Do political institutions
improve the effect of remittances on economic
growth? Evidence South‑Mediterranean countries.
Economics Bulletin, 37(3), 2133–2148.
https://econpapers.repec.org/RePEc:ebl:ecbull: eb‑17‑00318
Fayissa, B. & Nsiah, C. (2012). Financial Develop‑
ment and Remittances in Africa and the Americas: A Panel Unit‑Root Tests and Panel Cointegration Ana‑ lysis. Middle Tennessee State University, Department
of Economics and Finance, Working Papers 201201.
http://ideas.repec.org/p/mts/wpaper/201201.html
Fölster, S. & Henrekson, M. (2001). Growth
effects of government expenditure and taxation in rich countries. European Economic Review, 45(8), 1501–1520.
http://doi.org/10.1016/S0014‑2921(00)00083‑0
Giuliano, P. & Ruiz‑Arranz, M. (2009). Remit‑
tances, financial development, and growth. Journal
of Development Economics, 90(1), 144–152.
https://doi.org/10.1016/j.jdeveco.2008.10.005
Glytsos, N. P. (2005). The contribution of remit‑
tances to growth: A dynamic approach and empi‑ rical analysis. Journal of Economic Studies, 32(6), 468–496.
http://doi.org/10.1108/01443580510631379
Gubert, F. (2002). Do Migrants Insure Those who
Stay Behind? Evidence from the Kayes Area (Wes‑ tern Mali). Oxford Development Studies, 30(3), 267–287.
http://doi.org/10.1080/1360081022000012699
Guillaumont Jeanneney, S. & Kpodar, K. (2006).
Développement financier, instabilité financière et croissance économique. Economie & prévision, 174(3), 87–111.
http://www.cairn.info/resume.php?ID_ARTICLE =ECOP_174_0087
Huang, C.‑J. (2016). Is corruption bad for economic
growth? Evidence from Asia‑Pacific countries. The
North American Journal of Economics and Finance,
35, 247–256.
http://doi.org/10.1016/j.najef.2015.10.013
Imai, K. S., Gaiha, R., Ali, A. & Kaicker, N. (2014). Remittances, growth and poverty: New evi‑
dence from Asian countries. Journal of Policy Mode‑
ling, 36(3), 524–538.
http://doi.org/10.1016/j.jpolmod.2014.01.009
Jongwanich, J. (2007). Workers’ Remittances, Eco‑
nomic Growth and Poverty in Developing Asia and the Pacific Countries. United Nation, UNESCAP
Working Paper N° WP/07/01.
https://books.google.com/books?id=xMq7GS‑ 6MTMC&pgis=1
Khan, Z. S. & Islam, S. (2013). The Effects of
Remittances on Inflation: Evidence from Bangla‑ desh. Journal of Economics and Business Research, 19(2), 198–208.
http://www.uav.ro/jour/index.php/jebr/article/view/94
Lucas, R. E. B. (2005). International Migration and Economic Development: Lessons from Low‑Income Countries. Cheltenham, UK and Northampton, MA,
USA: Edward Elgar.
https://books.google.com/books?id=5LrJk6KUIwYC &pgis=1
Majeed, M. T. (2015). Poverty Effects of Remit‑
tances: A Comparative Analysis. Journal of Interna‑
tional Development, 27(1), 1–14.
http://doi.org/10.1002/jid.3055
Mundaca, B. G. (2009). Remittances, Financial
Market Development, and Economic Growth: The Case of Latin America and the Caribbean. Review of
Development Economics, 13(2), 288–303.
http://doi.org/10.1111/j.1467‑9361.2008.00487.x
Nyamongo, E. M., Misati, R. N., Kipyegon, L. & Ndirangu, L. (2012). Remittances, financial deve‑
lopment and economic growth in Africa. Journal of
Economics and Business, 64(3), 240–260.
http://doi.org/10.1016/j.jeconbus.2012.01.001
Pesaran, M. H. (2007). A simple panel unit root test
in the presence of cross‑section dependence. Journal
of Applied Econometrics, 22(2), 265–312.
http://doi.org/10.1002/jae.951
Rapoport, H. & Docquier, F. (2005). The Econo‑
mics of Migrants’ Remittances. In: M. Ythier & S. Kolm (Eds.). Handbook on the Economics of Giving,
Reciprocity and Altruism, pp. 1135–1198. Amster‑
dam, London: North Holland.
https://doi.org/10.1016/S1574‑0714(06)02017‑3
Singh, R. J., Haacker, M., Lee, K. W. & Le Goff, M. (2011). Determinants and Macroeconomic
Impact of Remittances in Sub‑Saharan Africa. Jour‑
nal of African Economies, 20(2), 312–340.
http://doi.org/10.1093/jae/ejq039
Woodruff, C. & Zenteno, R. (2007). Migration
networks and microenterprises in Mexico. Journal of
Development Economics, 82(2), 509–528.
http://doi.org/10.1016/j.jdeveco.2006.03.006
World Bank (2016). Migration and Development Brief 23. Washington, DC: World Bank.
http://pubdocs.worldbank.org/pubdocs/public‑ doc/2015/10/848611444756854924/Migrationand‑ DevelopmentBrief23.pdf
World Bank (2018). Migration and Development Brief 29. Washington, DC: World Bank.
http://www.knomad.org/publication/migration‑ and‑development‑brief‑29
Ziesemer, T. H. W. (2012). Worker remittances,
migration, accumulation and growth in poor develo‑ ping countries: Survey and analysis of direct and indi‑ rect effects. Economic Modelling, 29(2), 103–118. http://doi.org/10.1016/j.econmod.2011.08.013
APPENDIX ____________________________________________________________________________________________
Figure A‑I
Personal remittances, received (% of GDP) in 2017
1980 1990 2000 2010 2020 1980 1990 2000 2010 2020 1980 1990 2000 2010 2020 1980 1990 2000 2010 2020 1980 1990 2000 2010 2020 1980 1990 2000 2010 2020 1980 1990 2000 2010 2020 1980 1990 2000 2010 2020 1980 1990 2000 2010 2020 1980 1990 2000 2010 2020 1980 1990 2000 2010 2020 1980 1990 2000 2010 2020 1980 1990 2000 2010 2020 1980 1990 2000 2010 2020 Time Personal re mittances re ceived (% of GDP)
Algeria Egypt Iran Iraq
Israel Jordan Lebanon Malta
Morocco Palestine Syria Tunisia
Turkey Yemen -5 05 -5 05 -5 05 -5 05
Table A‑1
Sources Used for the Variables
Indicator Source
GDP per capita growth
(annual %) World Bank national accounts data, and OECD National Accounts data files. 1982‑2016 GDP growth (annual %) World Bank national accounts data, and OECD National Accounts data files. 1982‑2016 GDP per capita (current US$) World Bank national accounts data, and OECD National Accounts data files. 1982‑2016 Population growth
(annual %) Derived from total population. Population source: (1) United Nations Popula‑tion Division. World Population Prospects: 2017 Revision, (2) Census reports and other statistical publications from national statistical offices, (3) Eurostat: Demographic Statistics, (4) United Nations Statistical Division. Population and Vital Statistics Reprot (various years), (5) U.S. Census Bureau: Interna‑ tional Database, and (6) Secretariat of the Pacific Community: Statistics and Demography Programme.
1982‑2016
GDP per capita
(constant LCU) World Bank national accounts data, and OECD National Accounts data files. 1982‑2016 Personal remittances, received
(% of GDP) World Bank staff estimates based on IMF balance of payments data, and World Bank and OECD GDP estimates. 1982‑2016 Inflation, GDP deflator
(annual %) World Bank national accounts data, and OECD National Accounts data files. 1982‑2016 Trade (% of GDP) World Bank national accounts data, and OECD National Accounts data files. 1982‑2016 Gross fixed capital formation
(% of GDP) World Bank national accounts data, and OECD National Accounts data files. 1982‑2016 Age dependency ratio
(% of working‑age population) World Bank staff estimates based on age distributions of United Nations Population Division's World Population Prospects: 2017 Revision. 1982‑2016 General government final consumption expen‑
diture (% of GDP)
World Bank national accounts data, and OECD National Accounts data files. 1982‑2016 Domestic credit provided by financial sector
(% of GDP) International Monetary Fund, International Financial Statistics and data files, and World Bank and OECD GDP estimates. 1982‑2016 Domestic credit to private sector
(% of GDP) International Monetary Fund, International Financial Statistics and data files, and World Bank and OECD GDP estimates. 1982‑2016 Domestic credit to private sector by banks
(% of GDP) International Monetary Fund, International Financial Statistics and data files, and World Bank and OECD GDP estimates. 1982‑2016 Broad money
(% of GDP) International Monetary Fund, International Financial Statistics and data files, and World Bank and OECD GDP estimates. 1982‑2016 Political Risk Index International Country Risk: The PRS Group 1984‑2013 Low and Order International Country Risk: The PRS Group 1984‑2013 Government Stability International Country Risk: The PRS Group 1984‑2013 Democratic Accountability International Country Risk: The PRS Group 1984‑2013
Table A‑2
Summary Statistics
Variables Mean Std. Dev. Min. Max. N
GDP per capita growth
(annual %) 1.8 7.7 ‑64.9 53.9 417 GDP growth
(annual %) 4.2 7.8 ‑64.1 57.8 417 Personal remittances, received
(% of GDP) 6.078 6.7 0.0 26.6 375 GDP per capita
(constant LCU) 5,885,703.6 17,384,328.7 890.7 84,729,064 420 Gross fixed capital formation
(% of GDP) 23.5 6.1 1.7 42.1 396 Population growth
(annual %) 2.2 1.2 ‑3.1 7.1 441
Human capital
(Gross enrollment ratio) 71.7 19.1 39.4 119.1 442 Inflation, GDP deflator
(annual %) 15.9 37.8 ‑26.8 396.4 417 Trade
(% of GDP) 79.4 51.9 0.0 326.1 413 Government final consumption expenditure
(% of GDP) 17.1 5.5 2.3 35.8 413 Domestic credit to private sector by banks
(% of GDP) 40.7 27.6 1.2 124.4 370 Domestic credit provided by financial sector
(% of GDP) 68.4 42.2 ‑16.3 207.3 363 Claims on private sector
(A. growth as % of broad money) 11.5 21.7 ‑75.9 307.7 358 Broad money
(% of GDP) 74.9 44.2 20.2 249.5 359 Political Risk Index 57.6 15.1 18 88 238 Low and Order 24.9 28.2 1 75 383 Government Stability 6.2 2.6 1 11 383 Democratic Accountability 5.4 2.9 0 12 383 Sources: See Table A‑1; author’s calculations.