HAL Id: hal-01232182
https://hal.sorbonne-universite.fr/hal-01232182
Submitted on 8 Feb 2016HAL is a multi-disciplinary open access archive for the deposit and dissemination of sci-entific research documents, whether they are pub-lished or not. The documents may come from teaching and research institutions in France or abroad, or from public or private research centers.
L’archive ouverte pluridisciplinaire HAL, est destinée au dépôt et à la diffusion de documents scientifiques de niveau recherche, publiés ou non, émanant des établissements d’enseignement et de recherche français ou étrangers, des laboratoires publics ou privés.
Impedance analysis of the distributed resistivity of
coatings in dry and wet conditions
Anh Son Nguyen, Marco Musiani, Mark E. Orazem, Nadine Pébère, Bernard
Tribollet, Vincent Vivier
To cite this version:
Anh Son Nguyen, Marco Musiani, Mark E. Orazem, Nadine Pébère, Bernard Tribollet, et al.. Impedance analysis of the distributed resistivity of coatings in dry and wet conditions. Electrochimica Acta, Elsevier, 2015, 179, pp.452-459. �10.1016/j.electacta.2015.02.109�. �hal-01232182�
1
Impedance analysis of the distributed resistivity of coatings in dry and wet conditions
Anh Son Nguyena, Marco Musianib, Mark E. Orazemc, Nadine Pébèrea,*, Bernard Tribolletd, Vincent Vivierd
a Université de Toulouse, CIRIMAT, UPS/INPT/CNRS, ENSIACET, 31030 Toulouse cedex 4,
France
b Istituto per l’Energetica e le Interfasi, CNR, Corso Stati Uniti 4, 35127 Padova, Italy
c Department of Chemical Engineering, University of Florida, Gainesville, Florida 32611, USA
d LISE CNRS, Université Pierre et Marie Curie, 75252, Paris cedex 05, France
* Corresponding author. Phone: 00 33 5 34 32 34 23 Fax: 00 33 5 34 32 34 99
2
Abstract
A commercial coating (epoxy-polyaminoamide waterborne paint) deposited on a 2024 aluminium alloy was characterized by impedance measurements, first in dry conditions and then as a function of the immersion time in NaCl solutions (wet conditions). The behaviour of the dry coating was close to that of an ideal capacitor and could be accurately modelled with the power-law model corresponding to a constant phase element (CPE) behaviour. Upon immersion in NaCl solutions, the behaviour of the wet coating became progressively less ideal, i.e. farther from a capacitive behaviour. This result provided support to the hypothesis that an inhomogeneous uptake of the electrolyte solution was the cause of the often observed non-ideal responses of wet coatings. The experimental EIS data recorded for immersion times up to 504 hours were compared with models assuming either a power-law or an exponential variation of the coating resistivity along its thickness, respectively implying a phase angle independent of frequency or slightly dependent on it.
Keywords: aluminium alloy; corrosion protection; constant phase element (CPE); Young
3
1. Introduction
In two recent papers [1, 2] our group has proposed that the CPE behaviour observed in the impedance of metal/coating/electrolyte systems was the result of power-law dependences of the coating resistivity (ρ) and permittivity (ε) along their thickness. In turn, the resistivity and permittivity variations were attributed to an inhomogeneous uptake of electrolytic solution into the coating, stronger in proximity of the coating/electrolyte interface and progressively weaker along the coating thickness as the metal/coating interface was approached. Accordingly, local resistivity and permittivity were calculated as a function of the local electrolyte volume fraction, using effective-medium formulas corresponding to parallel combinations of coating material and electrolyte. The proposed model, henceforth called “power-law model”, took into account both through pores, directly connecting the metal/coating and coating/electrolyte interfaces via low-resistivity paths, and pores less deep than the coating thickness. In related previous work [3,4], it had been shown that the variation of the local permittivity, by a factor of 10 to 100 at most, had a negligible effect, and so the CPE behaviour could be entirely ascribed to a power-law resistivity profile. The power-law model was used to analyse experimental data obtained with hybrid sol-gel coatings deposited onto a 2024 aluminium alloy and exposed to electrolytic solutions [1]. It was shown that an inaccurate knowledge of the resistivity of the coating material ρc did not affect the quality of the agreement between model and experimental data, nor the values of the regressed parameters, as long as ρc was large [2]. Instead, the lack of an accurate knowledge of the resistivity of the electrolyte (ρw) within the coating pores, which could not be assumed to be identical to that of the bulk electrolyte, prevented the calculation of accurate water uptake values from the resistivity profiles [2].
A strong implicit assumption underlying the use of the power-law model, previously developed [3,4] and applied to films of various chemical natures [5,6], in the analysis of the impedance of
anti-4
corrosion coatings was that the non-ideally capacitive behaviour was the result of the uptake of the electrolytic solution, not of a pre-existing variation of resistivity along the film thickness. Heterogeneities in the pristine coating morphology, e.g. some nano-scale porosity, were not excluded. However, as long as the coating was not exposed to a solution, the air-filled pores had no effect on the conductivity. Only the ingress of an electrolytic solution could produce conductive domains and reveal a structural inhomogeneity, as well as induce the formation of additional defects or the increase of their size. The primary aim of this work has been testing this hypothesis by measuring the impedance of the same coating under dry and wet conditions, i.e. in the metal/coating/metal configuration, and then in the commonly used metal/coating/electrolyte configuration, the latter for increasing immersion times. The coating chosen to perform the experiments was a two-component water-based anticorrosive primer containing several pigments, known to provide an effective anti-corrosion protection to the 2024 aluminium alloy [7]. The dry coating properties (εc and ρc) were first determined by impedance spectroscopy. Then, the impedance evolution upon immersion of coated samples in either 0.5 M or 0.05 M NaCl solutions was followed.
There is no a priori physical reason why the electrolytic solution uptake must lead to a resistivity profile accurately described by a power law, which would cause a strictly constant phase angle. Therefore, an exponential variation of the coating permittivity along its thickness was considered as a possible alternative, when a CPE did not account for the observed behaviour. Such an exponential dependence results in the well-known Young impedance [8] characterized by a phase angle slightly dependent on frequency [9].
The present study is part of a wider program aimed at developing and characterizing chromate-free coatings for 2024 aluminium alloy. Studies on the same epoxy-polyaminoamide waterborne paint, without chromates, are in progress and investigations on coatings containing environmentally friendly inhibitors are planned.
5
2. Experimental
The coating samples used and the impedance measurement protocol are presented in this section.
2.1. The coating samples
The coating was a two-component water-based paint used as an anticorrosive primer. The base was a polyaminoamide (Versamid® type) and the hardener was a bisphenol A epoxy polymer. The coatings were manufactured by Mapaero SAS. Different pigments were added to the organic matrix: titanium oxide (12 wt. %), talc (11 wt. %), silica (1 wt. %) and strontium chromate (16 wt. %). The ratio of the pigment volume concentration (PVC) to critical pigment volume concentration (CPVC) was equal to 0.61. The CPVC is the pigment concentration at which there is just enough binder in the dry coating to completely fill all the voids between the pigment particles [10, 11]. In fact the CPVC to CPV ratio is an important parameter which controls the film barrier properties. The coatings were deposited onto a 2024 T3 aluminium alloy currently used in the aerospace industry. The chemical composition in weight percent of the alloy was: Cu: 4.90; Mg: 1.31; Mn: 0.56; Si: 0.08; Fe: 0.26; Zn: 0.10; Ti: 0.01 and Al to balance. The specimens consisted of 125 mm × 80 mm × 1.6 mm plates machined from a rolled plate. Before painting, the samples were degreased at 60°C (pH = 9) for 15 min, rinsed twice with distilled water, then etched in an acid bath at 52 °C for 10 min, and rinsed again with distilled water. The liquid paints were applied by air spraying and cured at room temperature. The coatings were 20-21 µm thick.
2.2. Electrochemical impedance measurements
For the dry coating, a two-electrode configuration was used. A cylindrical Plexiglass tube was fixed on top of the coated sample, exposing a surface area of 5.94 cm2. The well was filled with mercury (1 cm height) and the electric contact was done with a copper wire. Impedance measurements were performed with a Solartron 1255 Frequency Response Analyzer connected with a 1296 Dielectric
6
Interface. Impedance diagrams were obtained at a dc potential of 0 V over a frequency range of 1 Hz to 105 Hz with 10 points per decade and using a 100 mV peak-to-peak sinusoidal voltage. For the impedance measurements in the conventional metal/coating/electrolyte configuration, a classical three-electrode cell was used in which the coated specimen served as the working electrode. A cylindrical Plexiglas tube was fixed on top of the coated sample, exposing a surface area of 24 cm², and filled with either 0.5 M or 0.05 M NaCl solutions. A saturated calomel electrode and a large platinum sheet were used as reference and counter electrode, respectively. The electrochemical cell was open to air and was kept at room temperature with an average value of 17°C which may have undergone fluctuations by ±2°C. Electrochemical impedance measurements were carried out using a Biologic VSP apparatus. The impedance diagrams were obtained, for exposure times ranging from 2 to 504 h, under potentiostatic conditions, at the corrosion potential, over a frequency range of 65 kHz to 100 mHz with 8 points per decade, using a 30 mV peak-to-peak sinusoidal voltage perturbation. The results shown for a single coating were typical of other nominally identical coatings; statistical analysis was not performed. To confirm consistency with the Kramers-Kronig relations, the measurement model analysis described by Agarwal et al. [12-14] was used. Typically data obtained at frequencies greater than 10 mHz were found to satisfy the Kramers-Kronig relations.
The impedance data analysis was performed using a non-commercial software developed at the LISE CNRS, Paris, which allows the comparison of the experimental diagrams with those calculated using a combination of passive circuit elements and analytical expressions.
3. Results and Discussion
3.1. Analysis of the impedance data for the dry coating
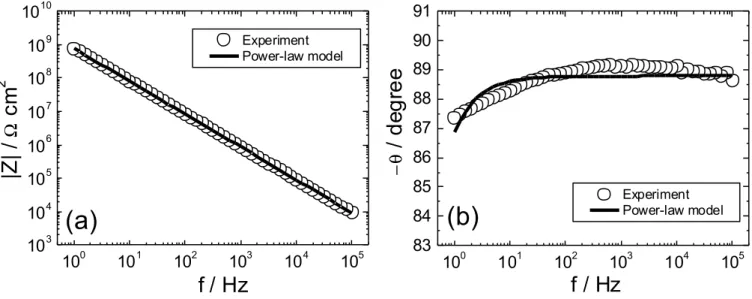
The experimental impedance diagram (Bode coordinates) obtained for the dry coating is presented in Fig. 1. The diagram is characterized by a single time constant attributed to the dielectric
7
properties of the coating, and is very close to an ideal capacitive behaviour. If the experimental data obtained in the 1-105 Hz frequency range are analysed in terms of a parallel combination of coating resistance (Rc) and capacitance (Cc), the best fitted Rc and Cc values are 1.07 x 10¹⁰ Ω cm2 and 1.90
× 10-10 F cm-2, and the coating permittivity, calculated as
A d Cc c 0 ε ε = (1)
is εc = 4.52. However, these Cc and εc values are not fully reliable. Indeed, inspection of the phase
angle (θ) plot shows that θ was lower than 90°, the value expected for an ideally capacitive response, and varied slightly, between 87 and 89° in a wide frequency range. Therefore, to determine these physical quantities, the power-law model, known to correspond to a CPE behaviour, was regressed to the impedance data, using the following formula [3]
α α δ ε ωε ρ δρ ω ) ( ) ( 0 1 ) 1 ( c c j g Z + = − − (2)
where
ρ
δ is the coating resistivity at the coating/solution interface and g is a numerical coefficient that has a value very close to 1 when α is close to 1 [3]. The best-fitted curve, shown as a continuous line in Fig. 1, provides a good agreement between model and data. The expanded phase angle scale in Fig. 1b emphasizes the minor discrepancy. The regression procedure provided numerical values of the adjustable parameters α, εc, ρc and ρδ, reported in Table 1. The resistivityprofile in the dry coating, shown in Fig. 2, was calculated according to [3]
1 1 − ⎥ ⎦ ⎤ ⎢ ⎣ ⎡ ⎟⎟⎠ ⎞ ⎜⎜⎝ ⎛ − + = δ δ γ δ ξ ρ ρ ρ ρ ρ ρ c c (3)
using the ρc and ρδ values in Table 1 and the power-law exponent γ calculated from the CPE
exponent α [3] as
α
γ
− = 1 1 (4)8
In equation (3), ξ = x/δ is the dimensionless position along the coating thickness, measured from the metal/coating interface. In Figure 2, it can be seen that, throughout most of the coating thickness, the resistivity has a constant value of 1.0 × 10¹³ Ω cm, henceforth used as ρ
c value, i.e. as
resistivity of the dry coating material. In a thin layer of the coating, ca. 1 µm thick, next to the coating/mercury interface, the resistivity decreases approximately by a factor of 10. This decrease could be due to a variation of the coating properties in its outermost part or to some penetration of mercury in the defects and irregularities of the coating surface which were observed by SEM. The fitted resistivity value of the dry coating, ρc = 1.0 × 10¹³ Ω cm, was much higher than that assumed in our [1, 2] and other studies [15], ρc = 2 × 10¹¹ Ω cm, and well above the threshold value at which its incorrect estimate becomes unimportant [2]. The coating capacity, calculated according to Eq. (1), was 2.05 × 10⁻¹⁰ F cm-2, 7.8 % larger than the value obtained by modelling the coating with a Rc//Cc parallel combination, and the dielectric constant was 4.87, slightly larger than the value
obtained by a Rc//Cc parallel combination. Table 2 summarizes the resistance, capacity and
permittivity values obtained by analysing the impedance response of the dry coating in terms of an
Rc//Cc parallel combination or with the power-law model. In the latter case, the coating resistance is
given by the real low frequency limit of the impedance [3]. The similar values obtained with the two methods shows that the dry coating behaves almost as an ideal capacitor.
3.2. Evolution of the coating behaviour upon immersion in the electrolyte
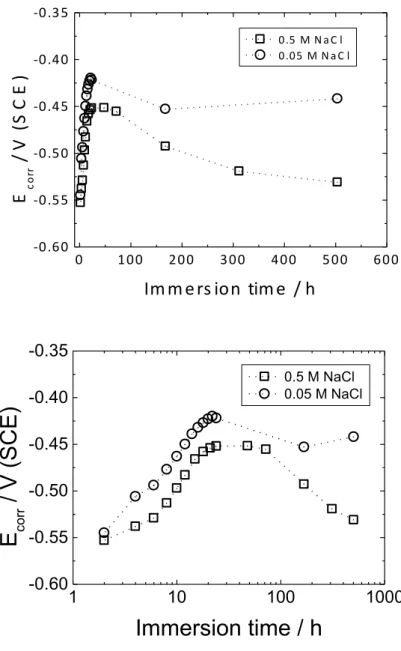
Fig. 3 shows the variation of the corrosion potential (Ecorr) of coated samples as a function of the
immersion time in either 0.5 M or 0.05 M NaCl solution, between 2 and 504 h. At immersion times shorter than 2 h, Ecorr undergoes rapid, uncontrolled variations and cannot be accurately measured
due to the high resistivity of the coating, i.e. due to the absence of a direct contact between metal and electrolyte penetrated through the coating. After 2 h, Ecorr became measurable, and almost
identical for both NaCl solutions. From 2 to 20 h, Ecorr progressively shifted towards positive values
9
slowly declined until the end of the test, to reach a significantly lower value in the more concentrated NaCl solution. The behaviour shown in Fig. 3 may be rationalized as follows: (i) At the beginning of immersion, the coating is free from through pores that would allow an immediate contact between metal and electrolytic solution. (ii), the water penetrates fast into the coating and a metal/solution contact is established after ca. 2 h, but Na+ and Cl– ions do not diffuse at the same rate [16-22]; therefore, the ions content at the metal/coating interface is due to strontium chromate incorporated in the coating. (iii) From 2 to 24 h, Ecorr increases due to the oxidizing effect of
chromates. (iv) Around 24 h, significant amounts of Na+ or Cl- ions start to reach the metal and E
corr
stops increasing because the Cl– ions interfere with the passivating action of chromates. (v) From 80 h onwards, Ecorr undergoes a progressive decrease, more pronounced in the more concentrated NaCl
solution. The effect of NaCl concentration on Ecorr becomes stronger at longer immersion times,
when larger quantities of Cl– ions have reached the metal/coating interface. Independent measurements carried out with bare 2024 T3 aluminium alloy samples showed well-defined stable
Ecorr values soon after exposure; after 2 h immersion, Ecorr was -0.63 V/SCE and -0.52 V/SCE in 0.5
M and 0.05 M NaCl, respectively, in qualitative agreement with the Ecorr differences observed in
Fig. 3, for long immersion times. The Ecorr values are significantly more positive for coated
samples, after long immersion, than for bare ones.
The impedance of the coated sample was measured after various immersion times, from 2 to 504 h, in 0.5 M and 0.05 M NaCl solutions. The complete Bode plots are presented and discussed in the following section. We focus here on the evolution of the phase angle, measured in the high frequency range (100 Hz-65 kHz), with the immersion time, shown in Fig. 4a, for the 0.5 M NaCl solution. Two facts are evident: (i) θ is not rigorously constant but becomes slightly smaller for decreasing frequency, i.e. a strict CPE behaviour is not observed; (ii) the θ vs. frequency curves are progressively displaced towards lower θ values as the immersion time increases. Point (i) is discussed in the following section. Fig. 4b presents a plot of θ, measured at an arbitrary frequency
10
of 1 kHz, as a function of the immersion time, and includes a data relevant to the dry coating, for zero immersion time. This phase angle monotonically decreases from 89° to 78° upon prolonging the immersion, with only minor differences between the two NaCl solutions. The decrease of θ with increasing immersion times proves that the progressive departure from a quasi-ideally capacitive response is caused by the ingress of the electrolytic solution in the coating, inducing a distribution of its properties along its thickness.
3.3. Analysis of the impedance data for the wet coating
In this section, impedance plots are presented and discussed, starting from the longer immersion times (≥ 48 h). Taking into account that the impedance diagrams undergo progressive, monotonic variations, as anticipated in the previous section, the data obtained at immersion times of 2 to 24 h, are then analysed by adopting a model that combines the features of the dry coating and those of the wet coating after long immersion.
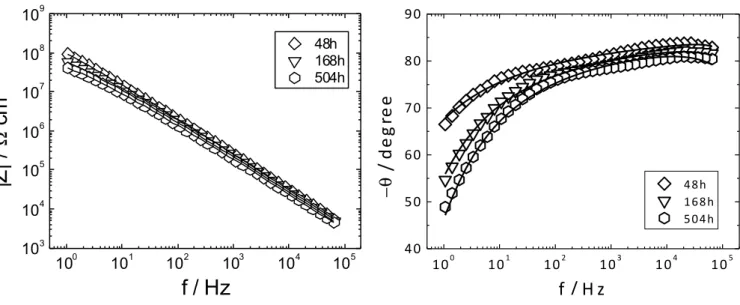
Fig. 5 presents the impedance diagrams (Bode coordinates) obtained with the coated samples for immersion times varying from 48 to 504 h. As mentioned above, no real CPE behaviour is observed and therefore the analysis of the experimental data with the power-law model cannot yield a satisfactory agreement. Therefore, the data were compared with the Young impedance [8], which may be written ⎟⎟⎠ ⎞ ⎜⎜⎝ ⎛ + + − = − 0 0 / 0 0 0 1 1 ln ρ ε ωε ρ ε ωε ε ωε λ δ λ w w w j e j j Z (5)
and is known to correspond to an exponential variation of the coating resistivity along its thickness, i.e.: ) exp( ) ( 0 λ ρ ρ x = −x (6)
In both equations (5) and (6), εw and ρ0 respectively denotethe permittivity of the coating under
11
not to εc and ρc, respectively, and the parameter λ indicates how sharply the resistivity changes with
position (a larger λ corresponds to a smoother resistivity profile).
By regressing equation (5) to the experimental data, the values of the adjustable parameters λ, εw, ρ0
were obtained. They are reported in Table 3, together with ρδ values calculated as:
0exp( )
λ δ ρ
ρδ = − (7)
The good quality of the agreement between data and model is shown by Fig. 5, where the best fitted curves are shown as continuous lines. Inspection of Table 3 shows that (i) λ remains fairly constant, around 1.5 × 10⁻⁴ cm; (ii) the permittivity of the wet coating (εw) is about twice larger than
that of the dry coating for 48 h of immersion, and increases when the immersion is prolonged; (iii) at 48 h immersion time, ρ0 is close to, but somewhat lower than ρc, then it progressively decreases;
(iv) the ρδ values are ca. 6 orders of magnitude lower than the ρ0 values, at each immersion time.
Fig. 6 presents the impedance diagrams (Bode coordinates) obtained with the coated samples for immersion times varying from 2 to 24 h. Taking into account the resistivity profile of the dry coating (Fig. 2), as well as the fitted ρ0 and ρδ values at 48 h immersion time and later (Table 3), it is
hypothesized that for shorter times (2-24 h) the coating consists of two regions: an inner region, next to the metal/coating interface, where the resistivity is that of the dry coating, and an outer region where the resistivity varies exponentially with x. The permittivity is assumed to be identical in both inner and outer layers, and independent of position. This hypothesis implies water to be uniformly distributed along the coating thickness and the ions to be not. Assuming a uniform water distribution is probably just a rough approximation. However, it has been shown that a moderate dependence of permittivity on position has negligible effects on impedance [3].
Two-layer models were already considered by several authors [19, 23-25]. In the present study, the inner/outer layer distinction exists from the point of view of resistivity because Na+ and Cl– ions are supposed to be present in the outer layer but not in the inner layer. Due to their penetration, the inner layer progressively disappears. The model for intermediate immersion times (2-24 h), is
12
sketched in Fig. 7. Since the resistivity at x ≤ d (where d represents the thickness of the inner part of the coating) is assumed identical to ρc (i.e. 1.0 × 10¹³ Ω cm), the impedance of the system is given
by ⎟⎟⎠ ⎞ ⎜⎜⎝ ⎛ + + − + = − − c w d c w w c w c j e j j j d Z ρ ε ωε ρ ε ωε ε ωε λ ρ ε ωε ρ δ λ 0 / ) ( 0 0 0 1 1 ln ) 1 ( (8)
where the first and second terms on the right hand side are the impedances of the inner and outer layers respectively, connected in series.
By regressing equation (8) to the experimental data, the values reported in Table 4 were obtained for the adjustable parameters λ, εw, d. The same table also reports ρδ values, calculated according to
Eq. (7). The number of adjustable parameters is the same as for the longer immersion times (Eq. 5), since the resistivity at x = d needs not to be adjusted. The good quality of the agreement between data and model sketched in Fig. 7 is shown by Fig. 6, where the best fitted curves are shown as continuous lines. It is to note that if Eq. (5) were used to regress the 2-24 h impedance data instead of Eq. (8) the best fitted value of ρ0 would be much higher than ρc, which has no physical meaning.
Inspection of Table 4 show the following trends. (i) The λ values increase with immersion time and are smaller than, but of the same order as, those measured at immersion times ≥ 48 h. (ii) The permittivity of the coating εw after 2 h immersion is already significantly larger than that of the dry
coating; then it increases slightly with immersion time. (iii) The thickness of the inner, more resistive part of the coating, decreases as immersion time increases, and becomes almost completely negligible at 24 h (it must be pointed out that the experimental data obtained at 24 h immersion time may be equally well fitted with both short-immersion and long-immersion models); (iv) ρδ values undergo minor variations when the immersion time increases. There is a substantial continuity in the variation of the parameters that appear in both Tables 3 and 4, i.e. λ, εw and ρδ , with the
13
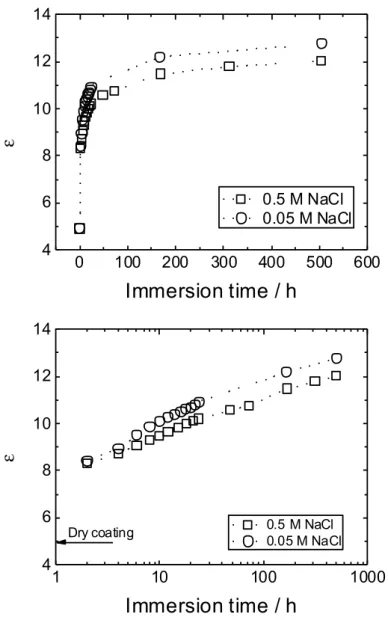
Fig. 8 shows the dependence of the coating permittivity on immersion time. The observed trends are similar for both NaCl concentrations. However, in agreement with previous authors [16, 22], Fig. 8 shows that permittivity is higher in 0.05 M than in 0.5 M NaCl. This result may suggest that water uptake is higher in the less concentrated NaCl solution, but may also reflect the decrease in the permittivity of NaCl solution with increasing concentration [26-28]. The estimation of the water partial volume from permittivity, by using a linear combination formula, should be ca. 4.5% at 2 h and ca. 9.7% at 504 h. Such a water uptake would probably cause swelling of the coating but, this effect was neglected.
The fitted parameters in Tables 3 and 4 were used to calculate the resistivity profiles shown in Fig. 9a. The resistivity was calculated according to
⎪⎩ ⎪ ⎨ ⎧ ⎟ ⎠ ⎞ ⎜ ⎝ ⎛− − = < < = ≤ < λ ρ ρ δ ρ ρ ) ( exp ) ( ) ( 0 d x x x d x d x c c (9)
for immersion times of 2 to 24 h, and according to Eq. (6), for immersion times of 48 to 504 h. Fig. 9b shows a comparison of the resistivity profiles for the two NaCl concentrations, after 2 and 504 h. Minor differences are observed and both sets of profiles suggest the same physical phenomena: - As described in section 3.1, the dry coating has essentially homogeneous properties along its thickness, with a moderate variation of resistivity only in the outermost, ca. 1 µm thick layer. Therefore, its impedance is close to that of an ideal capacitor, although the power-law model accounts for the observed behaviour more effectively.
- Upon immersion in the electrolyte, the coating starts to uptake water and, more slowly, ions. Its resistivity in the region close to the coating/solution interface significantly drops in a short time. The solution uptake overrides the initially existing power-law profile of the resistivity, and causes the development of a much more pronounced exponential profile (six orders of magnitude instead
14
of one). The evolution of the impedance response (e.g., Fig. 4b) reveals the increasing spatial heterogeneity of the coating properties.
- Already after 2 h, the coating permittivity becomes much higher than that of the dry coating, suggesting that water uptake is extensive over the whole coating thickness, in agreement with the fact that, at such immersion time, Ecorr becomes measurable. However, during the first 24 h, an
inner layer of the coating, as resistive as the dry coating, coexists with an outer layer with a lower, position-dependent resistivity, because the thickness of the layer affected by Na+ and Cl– penetration is not as large as the whole coating thickness. Then, between 24 and 48 h the Na+ and Cl– ions reach the metal/coating interface and the thickness of the inner layer becomes zero. In the same period of time, the corrosion potential stops increasing and starts to move slowly in the negative direction. Penetration of ions is faster when the coating is exposed to the more concentrated NaCl solution, as observed in Fig. 9b: for the same time, d is larger and the resistivity is higher when NaCl concentration is lower.
- At immersion times ≥ 48 h, a further water uptake is indicated by the minor increase in permittivity, and a more marked ion penetration by the continuous decrease of resistivity, at all positions and notably at the metal/coating interface.
- Even after 504 h immersion ρ0 is close to 1012 Ω cm2, a value apt to ensure good corrosion
protection.
The evolution of both impedance and Ecorr with immersion time provides a coherent picture of the
phenomena occurring upon penetration of water and ions into the coating material. Since this picture is not the same as that proposed in our previous papers [1,2], some differences deserve a comment.
There are major differences in experimental systems, which have a strong impact on the results. The coatings studied in [1] and [2] did not contain any pigment, while the ones described in the present paper are heavily loaded with inorganic fillers and pigments. These chemicals markedly enhance the coating impedance. Due to the better barrier properties of the pigmented coatings, the analysis
15
of their impedance does not require considering a finite resistance of through pores, in parallel with the coating impedance, at variance with [1,2]. Since the thicknesses and the capacities of the different coatings are of the same order, the response of the pigmented coatings is dominated by their capacity over a much larger frequency range, where the analysis of the frequency dependence of the phase angle allows recognizing even a minor departure from a strict CPE behaviour. This, in turn, allows the assessment of relative merits of models based on either power-law or exponential dependences of the resistivity on the position along the coating thickness. However, power-law and exponential ρ(x)-x dependences must be considered only as simple mathematical descriptions of physical situations which, in practice, may be manifold and more complicated.
Both Ecorr and impedance data in this work suggest that penetration of water and ions occurs on
different time scales. The former process is faster and affects permittivity more strongly than resistivity; the latter is slower and affects almost exclusively resistivity. Such a decoupling of the effects of water and ionic penetration does not allow the calculation of local resistivity and permittivity, using similar effective medium formulas, based on the local partial volume of solution within the coating, as proposed in [1], and in previous work by others [10]. In the model proposed in [1], the resistivity profile was the result of a variation, along the x axis, of the partial volume of a solution containing ions at a (not known) concentration independent of x. In the present paper, the resistivity profile is discussed as the result of a position-dependent concentration of ions in the water present within the coating at a partial volume assumed independent of x. Again, the physical situation may involve distribution of both water partial volume (within the coating) and ion concentrations (within the water) along the thickness.
4. Conclusions
The impedance of pigmented coatings deposited onto 2024 T3 aluminium alloy was studied under dry and wet conditions. In the former configuration, the outer coating surface was put in contact
16
with mercury, in the latter with NaCl solutions. The dry coating behaviour was close to that of a capacitor and did not reveal a significant dependence of the coating resistivity on the position along its thickness, except for some variation in the outermost, ca. 1 µm thick layer. The behaviour of wet coatings progressively departed from the quasi-ideally capacitive response, proving that penetration of water and ions caused the development of a resistivity profile much more marked than that observed with the dry coatings. The frequency dependence of the phase angle suggested the resistivity-position dependence to be closer to an exponential than to a power-law relationship. Impedance and corrosion potential vs. immersion time data converged to suggest that water penetration occurred on a shorter time scale than ionic penetration. The resistivity profile was therefore ascribed mainly to a gradient of the local ion concentration in the water penetrated within the coating.
Acknowledgments
The authors gratefully acknowledge the company MAPAERO (Pamiers, France) for the preparation of the coated samples and more particularly Pauline Côte and Pierre-Jean Lathière for fruitful discussion on coating technologies. The PhD thesis of Nguyen Anh Son is prepared in the framework of the associated international laboratory “Functional Composite Materials (FOCOMAT)” between France and Vietnam.
References
[1] S. Amand, M. Musiani, M. Orazem, N. Pébère, B. Tribollet, V. Vivier, Constant-Phase-Element Behavior Caused by Inhomogeneous Water Uptake in Anti-Corrosion Coatings, Electrochim. Acta 87 (2013) 693-700.
[2] M. Musiani, M. Orazem, N. Pébère, B. Tribollet, V. Vivier, Determination of Resistivity Profiles in Anti-Corrosion Coatings from Constant-Phase-Element Parameters, Prog. Org. Coat. 77 (2014) 2076-2083.
[3] B. Hirschorn, M. E. Orazem, B. Tribollet, V. Vivier, I. Frateur, M. Musiani, Constant-Phase-Element Behavior Caused by Resistivity Distributions in Films: 1. Theory, J. Electrochem. Soc. 157 (2010) C452-C457.
17
[4] M. Musiani, M. Orazem, N. Pébère, B. Tribollet, V. Vivier, Constant-Phase-Element Behavior Caused by Coupled Resistivity and Permittivity Distributions in Films, J. Electrochem. Soc. 158 (2011) C424-C428.
[5] B. Hirschorn, M. E. Orazem, B. Tribollet, V. Vivier, I. Frateur, M. Musiani, Constant-Phase-Element Behavior Caused by Resistivity Distributions in Films: 2. Applications, J. Electrochem. Soc. 157 (2010) C458-C463.
[6] M. E. Orazem, I. Frateur, B. Tribollet, V. Vivier, S. Marcelin, N. Pébère, A. L. Bunge, E. A. White, D. P. Riemer, M. Musiani, Dielectric Properties of Materials showing Constant-Phase-Element (CPE) Impedance Response, J. Electrochem. Soc. 160 (2013) C215-C225.
[7] C. Le Pen, C. Lacabanne, N. Pébère, Characterisation of water-based coatings by electrochemical impedance spectroscopy, Prog. Org. Coat. 46 (2003) 77-83.
[8] L. Young, Anodic oxide films, Academic Press, New York, 1961.
[9] C.A. Schiller, W. Strunz, The evaluation of experimental dielectric data of barrier coatings by means of different models, Electrochim. Acta 46 (2001) 3619-3625.
[10] W.K. Asbeck, M.V. Loo, Critical pigment volume relationships, Industrial and Engineering Chemistry 41 (7) (1949) 1470-1475.
[11] G.P. Bierwagen, CPVC (critical pigment volume concentration) calculations, J. Paint Technol. 44 (1972) 46-55.
[12] P. Agarwal, M. E. Orazem, and L. H. García-Rubio, Measurement Models for Electrochemical Impedance Spectroscopy: 1. Demonstration of Applicability, J. Electrochem. Soc., 139 (1992), 1917-1927.
[13] P. Agarwal, Oscar D. Crisalle, M. E. Orazem, and L. H. García-Rubio, Application of Measurement Models to Electrochemical Impedance Spectroscopy: 2. Determination of the Stochastic Contribution to the Error Structure, J. Electrochem. Soc., 142 (1995), 4149-4158. [14] P. Agarwal, M. E. Orazem, and L. H. García-Rubio, Application of Measurement Models to Electrochemical Impedance Spectroscopy: 3. Evaluation of Consistency with the Kramers-Kronig Relations, J. Electrochem. Soc., 142 (1995), 4159-4168.
[15] O.A. Stafford, B.R. Hinderliter, S.G. Croll, Electrochemical impedance spectroscopy response of water uptake in organic coatings by finite element methods, Electrochim. Acta 52 (2006) 1339. [16] H. Leidheiser Jr, D.J. Mills, W.Bilder, The permeability of polybutadiene coating to ions, water and oxygen, in: M.W. Kendig and H. Leidheiser Jr. (Eds.) Corrosion protection by organic coatings, Vol. 87-2, The Electrochemical Society Inc., Pennington, 1987, p. 23-36.
[17] J.R. Scully, Electrochemical impedance of organic-coated steel: correlation of impedance parameters with long-term coating deterioration, J. Electrochem. Soc. 136 (1989) 979-989.
[18] B.N. Popov, M.A. Alwahaibi, R.E. White, Using electrochemical impedance spectroscopy as a tool for organic coating solute saturation monitoring, J. Electrochem. Soc. 140 (1993) 947-951.
18
[19] V.B. Mišković-Stanković, D.M. Dražić, M.J. Teodorović, Electrolyte penetration through epoxy coatings electrodeposited on steel, Corros. Sci. 37 (1995) 241-252.
[20] V.B. Mišković-Stanković, D.M. Dražić, Z. Kačarević-Popović, The sorption characteristics of epoxy coatings electrodeposited on steel during exposure to different corrosive agents, Corros. Sci 38 (1996) 1513-1523.
[21] J.M. Hu, J.Q. Zhang, C.N. Cao, Determination of water uptake and diffusion of Cl– ion in epoxy primer on aluminum alloys in NaCl solution by electrochemical impedance spectroscopy, Prog. Org. Coat. 46 (2003) 273-279.
[22] Q. Zhou, Y. Wang, Comparison of clear coating degradation in NaCl solution and pure water, Prog. Org. Coat. 76 (2013) 1674-1682.
[23] U. Rammelt, G. Reinhard, Application of electrochemical impedance spectroscopy (EIS) for characterizing the corrosion-protective performance of organic coatings on metals, Prog. Org. Coat. 21 (1992) 205-226.
[24] B.R. Hinderliter, S.G. Croll, D.E. Tallman, Q. Su, G.P. Bierwagen, Interpretation of EIS data from accelerated exposure of coated metals based on modeling of coating physical properties, Electrochim. Acta 51 (2006) 4505-4515.
[25] G. Bouvet, D.D. Nguyen, S. Mallarino, S. Touzain, Analysis of the non-ideal capacitive behaviour for high impedance organic coatings, Prog. Org. Coat. 77 (2014) 2045-2053.
[26] W. Ellison, A. Balana, G. Delbos, K. Lamkaouchi, L. Eymard, C. Guillou, C. Prigent, New permittivity measurements of seawater. Radio Sci. 33 (1998) 639-648.
[27] X. Yang, K. Huang, The empirical formula for calculating the complex effective permittivity of an aqueous electrolyte solution at microwave frequency, IEEE Trans.. Geosci. Remote Sens. 43 (2003) 315-320.
[28] A. Peyman, C. Gabriel, E.H. Grant, Complex permittivity of sodium chloride solutions at microwave frequencies, Bioelectromagnetics 28 (2007) 264-274.
19
Table 1. Best-fitted values of the adjustable parameters in equation (2) obtained by regressing the power-law model to experimental data for the dry coating.
α εc ρc (Ω cm) ρδ (Ω cm) 0.987 4.87 1.0 x 10¹³ 1.1 x 10¹²
Table 2. Resistance, capacity and permittivity values obtained by analysing of the impedance response of the dry coating in terms of Rc/Cc parallel combination or with the power-law model
α Rc (Ω cm2) Zf (0) a (Ω cm2) Cc (F cm-2) εc Rc // Cc 1 1.07 x 10¹⁰ - 1.90 x 10⁻¹⁰ 4.52 Power-law model 0.987 - 2.04 x 10¹⁰ 2.05 x 10⁻¹⁰ 4.87
a: Zf (0) is calculated as: γ γ γ δ ρ δρ 01 ) 1 ( ) 0 ( = g −
Zf with g =1+2.88γ−2.375and
γ
given by Eq. (4)
20
Table 3. Dependence of the fitted parameters on the immersion time in a 0.5 M NaCl solution (long immersion times – resistivity profiles described by the Young model)
Time (h) λ (cm) εw ρ0 (Ω cm) ρδ a (Ω cm) 48 1.41 x 10⁻⁴ 10.6 7.07 x 10¹² 2.47 x 10⁶ 168 1.52 x 10⁻⁴ 11.5 1.26 x 10¹² 1.29 x 10⁶ 504 1.52 x 10⁻⁴ 12.2 5.67 x 10¹¹ 5.67 x 10⁵
a: Calculated according to Eq. (7).
Table 4. Dependence of the fitted parameters on the immersion time in a 0.5 M NaCl solution (short immersion times: Inner region where the resistivity is that of the dry coating + outer region
described by the Young model) Time (h) λ (cm) εw d (µm) ρδ a (Ω cm) 2 0.87 x 10⁻⁴ 8.3 8.3 4.59 x 10⁶ 10 1.23 x 10⁻⁴ 9.5 3.0 4.35 x 10⁶ 24 1.37 x 10⁻⁴ 10.2 0.6 3.44 x 10⁶
21
Figure captions
Fig. 1: Plots of the impedance modulus (a) and phase angle (b) as a function of frequency obtained for the dry coating (21 µm thick). The experimental data (o) are compared with the regression result with the power-law model, Eq. (2).
Fig. 2: Resistivity vs. coating thickness calculated according to Eq. (3) for the dry coating.
Fig. 3. Corrosion potential (Ecorr) versus immersion time for the coated AA2024 samples in two
NaCl solutions (concentrations are indicated on the figure).
Fig. 4. Phase angle (high frequency range) of the impedance for the AA2024 coated sample in a 0.5 M NaCl solution (a) and θ values measured at 1 kHz versus immersion time for two NaCl solutions (concentrations are indicated on the figure) (b).
Fig. 5. Impedance diagrams for the AA2024 coated sample obtained after 48, 168 and 504 h immersion in 0.5 M NaCl solution (as indicated on the figure). The solid lines are the best fitted curves calculated according to Eq. (5).
Fig. 6: Impedance diagrams for the AA2024 coated sample obtained after 2, 10 and 24 h immersion in 0.5 M NaCl solution (as indicated on the figure). Solid lines show the fitting results obtained from Eq. (8).
Fig. 7: Schematic representation of the two-layer model. The coating is assumed to consist of an inner layer with uniform resistivity ρ = ρc and an outer layer with an exponential dependence of
resistivity on position.
Fig. 8: Dependence of the wet coating permittivity on immersion time in the NaCl solutions (indicated on the figure).
Fig. 9: (a) Variation of the coating resistivity profiles according to the immersion time in a 0.5 M NaCl solution and (b) comparison of the coating resistivity profiles in the two NaCl concentrations at 2 h and 504 h of immersion.
1 Fig. 1: Plots of the impedance modulus (a) and phase angle (b) as a function of frequency obtained for the dry coating (21 µm thick). The experimental data (o) are compared with the regression result with the power-law model, Eq. (2). -4 0 4 8 12 16 20 24 1011 1012 1013 1014
Me
rc
ur
y
Me
ta
l
ρ
/
Ω
c
m
C oating thic knes s / µm
C oa ting
Fig. 2: Resistivity vs. coating thickness calculated according to Eq. (3) for the dry coating. 100 101 102 103 104 105 83 84 85 86 87 88 89 90 91 Experiment Power-law model −θ/
d
eg
re
e
f / Hz
(b)
100 101 102 103 104 105 103 104 105 106 107 108 109 1010 Experiment Power-law model|Z
| /
Ωc
m
2f / Hz
(a)
2 1 10 100 1000 -0.60 -0.55 -0.50 -0.45 -0.40 -0.35 0.5 M NaCl 0.05 M NaCl
E
co rr/ V
(SCE
)
Immersion time / h
Fig. 3. Corrosion potential (Ecorr) versus immersion time for the coated AA2024 samples in two NaCl
solutions (concentrations are indicated on the figure). 0 100 200 300 400 500 600 -0.60 -0.55 -0.50 -0.45 -0.40 -0.35 0.5 M N a C l 0.05 M N a C l E co rr / V ( S C E ) Immers ion time / h
3 0 100 200 300 400 500 600 75 80 85 90
−θ
/ degre
e
Immersion time / h
0.5M NaCl 0.05 M NaCl (b) 1 10 100 1000 75 80 85 90−θ
/ degre
e
Immersion time / h
0.5M NaCl 0.05 M NaCl (b) Dry coating Fig. 4. Phase angle (high frequency range) of the impedance for the AA2024 coated sample in a 0.5 M NaCl solution (a) and θ values measured at 1 kHz versus immersion time for two NaCl solutions (concentrations are indicated on the figure) (b). 102 103 104 105 70 75 80 85 90 2h 10h 24h 48h 168h 504h −θ / d e g re e f / H z D ry c oating (a)4 Fig. 5. Impedance diagrams for the AA2024 coated sample obtained after 48, 168 and 504 h immersion in 0.5 M NaCl solution (as indicated on the figure). The solid lines are the best fitted curves calculated according to Eq. (5). Fig. 6: Impedance diagrams for the AA2024 coated sample obtained after 2, 10 and 24 h immersion in 0.5 M NaCl solution (as indicated on the figure). Solid lines show the fitting results obtained from Eq. (8). 100 101 102 103 104 105 103 104 105 106 107 108 109 48h 168h 504h
|Z
| /
Ωc
m
2f / Hz
100 101 102 103 104 105 40 50 60 70 80 90 48h 168h 504h −θ / d e g re e f / H z 100 101 102 103 104 105 103 104 105 106 107 108 109 2h 10h 24h|Z
| /
Ωc
m
2f / Hz
100 101 102 103 104 105 40 50 60 70 80 90 2h 10h 24h −θ / d eg re e f / H z5 Fig. 7: Schematic representation of the two-layer model. The coating is assumed to consist of an inner layer with uniform resistivity ρ = ρc and an outer layer with an exponential dependence of resistivity on position.
6 0 100 200 300 400 500 600 4 6 8 10 12 14 0.5 M NaCl 0.05 M NaCl ε
Immersion time / h
1 10 100 1000 4 6 8 10 12 14 0.5 M NaCl 0.05 M NaCl εImmersion time / h
Dry coating Fig. 8: Dependence of the wet coating permittivity on immersion time in the NaCl solutions indicated on the figure7 Fig. 9: (a) Variation of the coating resistivity profiles according to the immersion time in a 0.5 M NaCl solution and (b) comparison of the coating resistivity profiles in the two NaCl concentrations at 2 h and 504 h of immersion 0 5 10 15 20 105 106 107 108 109 1010 1011 1012 1013 1014 2h 10h 24h 48h 168h 504h
C oa ting thic knes s / µm
Dry c oating (a ) 0 5 10 15 20 105 106 107 108 109 1010 1011 1012 1013 1014 Me ta l 2h - 0.05 M 504h - 0.05 M 2h - 0.5 M 504h - 0.5 M ρ / Ω c m
C oa ting thic knes s / µm
(b)
So
lu
tio


![Risiko- & [und] Schutzfaktoren der psychischen Gesundheit humanitärer Einsatzhelfer : eine systematische Literaturübersicht](data:image/gif;base64,R0lGODlhAQABAIAAAP///wAAACH5BAEAAAAALAAAAAABAAEAAAICRAEAOw==)