Publisher’s version / Version de l'éditeur:
Vous avez des questions? Nous pouvons vous aider. Pour communiquer directement avec un auteur, consultez la
première page de la revue dans laquelle son article a été publié afin de trouver ses coordonnées. Si vous n’arrivez pas à les repérer, communiquez avec nous à [email protected].
Questions? Contact the NRC Publications Archive team at
[email protected]. If you wish to email the authors directly, please see the first page of the publication for their contact information.
https://publications-cnrc.canada.ca/fra/droits
L’accès à ce site Web et l’utilisation de son contenu sont assujettis aux conditions présentées dans le site LISEZ CES CONDITIONS ATTENTIVEMENT AVANT D’UTILISER CE SITE WEB.
Research Report (National Research Council of Canada. Institute for Research in
Construction), 2002-11-01
READ THESE TERMS AND CONDITIONS CAREFULLY BEFORE USING THIS WEBSITE. https://nrc-publications.canada.ca/eng/copyright
NRC Publications Archive Record / Notice des Archives des publications du CNRC : https://nrc-publications.canada.ca/eng/view/object/?id=a787a1de-f355-4c52-91a4-4512cc33c5f6 https://publications-cnrc.canada.ca/fra/voir/objet/?id=a787a1de-f355-4c52-91a4-4512cc33c5f6
NRC Publications Archive
Archives des publications du CNRC
For the publisher’s version, please access the DOI link below./ Pour consulter la version de l’éditeur, utilisez le lien DOI ci-dessous.
https://doi.org/10.4224/20386357
Access and use of this website and the material on it are subject to the Terms and Conditions set forth at
FIERAsystem Theory Report: Economic Model
FIERAsystem Theory Report: Economic Model
Bénichou, N.; Kashef, A.; Yager, B.; Hum, J.;
Hadjisophocleous, G
IRC-RR-122
November 2002
FIERAsystem Theory Report: Economic Model
Noureddine Benichou, Ahmed Kashef, Brent Yager, Joe Hum and George Hadjisophocleous
Research Report # 122
November 2002
Fire Risk Management Program Institute for Research in Construction National Research Council Canada
Table of Contents
TABLE OF CONTENTS... I LIST OF FIGURES... I LIST OF TABLES... I NOMENCLATURE... II 1. INTRODUCTION... 1 2. MODEL INPUTS... 3 2.1 BUILDING GEOMETRY... 3 2.2 BUILDING COMPONENTS... 3 2.3 CONTENT COMPONENTS... 52.4 FIRE PROTECTION SYSTEMS... 5
2.5 FIRE CONDITIONS... 6
3. METHODOLOGY... 7
4. SAMPLE RESULTS... 11
5. REFERENCES... 15
List of Figures Figure 1 -- Economic model sample input screenshot... 3
Figure 2 -- Probability of damage as compartment temperature increases... 8
Figure 3 -- Economic model flowchart... 10
Figure 4 – Economic model sample results screenshot... 14
List of Tables Table 1 -- Sample building geometry (Input)... 11
Table 2 -- Sample building categories (Input)... 11
Table 3 -- Sample contents categories (Input)... 12
Table 4 -- Sample fire protection systems (Input)... 13
Table 5 -- Sample fire conditions (Input)... 13
ii
Nomenclature
VT Total building value ($)
VFP Value of fire protection systems ($)
VB Value of building components ($)
VC Value of contents ($)
CT Total cost of damages in the case of a fire ($)
CB Cost of damage to building ($)
CC Cost of damage to contents ($)
PdT Probability object damaged by high temperature
PdW Probability object damaged by water
PdS Probability object damaged by smoke
T(t) Temperature at the object’s location
W(t) Water density at the object’s location
S(t) Smoke concentration at the object’s location
TL Lower temperature threshold
TU Upper temperature threshold
WL Lower water density threshold
WU Upper water density threshold
SL Lower smoke concentration threshold
1. INTRODUCTION
As Canada and other countries move from prescriptive-based building codes to performance/objective-based codes, new design tools are needed to demonstrate that compliance with these new codes has been achieved. One such tool is the computer model FiRECAM™, which has been developed over the past decade by the Fire Risk Management Program of the Institute for Research in Construction at the National Research Council of Canada (NRC). FiRECAM™ is a computer model for evaluating fire protection systems in residential and office buildings that can be used to compare the expected safety and cost of candidate fire protection options.
To evaluate fire protection systems in light industrial buildings, a new computer model is being developed. This model, whose current focus is aircraft hangars and warehouses, is based on a framework that allows designers to establish objectives, select fire scenarios that may occur in the building and evaluate the impact of each of the selected scenarios on life safety, property protection and business interruption. The new computer model is called FIERAsystem, which stands for Fire Evaluation and Risk Assessment system.
FIERAsystem uses time-dependent deterministic and probabilistic models to evaluate the impact of selected fire scenarios on life, property and business interruption. The main FIERAsystem submodels calculate fire development, smoke movement through a building, time of failure of building elements and occupant response and evacuation. In addition, there are submodels dealing with the effectiveness of fire suppression systems and the response of fire departments.
The Economic model is one of the sub-models of the Fire Risk Management Program’s Fire Risk Assessment model for light industrial buildings. The model was developed to calculate the cost of building construction, building contents, fire protection systems and property damage in the event of a fire. The Economic model calculates, using inputs provided by the users, the following building and content’s costs and fire losses: Ø Capital cost of building construction
Ø Capital cost of building contents Ø Capital cost of fire protection systems
Ø Annual cost of fire protection systems’ maintenance and associated activities Ø Cost of building and contents damage during a fire
The Economic model was developed so that a variety of construction materials, contents and fire protection systems can be used in the calculation of the total building value and the costs of damages. It was designed to follow commonly-used practices for
estimating the cost of construction projects [1, 2] so that these estimates can be applied as inputs to the model. Although the user is provided with a sample set of building
components, contents and fire protection system types, this set can be easily changed and customized by the user. The model has been designed to be an integrated component of FIERAsystem so that it can be used to provide the data necessary to calculate the probable cost of property damage in risk and hazard analyses.
This report describes the Economic model of FIERAsystem, which considers the capital costs associated with the construction of the building, the cost for the installation of
2
fire protection systems, as well the cost of the building contents. In addition, the model considers the annual maintenance and other costs associated with fire protection systems. Based on these costs and the results from the fire development and Smoke Movement models of the FIERAsystem, it computes the expected losses from fires in buildings. The fire losses considered are due to heat, smoke and water damage and they depend on threshold values for these damages provided by the users. The report describes the methodology used, the inputs required and presents sample outputs of the calculations.
2. MODEL INPUTS
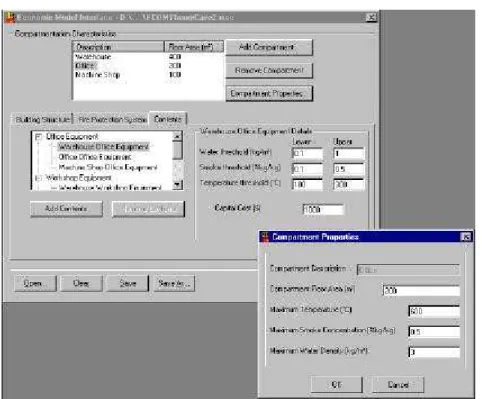
The following is a description of the inputs required for the model to complete its calculations. The inputs have been broken down into the following groups: building geometry; building components; contents components; fire protection system; and fire conditions (Figure 1).
The fire protection systems include active and passive fire protection systems such as: sprinkler system; detection system; fire stopping; increased fire resistance; alarm system; fire safety plans; etc. The building components include all objects, which collectively form the building itself, with the exception of the fire protection systems
mentioned above. Any additional objects located within the building, but which are not part of the building or its fire protection system should be included in the contents category.
Figure 1 -- Economic model sample input screenshot
2.1 Building Geometry
The building geometry defines the number of compartments in the building and the floor area of each compartment. This information is used to predict what proportion of the building components and contents are located in each compartment. The input required is: Ø Number of compartments
Ø Floor area of each compartment
2.2 Building Components
A list of the building components is used to calculate the cost of building construction and the cost of property damage to the building during a fire. There is a wide range of
4
construction materials and construction techniques used in modern industrial buildings. Because of the varying costs and physical properties associated with these materials and techniques, creating a comprehensive list of construction components would be prohibitively time consuming and inaccurate as products and costs change over time. For this reason, a simple cost breakdown has been adopted so that the required data can be provided in a format easily obtained by the user and easily entered into the economic model’s interface.
The cost breakdown for the building components consists of defining a set of building categories. These categories should represent all of the building components and activities in the construction process so that a realistic estimate of the building value can be
calculated. This list of categories is completely customizable by the user, although a default sample set is provided which will allow most buildings to be represented. The following building categories form the default set of building categories:
Ø Substructure Ø Structure Ø Exterior cladding Ø Interior partitions Ø Vertical movement Ø Interior finishes
Ø Fittings and equipment Ø Services
Ø Site development Ø Overheads and profit Ø Contingencies
Each building category has the following properties that must be specified: Ø Category name
Ø Capital cost ($)
Ø Maximum water threshold (kg/m²) Ø Minimum water threshold (kg/m²) Ø Maximum temperature threshold (°C) Ø Minimum temperature threshold (°C)
Ø Maximum smoke concentration threshold (kg/kg air) Ø Minimum smoke concentration threshold (kg/kg air)
The category name is used to identify the category to the user while the category’s capital cost is the cost of installing the components in that category. The capital cost should include both the cost of labour and materials for each component. This cost is used to calculate both the value of the building and the costs of damage to the building.
Each category also has a set of thresholds. These thresholds represent the sensitivity of the components within the category to three modes of damage: water, temperature and smoke. Each mode has both a minimum and maximum threshold. The minimum threshold represents the point at which the components in the category will show the first signs of damage. For instance, if the lower temperature threshold is 100°C, the components will not be damaged at temperatures below 100°C. The maximum threshold represents the point at which the components within the category will be completely damaged.
Each of the building categories can be entered for the building as a whole, or for each individual compartment. If the category is specified for the building, the capital cost for each category is broken up into individual compartments inside the model, based on the floor area of each compartment. If the category is defined for each compartment, the thresholds and the capital cost for the category must be specified for each individual compartment.
2.3 Content Components
A list of the content components is used to calculate the cost of contents in the building and the cost of property damage to the contents during a fire. Similarly to the building components, creating a list of all possible contents within any possible building would be impractical and inaccurate. Therefore, a similar strategy is employed with the content components as was used with the building components.
The cost breakdown for the content components consists of defining a set of contents categories. These categories should represent all the contents contained in the building so that a realistic estimate of the value of the contents can be calculated. Similarly to the list of building categories, the list of contents categories is completely customizable by the user. The following default set of categories is provided:
Ø Office equipment Ø Workshop equipment Ø Supplies
Ø Literature Ø Machinery
The following properties must be specified for each contents category: Ø Category name
Ø Capital cost ($)
Ø Maximum water threshold (kg/m²) Ø Minimum water threshold (kg/m²) Ø Maximum temperature threshold (°C) Ø Minimum temperature threshold (°C)
Ø Maximum smoke concentration threshold (kg/kg air) Ø Minimum smoke concentration threshold (kg/kg air)
The category name is used to identify the category to the user. The capital cost is the cost of installing the components in that category, and should include both the cost of labour and materials for each category. This cost is used to calculate both the value of the contents and the costs of any damage to the building’s contents. The thresholds for the contents categories are similar to those of the building categories. As with the building categories, each of the contents categories can be entered for the building as a whole, or for each individual compartment.
2.4 Fire Protection Systems
The economic model calculates the capital and annual costs of the fire protection systems. In order to calculate these costs, the individual fire protection systems must be defined. This is done in a manner similar to the way in which the building and contents are
6
defined. Each fire protection system used in the building should be specified in order to calculate a realistic value of the fire protection system. Like the building and contents categories, the following default list of fire protection systems is provided, although it can be easily modified by the user:
Ø Detection system Ø Alarm system
Ø Smoke control system
Ø Automatic suppression system Ø Manual suppression system Ø Emergency equipment Ø Training
Ø Monitoring
Each of the fire protection systems has the following properties that must be specified:
Ø System name Ø Capital cost ($) Ø Annual cost ($/yr)
Ø Active system (True or False) Ø Passive system (True or False)
The system name identifies the system, while the capital and annual costs specify the total cost of installation and maintenance, respectively. The user must also specify whether the system being entered forms part of the passive or active fire protection systems. Again, like the building and contents categories, the fire protection systems can be specified for the entire building, or for each individual compartment.
2.5 Fire Conditions
In order to calculate the potential losses to property, the conditions of the fire in each compartment must be entered. The following parameters specify the conditions of the fire inside each compartment:
Ø Maximum temperature (°C) Ø Maximum water density (kg/m²)
Ø Maximum smoke concentration (kg/kg air)
The maximum temperature is the maximum temperature reached within the
compartment during the fire. It is assumed that the temperature within the compartment is the same throughout the compartment, and therefore all components within the
compartment are exposed to the same conditions. The maximum water density represents the amount of water introduced to the compartment from sprinklers or firefighting operations, per m² of compartment floor area. The maximum smoke concentration represents the average smoke concentration throughout the compartment at the time of maximum concentration.
3. METHODOLOGY
The Economic model calculates two major sets of results, the total building value, VT,
and the total cost of damages in the case of a fire, CT. The building value is the sum of the following three building components:
VT = VFP + VB + VC Eq. 1
Where:
VFP = Value of fire protection systems ($)
VB = Value of building components ($)
VC = Value of contents ($)
The cost of damages is separated into damages to the building, CB, and damages to the building’s contents, CC. Damages to the fire protection system generally are not
included in the analysis. Both the costs of damages to the building and contents are
calculated by summing up the damages to each component included in the calculation of VB,
and VC above.
CT = CB + CC Eq. 2
Where:
CB = Cost of damage to building ($)
= Sum(Damageobject) for each building component
CC = Cost of damage to contents ($)
= Sum(Damageobject) for each contents component
An assumption made here is that the cost of damage is equal to the probability that the object is damaged, multiplied by the value of the object. For instance, if an object’s probability of being damaged is 0.1, we assume that 10% of the object has been destroyed, and therefore the cost of damage is 10% of its value.
Damageobject = Valueobject * Pdamage Eq. 3
A building component or contents object may be damaged by heat, smoke or water. Therefore, the probability that an object is damaged is calculated [3, 4]:
Pdamage = PdW + PdS + PdT – PdW*PdS – PdS*PdT – PdW * PdT + PdW*PdT*PdS Eq. 4
Where the individual probabilities of damage (see Figure 2) are:
PdT = Probability object damaged by high temperature
= 1.0 T(t) >= TU
= [T(t)-TL]/[ TU – TL] TL < T(t) < TU
8
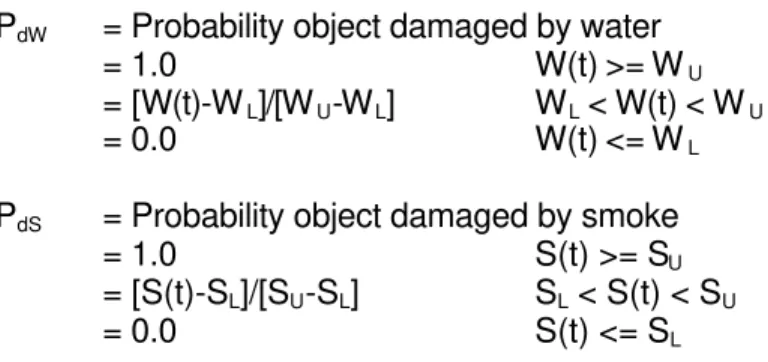
PdW = Probability object damaged by water
= 1.0 W(t) >= WU
= [W(t)-WL]/[WU-WL] WL < W(t) < WU
= 0.0 W(t) <= WL
PdS = Probability object damaged by smoke
= 1.0 S(t) >= SU
= [S(t)-SL]/[SU-SL] SL < S(t) < SU
= 0.0 S(t) <= SL
Where: T(t), W(t), and S(t) are the temperature, water density, and smoke concentration at the object’s location.
As shown in Figure 2, the probability of damage by water, smoke, or high
temperature is calculated based on the sensitivity of the object to each of these conditions. For temperature, smoke concentration, and water density, each object is given a lower
threshold XL, at which object shows first signs of physical damage, and an upper threshold
XU, at and above which the object is completely destroyed. Below the lower threshold the object is assumed not to be damaged. These thresholds are:
TL Lower temperature threshold
TU Upper temperature threshold
WL Lower water density threshold
WU Upper water density threshold
SL Lower smoke concentration threshold
SU Upper smoke concentration threshold
Lower Limit, XL Upper Limit, XU 0.0 0.2 0.4 0.6 0.8 1.0 1.2
Damage Cause (Temperature, Smoke, or Water)
P
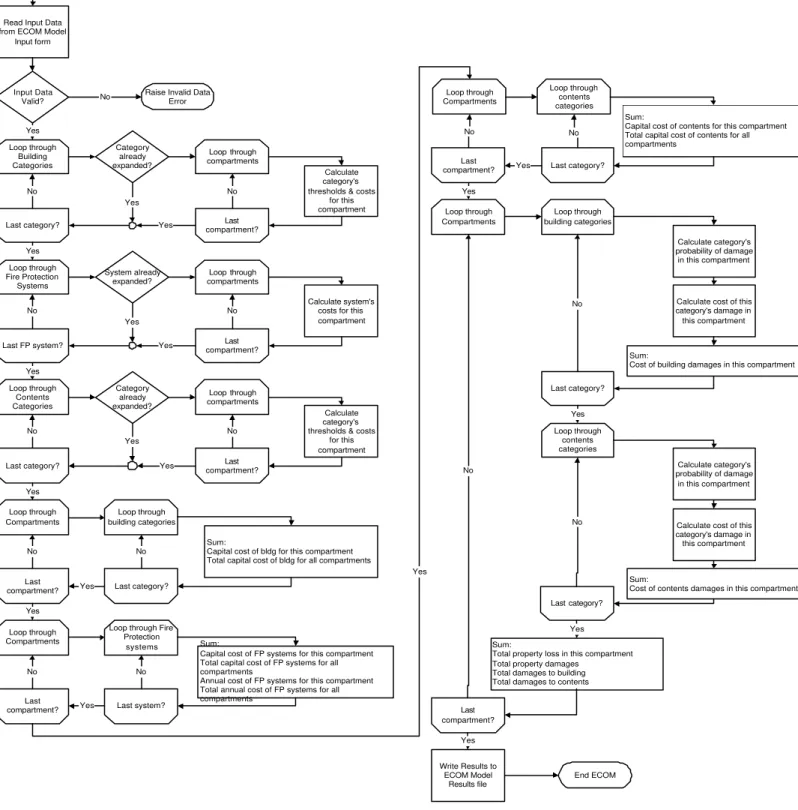
damageIn order to evaluate these probabilities of damage, the maximum temperature, smoke concentration, and water density for each compartment should be input to the model. Every category will be separated or divided into the compartments, the probability of damage calculated, and the cost of damage summed up for all the objects in each compartment. The total cost of property damage can then be calculated by summing up all costs from all the compartments as shown in Figure 3.
10 Start ECOM
Read Input Data from ECOM Model
Input form
Input Data
Valid? No
Raise Invalid Data Error Loop through Building Categories Category already expanded? Loop through compartments Calculate category's thresholds & costs
for this compartment Last compartment? Last category? No Yes No Yes Yes Yes Loop through Fire Protection Systems System already expanded? Loop through compartments Calculate system's costs for this compartment Last compartment? Last FP system? No Yes No Yes Yes Loop through Contents Categories Category already expanded? Loop through compartments Calculate category's thresholds & costs
for this compartment Last compartment? Last category? No Yes No Yes Yes Loop through Compartments Loop through building categories Sum:
Capital cost of bldg for this compartment Total capital cost of bldg for all compartments
Last category? Last compartment? No Yes No Yes Loop through Compartments
Loop through Fire Protection
systems Sum:
Capital cost of FP systems for this compartment Total capital cost of FP systems for all compartments
Annual cost of FP systems for this compartment Total annual cost of FP systems for all compartments Last system? Last compartment? No Yes No Yes Loop through Compartments Loop through contents categories Sum:
Capital cost of contents for this compartment Total capital cost of contents for all compartments Last category? Last compartment? No Yes No Yes Loop through Compartments Loop through building categories Sum:
Cost of building damages in this compartment Last category? Last compartment? No Yes No Yes Calculate category's probability of damage in this compartment
Calculate cost of this category's damage in this compartment Loop through contents categories Sum:
Cost of contents damages in this compartment Last category? No Yes Calculate category's probability of damage in this compartment
Calculate cost of this category's damage in this compartment
Sum:
Total property loss in this compartment Total property damages
Total damages to building Total damages to contents
Write Results to ECOM Model
Results file
End ECOM
4. SAMPLE RESULTS
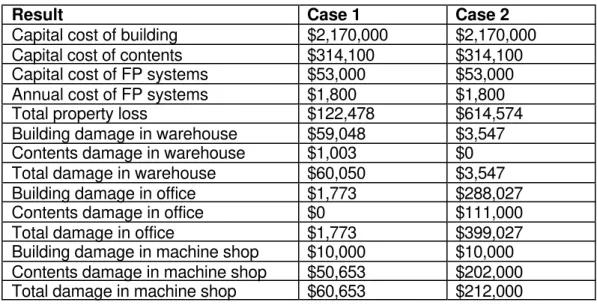
The following is a set of sample calculations from the FIERAsystem economic model. Both the inputs representing a typical industrial building, and the results of the calculations are shown below (Tables 1 through 4). Two cases were calculated (Case 1 and Case 2), with the building geometry, building categories, contents categories, and fire protection systems the same for each case. The fire conditions are different for the two cases, and the results for both cases are shown in Tables 5 and 6 and also in Figure 4.
Table 1 -- Sample building geometry (Input)
Compartment Name Floor Area (m²)
Warehouse 400
Office 200
Machine Shop 100
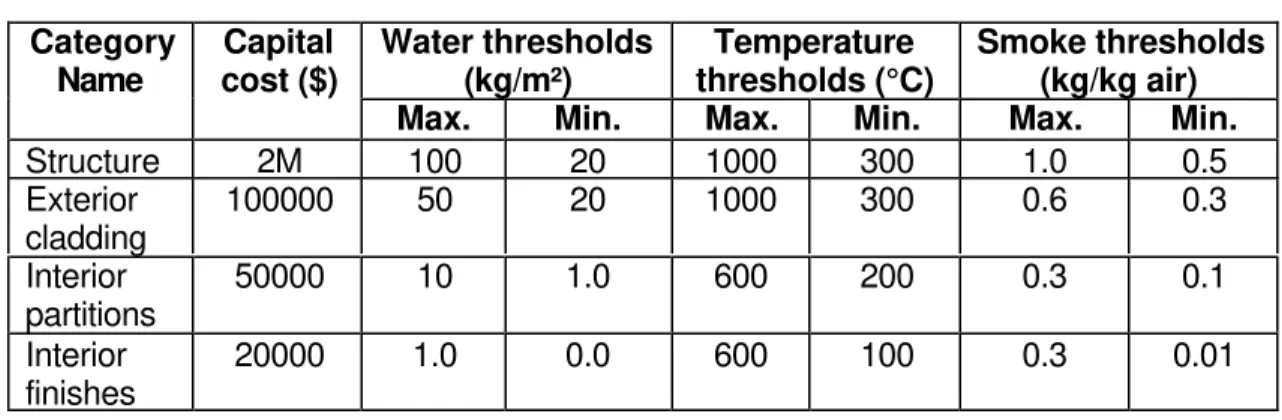
Table 2 -- Sample building categories (Input) Category Name Capital cost ($) Water thresholds (kg/m²) Temperature thresholds (°C) Smoke thresholds (kg/kg air)
Max. Min. Max. Min. Max. Min.
Structure 2M 100 20 1000 300 1.0 0.5 Exterior cladding 100000 50 20 1000 300 0.6 0.3 Interior partitions 50000 10 1.0 600 200 0.3 0.1 Interior finishes 20000 1.0 0.0 600 100 0.3 0.01
12 Table 3 -- Sample contents categories (Input)
Category Name Capital cost ($) Water thresholds (kg/m²) Temperature thresholds (°C) Smoke thresholds (kg/kg air)
Max. Min. Max. Min. Max. Min.
Office equipment – Warehouse 1,000 1.0 0.1 300 100 0.5 0.1 Office equipment – Office 100,000 1.0 0.1 300 100 0.5 0.1 Office equipment – Machine Shop 1,000 1.0 0.1 300 100 0.5 0.1 Workshop equipment – Warehouse 0 1.0 0.1 300 100 0.5 0.1 Workshop equipment – Office 0 1.0 0.1 300 100 0.5 0.1 Workshop equipment – Machine Shop 100,000 1.0 0.1 300 100 0.5 0.1 Supplies – Warehouse 100 2.0 1.0 200 70 0.7 0.3 Supplies – Office 1000 2.0 1.0 200 70 0.7 0.3 Supplies – Machine Shop 1000 2.0 1.0 200 70 0.7 0.3 Literature – Warehouse 0 0.0 0.5 500 150 0.2 0.1 Literature – Office 10,000 0.0 0.5 500 150 0.2 0.1 Literature – Machine Shop 0 0.0 0.5 500 150 0.2 0.1 Machinery – Warehouse 0 1.5 0.5 1000 300 1.0 1.0 Machinery – Office 0 1.5 0.5 1000 300 1.0 1.0 Machinery – Machine Shop 100,000 1.5 0.5 1000 300 1.0 1.0
Table 4 -- Sample fire protection systems (Input) System name Capital cost
($)
Annual cost ($/yr)
Active system Passive system Detection
system
5,000 300 True False
Alarm system 10,000 500 True False
Smoke control system 10,000 200 True False Automatic suppression system 20,000 300 True False Manual suppression system 5,000 300 True False Emergency equipment 3,000 200 True False
Table 5 -- Sample fire conditions (Input)
Compartment Parameter Case 1 Case 2
Maximum Temperature (°C)
200 70
Maximum Water Density (kg/m²)
0.3 0.0
WAREHOUSE
Maximum Smoke Concentration (kg/kg air)
0.4 0.1
Maximum Temperature (°C)
70 600
Maximum Water Density (kg/m²)
0.0 3.0
Office
Maximum Smoke Concentration (kg/kg air)
0.1 0.5
Maximum Temperature (°C)
90 150
Maximum Water Density (kg/m²)
0.0 2.0
Machine Shop
Maximum Smoke Concentration (kg/kg air)
14 Table 6 -- Sample results
Result Case 1 Case 2
Capital cost of building $2,170,000 $2,170,000
Capital cost of contents $314,100 $314,100
Capital cost of FP systems $53,000 $53,000
Annual cost of FP systems $1,800 $1,800
Total property loss $122,478 $614,574
Building damage in warehouse $59,048 $3,547
Contents damage in warehouse $1,003 $0
Total damage in warehouse $60,050 $3,547
Building damage in office $1,773 $288,027
Contents damage in office $0 $111,000
Total damage in office $1,773 $399,027
Building damage in machine shop $10,000 $10,000
Contents damage in machine shop $50,653 $202,000
Total damage in machine shop $60,653 $212,000
5. REFERENCES
1. R.S. Means Co., 1996, Means Building Construction Cost Data, Kingston, MA.
2. Hanscomb Consultants, 1997, Yardsticks for Costing, Construction Data Systems, Don Mills, Ontario.
3. Hadjisophocleous, G.V. and Yager B.L., 1996, FiRECAM Economic Model (ECMD), IRC Internal Report No. 723, Institute for Research in Construction, National Research Council of Canada, Ottawa, Ontario.
4. Hadjisophocleous, G.V. and Yager B.L., 1996, FiRECAM Property Loss Model (PLMD), IRC Internal Report No. 721, Institute for Research in Construction, National Research Council of Canada, Ottawa, Ontario.