Publisher’s version / Version de l'éditeur:
Journal of Analytical Atomic Spectrometry, 17, 10, pp. 1300-1303, 2002
READ THESE TERMS AND CONDITIONS CAREFULLY BEFORE USING THIS WEBSITE. https://nrc-publications.canada.ca/eng/copyright
Vous avez des questions? Nous pouvons vous aider. Pour communiquer directement avec un auteur, consultez la première page de la revue dans laquelle son article a été publié afin de trouver ses coordonnées. Si vous n’arrivez pas à les repérer, communiquez avec nous à [email protected].
Questions? Contact the NRC Publications Archive team at
[email protected]. If you wish to email the authors directly, please see the first page of the publication for their contact information.
NRC Publications Archive
Archives des publications du CNRC
This publication could be one of several versions: author’s original, accepted manuscript or the publisher’s version. / La version de cette publication peut être l’une des suivantes : la version prépublication de l’auteur, la version acceptée du manuscrit ou la version de l’éditeur.
For the publisher’s version, please access the DOI link below./ Pour consulter la version de l’éditeur, utilisez le lien DOI ci-dessous.
https://doi.org/10.1039/b207563f
Access and use of this website and the material on it are subject to the Terms and Conditions set forth at
Determination of vanadium in biological fluids using HR-ICP-MS
Yang, L.; Sturgeon, R.; Prince, D.; Gabos, S.
https://publications-cnrc.canada.ca/fra/droits
L’accès à ce site Web et l’utilisation de son contenu sont assujettis aux conditions présentées dans le site LISEZ CES CONDITIONS ATTENTIVEMENT AVANT D’UTILISER CE SITE WEB.
NRC Publications Record / Notice d'Archives des publications de CNRC:
https://nrc-publications.canada.ca/eng/view/object/?id=c3dbbb89-a5c0-4ac2-9cb3-5d30383da7de
https://publications-cnrc.canada.ca/fra/voir/objet/?id=c3dbbb89-a5c0-4ac2-9cb3-5d30383da7de
Determination of vanadium in biological fluids using HR-ICP-MS
Lu Yang,*
aRalph E. Sturgeon,
aDennis Prince
band Stephan Gabos
c aInstitute for National Measurement Standards, National Research Council Canada, Ottawa, Ontario, Canada K1A 0R6. E-mail: [email protected]
b
DS Prince Consulting Ltd., Edmonton, Alberta, Canada
c
Alberta Health and Wellness, Edmonton, Alberta, Canada
Received 2nd August 2002, Accepted 28th August 2002
First published as an Advance Article on the web 9th September 2002
A simple, fast and sensitive method is described for the determination of vanadium in biological fluids using high resolution inductively coupled plasma mass spectrometry (HR-ICP-MS). Samples were diluted 20-fold in 0.3% HNO3. Spectral interference from35Cl16O1, present in urine or serum matrices, was completely resolved
from the vanadium major isotope of51V1at medium resolution of 4000. Quantitation of V in urine and serum
was achieved by the method of additions using standards prepared in a pooled urine or serum sample. Mass offset and lock mass (40Ar16O1) options were employed for more accurate and precise results. Better than 2.0%
RSD was obtained with a 200 pg ml21V spike added to a 20-fold diluted urine or serum matrix, reflecting one
day stability. Vanadium concentrations in the range of v10 to 1500 pg ml21and v10 to 760 pg ml21were
determined in the urine and serum samples, respectively. Good day-to-day precision of less than 4.0% RSD was typical for both sample matrices. Spike recoveries of 99 ¡ 2 and 98 ¡ 3% (one standard deviation, n ~ 3) were obtained in the urine and serum, respectively. An in-house CRM (SLRS-4: river water) was analyzed daily, yielding a V concentration of 0.337 ¡ 0.010 ng ml21(one standard deviation, n ~ 35), in good
agreement with the certified value of 0.32 ¡ 0.03 ng ml21. A detection limit (3 s) of 10 pg ml21was estimated
for V in reconstituted urine and serum samples.
Introduction
Vanadium is released in large quantities into the environment, mainly from the combustion of fossil fuels and from various industrial processes which use V as a catalyst, as an alloying agent in steel and in welding and metal plating processes.1 Direct inhalation exposure to V leads to respiratory symptoms ranging from a mild cough to severe bronchitis.2In Canada, a
comprehensive exposure study program was initiated from June 1997 to November 1998 by a multi-stakeholder group, including industry, government and non-government organi-zations. This arose as a result of public concerns in Fort McMurray (36 400 population, Alberta, Canada) over emis-sions from the oil sands industry, which currently produces 500 000 barrels per day (bpd) and is scheduled to expand production to over 1 500 000 bpd in the next ten years. Vanadium was detected in air samples collected from this area. For the comprehensive exposure study, V levels in population serum and urine were required to be determined in order to ascertain any relationship to exposure and the use of the data as a biomarker.
Quantitation of trace levels of vanadium in biological fluids (present at the pg ml21level) is a difficult analytical task, due
not only to the very low analyte concentrations that need to be addressed, but also because of the relatively complex sample matrix. Inductively coupled plasma mass spectrometry (ICP-MS) remains popular for trace element determinations in a variety of biological samples as a consequence of its high sensitivity and superior detection power. Unfortunately, a major polyatomic interference by35Cl16O1 (arising from the
sample matrix) on the major 51V1isotope hampers accurate
determination of V in such matrices as urine and serum when using quadrupole-based ICP-MS. As a result, separation of the analyte from such interference prior to Q-ICP-MS deter-mination is often needed to ensure accurate results. Thus, electrothermal vaporization3and cryogenic desolvation4 tech-niques have been used with ICP-MS to reduce the interferences
for V determination in urine or serum. Detection limits in the range of 45 to 100 pg ml21 have been reported using these
approaches. More recently, a dynamic reaction cell (DRC) ICP-MS method5 has been reported for V determination in serum and urine with a detection limit of 28 pg ml21.
High resolution sector field inductively coupled plasma mass spectrometry (HR-ICP-MS) not only possesses high sensitivity, sub-pg ml21 instrumental detection limits, a large dynamic
range and multi-element capability, but also has the capability to resolve a significant number of spectral interferences, including that from35Cl16O1 on 51V1. Thus, this technique
has gained popularity recently for the determination of trace elements and/or their isotope ratios in biological fluids.6–14 Detection limits in the range 12 to 100 pg ml21 for V in
biological fluids have been reported using HR-ICP-MS.9,10,12,14 In 2001, ThermoFinnigan released software, version 2.1, highlighting new mass offset and lock mass features, which permit correction for mass shift (due to hysteresis within the magnet material) and mass drift (due mostly to thermal effects) previously observed with both their Element 1 and Element 2 HR-ICP-MS insturments. These improvements not only elimi-nate the need for repeat mass calibrations during daily opera-tion, especially at medium and high resoluopera-tion, but also provide more stable instrument performance, resulting an improved accuracy and precision of analytical results.
The objective of this study was to take advantage of the high sensitivity, superior detection power and stability features offered by the Element 2 HR-ICP-MS instrument for the rapid, accurate and precise determination of V in urine and serum samples that were simply diluted 20-fold in 0.3% HNO3. In this manner,
complex sample preparation was avoided and possible contam-ination introduced from reagents or internal standards mini-mized. A simple, one-point standard additions calibration was used to compensate for matrix effects and to ensure accurate quantitation of V in the urine and serum samples. The method was applied to the determination of V in 400 samples of urine and serum which had been collected for the exposure study. 1300 J. Anal. At. Spectrom., 2002, 17, 1300–1303 DOI: 10.1039/b207563f
Experimental
Instrumentation
The HR-ICP-MS used in this work was a ThermoFinnigan Element 2 (Bremen, Germany) equipped with a Scott-type double-pass glass spray chamber and a Conikal nebulizer (Glass Expansion, West Melbourne, Victoria, Australia). A plug-in quartz torch with a sapphire injector and a Pt guard electrode were used. Optimization of the Element 2 was performed as recommended by the manufacturer. Typical operating conditions are summarized in Table 1.
A Gilson Microman M250 piston pipette (Mandel Scientific Company Ltd., Guelph, Ontario, Canada) was used to pipette urine or serum samples. Polypropylene screw cap tubes, 8 and 30 ml volume, used for the storage and preparation of urine and serum samples, were purchased from Sarstedt Inc. (St-Leonard, Quebec, Canada).
Reagents and solutions
Nitric acid was purified in-house by sub-boiling distillation of reagent grade feedstock in a quartz still prior to use. Ultra-clean water was obtained from a Nanopure ion exchange reverse osmosis system (Barnstead/Thermolyne, Boston, MA, USA). A 1000 mg ml21stock solution of V was prepared by
dissolution of the high purity metal (Johnson, Matthey & Co. Limited, London, UK) in HNO3. An intermediate working
solution of 100 ng ml21, used for preparing calibration
standards, was prepared by a serial dilution of the stock with 1% HNO3solution.
The river water CRM SLRS-4 (NRCC, Ottawa, Canada) was used to check the accuracy of the method.
Samples and sampling
Samples of blood and urine were obtained from study participants who reported to hospital laboratories for collec-tion of the first full emission of morning urine. Care was taken during sampling to avoid possible contamination. The detailed sampling procedure and contamination control measures will be reported later by Alberta Health and Wellness. In brief, an individual’s urine sample was first collected in a Labcraft plastic container (Anachemia Science, Montreal, Quebec, Canada), the sample was thoroughly shaken and a 30 ml aliquot poured into a screw-capped conical polypropy-lene centrifuge tube. The sample was frozen immediately and then shipped frozen to the NRC for analysis.
For sampling serum, venipuncture was first preformed using a stainless phlebotomy needle with a plastic hub. The required volume of blood was slowly drawn into a 7 ml Monoject trace element blood collection tube with royal blue stopper, this being a no additive, silicone coated tube (Sherwood Medical Canada). The blood sample was left for 30–60 min (maximum) to allow clotting. The serum was transferred to an 8 ml poly-propylene screw-capped tube after centrifugation. The serum
samples were frozen immediately and shipped frozen to the NRC laboratory for analysis.
Sample preparation and measurement procedure
To reduce the risk of contamination, all plastic labware was cleaned by leaching with 1 1 1 diluted reagent grade HNO3
for a week, rinsed with ultra-clean water and filled with 2% high purity HNO3for a further week of leaching. Pipette tips
were leached in 5% high purity HNO3and rinsed several times
with ultra-clean water before use. All plastic tubes were pre-screened for contamination before use for the preparation of samples.
Urine and serum samples were prepared in a class 100 fume hood. Aliquots of 0.250 ml each of urine or serum were delivered using a Gilson Microman M250 piston pipette into pre-cleaned 8 ml polypropylene tubes and diluted with 0.3% HNO3to a total of 5.0 ml prior to analysis.
Each set of calibration standards, Std1 and Std2, was prepared as follows: aliquots of 2.5 ml each of pooled urine or serum sample were used with addition of 0 and 0.100 ml of 100 ng ml21V standard solution and diluted to 50 ml with 1%
HNO3, resulting in concentrations of 0 and 200 pg ml21,
respectively. Before starting a measurement sequence, Std1 was aspirated for 5–10 min to permit the system to stabilize. The Mass offset values for all isotopes used were then obtained using Std2. After transferring the mass offset values in the method and activating the lock mass at40Ar16O1, the
measure-ment sequence was started and data collected in the order Std1 and Std2 followed by three sample reagent blanks and seven urine samples or serum samples. Both Std1 and Std2 were repeatedly measured after every 10 samples. A measurement sequence usually contains fifty samples. A standard additions calibration method was used for the final quantitation of V in all samples.
Results and discussion
Optimization
Optimization of the Element2 was performed daily, as recom-mended by the manufacturer, using a 1 ppb multi-element standard solution. A Pt guard electrode was used to achieve high sensitivity. The nebulizer gas flow rate was tuned to obtain the most stable signal, at acceptable sensitivity, and low level (5–6%) oxide formation (UO/U) rather than for absolute intensities of Li, In and U. Mass offset values for isotopes of interest for the determination of V were then determined immediately after mass calibration at medium (i.e., 4000) resolution. It was determined that aspirating a 20-fold diluted urine or serum sample for 5–10 min before starting the measurement sequence was necessary to stabilize the system and achieve better accuracy and precision of results. For this purpose, 20-fold diluted urine and serum samples, spiked at a concentration of 200 pg ml21 V, were used to access the
instrument stability under chosen experimental conditions. One hour short term stabilities of 1.4 and 1.5% RSD (n ~ 20) were obtained with these standard solutions of urine and serum, respectively. Six hour stabilities were estimated from six repeat measurements of Std2 (200 pg ml21 V spike) in a
measurement sequence, yielding better than 2% RSD (n ~ 6) for both urine and serum.
Contamination control
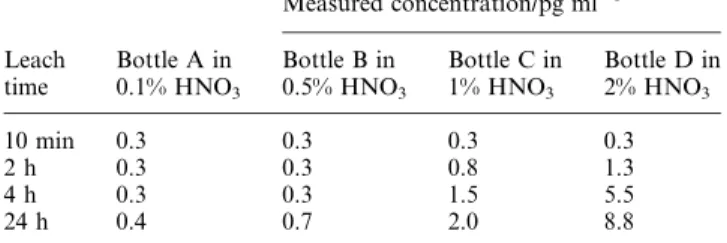
Preliminary measurements suggested that V concentrations were as low as 10 pg ml21in some urine and serum samples.
Reagent, plastic bottles and tubes were therefore screened for possible contamination prior to use. Polyethylene bottles (15 ml volume) were checked for V content after HNO3acid
cleaning and leaching. The bottles were filled with different
Table 1 Element2 HR-ICP-MS operating conditions
Rf power 1200 W
Plasma Ar gas flow rate 15.0 l min21
Auxiliary Ar gas flow rate 1.000 l min21
Nebulizer Ar gas flow rate 0.990 l min21
Sampler cone (nickel) 1.1 mm Skimmer cone (nickel) 0.8 mm
Resolution 4000
Data acquisition E-scan, 5 runs 6 30 passes, 100% mass window, 60% search window, 60% integration window, 0.0050 s sample time,
40Ar16O1as lock mass
Dead time 17 ns
concentrations of high purity HNO3solution and leached for
various time intervals, after which V intensities were recorded at medium resolution. Concentrations of V in leaching solu-tions were calculated based on external calibration. Increased concentrations of V were detected as the HNO3concentration
and leaching time increased in some bottles, as shown in Table 2, clearly indicating that the contamination of V arose from this type of polyethylene bottle. Subsequently, 100 poly-propylene screw cap tubes of 8 ml volume were tested for V. The intensities of V measured in 0.1 to 2% HNO3leaching
solutions were all less than 100 cps (v0.1 pg ml21), indicating
no significant contribution to V contamination from these tubes, which were therefore used in the final study.
Matrix effects, interferences and detection limits
In a preliminary study, signal enhancements on 51V1 arising
from 10-fold diluted serum and urine samples were 20 and 11%, respectively, compared with that from a standard solution. Sensitivity as a function of sample dilution in the range of 10- to 100-fold was thus investigated in both matrices using solutions spiked at a V concentration of 200 pg ml21.
Intensities were normalized to the intensity obtained from a 200 pg ml21 standard solution, as shown in Fig. 1 for urine
samples. A sensitivity enhancement is clearly evident as the dilution factor is decreased below 50-fold. A similar trend (not shown) was obtained for serum samples, although a slightly higher enhancement at 10- to 40-fold dilution was evident. No blockage of the cones was observed when 20-fold diluted urine or serum was continuously run for 6 h. Consequently, in the interest of maintaining long-term stability without sacrifi-cing sensitivity, a 20-fold dilution was selected for all further measurements.
As noted earlier, a major interference by35Cl16O1, arising in
urine or serum matrices, hampers accurate quantitation of V when using low resolution ICP-QMS. The resolution needed to separate 35Cl16O1 from51
V1is 2573. As shown in Fig. 2, 51V1 is well separated from 35Cl16O1 at medium resolution
(4000) in a 20-fold diluted serum sample spiked to contain
200 pg ml21V. Final quantitation of V in all urine and serum
samples was conducted at medium resolution.
A urine and a serum sample containing low V were chosen for estimation of the method detection limit. A standard additions calibration technique was used to compensate for the 6 and 11% enhancements in signal intensity present in 20-fold diluted urine and serum, respectively, for the quantita-tion of V in these two samples. Detecquantita-tion limits (3 s) were calculated from the standard deviations of 10 measured V concentrations in both matrices, yielding 10 pg ml21in both the
undiluted urine and serum samples. This detection limit is well suited to the determination of V in these samples since the lowest mean values reported1in human urine and serum are 23 and 212 pg ml21, respectively. The detection limit achieved
here is comparable to, or better than, that reported in other studies9,10,12,14using HR-ICP-MS.
Sample analysis
The linearity of the addition calibration curves covering the entire concentration range of samples was examined under optimum experimental conditions using spikes of 0, 100, 200 and 500 pg ml21 in 20-fold diluted pooled urine and serum
samples. Correlation coefficients of 0.9998 and 0.9997 were obtained in the urine and serum, respectively. The final analysis of all urine and serum was performed using a single point addi-tion calibraaddi-tion at a spiked V concentraaddi-tion of 200 pg ml21,
using the measurement sequence described earlier. No signifi-cant difference in V concentrations measured in a few selected urine and serum samples was observed when using either a four point calibration or a two point calibration. The system was stabilized after aspirating Std1 for 5–10 min before starting the measurement sequence. No further drift in sensitivity during a day run was observed. Usually, better than 2% RSD, based on six repeat measurements of Std2 (200 pg ml21 V
spike), can be obtained during a day sequence. Therefore, a calibration curve generated from these six repeat measurements was used for the quantitation of V in 50 unknown samples in a sequence. Results from selected urine and serum samples, which were measured on different days (samples were thawed and re-frozen), are reported in Table 3. The highest V concen-trations encountered were 1500 ¡ 40 and 760 ¡ 20 pg ml21
in these urine and serum samples, respectively. Good day-to-day precision, better than 4% RSD, was obtained in both sample matrices. Interpretation of these V concentrations is beyond the scope of this study: a full statistical report will be issued by Alberta Health and Wellness in the future.
As no human body fluid CRMs certified for V are available, an in-house river water CRM, SLRS-4, was analyzed daily to evaluate the accuracy of the methodology using a one point addition calibration to a 20-fold diluted sample. A V
Table 2 Blanks from selected polyethylene bottles
Leach time Bottle A in 0.1% HNO3 Measured concentration/pg ml21 Bottle B in 0.5% HNO3 Bottle C in 1% HNO3 Bottle D in 2% HNO3 10 min 0.3 0.3 0.3 0.3 2 h 0.3 0.3 0.8 1.3 4 h 0.3 0.3 1.5 5.5 24 h 0.4 0.7 2.0 8.8
Fig. 1 Sensitivityversus dilution factor for urine.
Fig. 2 Mass spectral scan obtained with a serum sample diluted 20-fold and spiked with V at a concentration of 200 pg ml21.
concentration of 0.337 ¡ 0.010 (one standard deviation, n ~ 35) measured in SLRS-4 over a period of 35 d is in good agreement with the certified value of 0.32 ¡ 0.03 ng ml21.
Spike recovery experiments (20 pg ml21 in 20-fold diluted
pooled urine and serum samples) were also run. Quantitative spike recoveries of 99 ¡ 2 and 98 ¡ 3% (one standard devia-tion, n ~ 3) were obtained for urine and serum, respectively. These results suggest that the developed method is capable of providing accurate determination of V in both matrices.
All human urine and serum samples were stored at 22 uC without acidification and samples were restored to this condition after analysis. Good day-to-day precision of less than 4% was obtained for both matrices within a one month analysis period, as shown in Table 3. In addition, no mea-surable losses of V occurred over a 1 month storage period (e.g., urine D was measured on 11 different days within that month, Table 3, which entailed multiple thawing and re-freezing cycles).
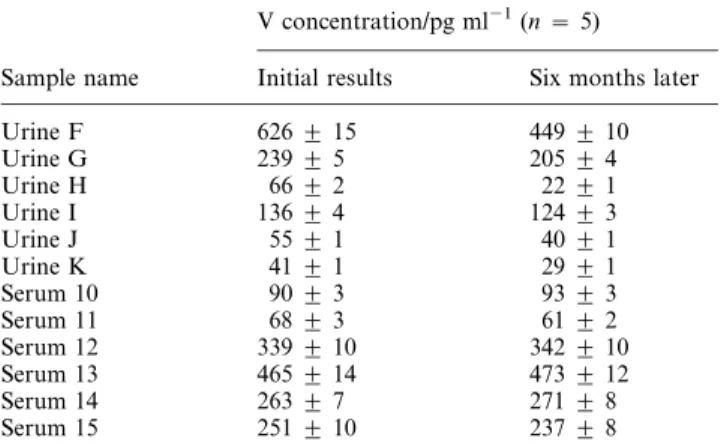
It was of interest to investigate the long-term stability of V in these samples under such storage conditions. Six urine and six serum samples were selected and re-analyzed following 6 months of storage. Results are summarized in Table 4, and show good agreement with concentrations measured 6 months earlier for all serum samples. Significantly lower concentrations were obtained for all urine samples measured after this time period, evidence that the long-term storage conditions used for this material were inappropriate.
Conclusion
A simple, fast, sensitive and accurate method has been deve-loped for the determination of V in urine and serum samples. A 20-fold dilution in 0.3% HNO3 in combination with the low
detection limit of 10 pg ml21makes this method well suited for
the quantitation of V in human urine and serum samples. At these levels, special attention should be paid to contamina-tion control from reagents and containers. Optimum long term storage conditions for such samples require further investigation.
References
1 E. Sabbioni, J. Kue`era, R. Pietra and O. Vestergery, Sci. Total Environ., 1996, 188, 49–58.
2 R. E. M. Lees, Br. J. Ind. Med., 1980, 37, 253–256.
3 L. Yu, S. R. Koirtyohann, M. Rueppel, A. K. Skipor and J. J. Jacobs, J. Anal. At. Spectrom., 1997, 12, 69–74.
4 M. G. Minnich, R. S. Houk, M. A. Woodin and D. C. Christiani, J. Anal. At. Spectrom., 1997, 12, 1345–1350.
5 D. E. Nixon, K. R. Neubauer, S. J. Eckdahl, J. A. Butz and M. F. Burritt, Spectrochim. Acta B, 2002, 57, 951–966.
6 M. Krachler, A. Alimonti, F. Petrucci, F. Forastiere and S. Caroli, J. Anal. At. Spectrom., 1998, 13, 701–705.
7 S. Stu¨rup, M. Hansen and C. Mølgaard, J. Anal. At. Spectrom., 1997, 12, 919–923.
8 A. T. Townsend, K. A. Miller, S. McLean and S. Aldous, J. Anal. At. Spectrom., 1998, 13, 1213–1219.
9 I. Rodushkin, F. O¨ dman, R. Olofsson and M. D. Axelsson, J. Anal. At. Spectrom., 2000, 15, 937–944.
10 A. T. Townsend, J. Anal. At. Spectrom., 2000, 15, 307–314. 11 S. Stu¨rup, J. Anal. At. Spectrom., 2000, 15, 315–322.
12 J. Begerow, M. Turfeld and L. Dunemann, J. Anal. At. Spectrom., 2000, 15, 347–352.
13 R. S. Pappas, B. G. Ting, J. M. Jarrett, D. C. Paschal, S. P. Caudill and D. T. Miller, J. Anal. At. Spectrom., 2002, 17, 131–334. 14 I. Rodushkin, F. O¨ dman and S. Branth, Fresenius’ J. Anal. Chem.,
1999, 364, 338–346. Table 3 V concentrations (pg ml21) in selected urine and serum
samples
Sample name Measured V concentration RSD (%)
Urine A (n ~ 3) v10 N/A Urine B (n ~ 5) 23 ¡ 1 3.7 Urine C (n ~ 3) 67 ¡ 2 3.0 Urine D (n ~ 11) 134 ¡ 5 3.7 Urine E (n ~ 3) 1500 ¡ 40 2.7 Serum 1 (n ~ 3) v10 N/A Serum 2 (n ~ 3) 62 ¡ 2 3.2 Serum 3 (n ~ 3) 254 ¡ 8 3.1 Serum 4 (n ~ 3) 760 ¡ 20 2.6
Table 4 Long-term storage results
V concentration/pg ml21(n ~ 5)
Sample name Initial results Six months later
Urine F 626 ¡ 15 449 ¡ 10 Urine G 239 ¡ 5 205 ¡ 4 Urine H 66 ¡ 2 22 ¡ 1 Urine I 136 ¡ 4 124 ¡ 3 Urine J 55 ¡ 1 40 ¡ 1 Urine K 41 ¡ 1 29 ¡ 1 Serum 10 90 ¡ 3 93 ¡ 3 Serum 11 68 ¡ 3 61 ¡ 2 Serum 12 339 ¡ 10 342 ¡ 10 Serum 13 465 ¡ 14 473 ¡ 12 Serum 14 263 ¡ 7 271 ¡ 8 Serum 15 251 ¡ 10 237 ¡ 8