Cavity absorber-emitters for high-temperature solar
thermophotovoltaics
by
Colin Clancy Kelsall
B.S. Mechanical Engineering Georgia Institute of Technology, 2016
Submitted to the Department of Mechanical Engineering in partial fulfillment of the requirements for the Degree of Master of Science in Mechanical Engineering
at the
MASSACHUSETTS INSTITUTE OF TECHNOLOGY September 2018
©2018 Massachusetts Institute of Technology 2018 All rights reserved.
Author ... Department of Mechanical Engineering Aug 24, 2018
Certified by ... Evelyn N. Wang Department Head of Mechanical Engineering Thesis Supervisor
Accepted by ... Rohan Abeyaratne Chairman, Department Committee on Graduate Theses
3
Cavity absorber-emitters for high-temperature solar
thermophotovoltaics
by
Colin Clancy Kelsall
Submitted to the Department of Mechanical Engineering on August 24th,2018 in Partial Fulfillment of the Requirements for the
Degree of Master of Science in Mechanical Engineering
Abstract
Solar energy has been an important component of the world’s energy infrastructure for many years, but certain limitations have hindered its ability to become a primary source of renewable energy. In particular, intermittency and fundamental limitations on conversion efficiency have restricted adoption of direct photovoltaic conversion with PV cells. Recent developments in more advanced cell chemistries and concentrated solar power systems (CSP) seek to address some of these limitations and enable higher grid penetration of solar derived power. This thesis examines one of these such technologies, solar thermophotovoltaics (STPV), and presents opportunities to improve on past work in the field to enable higher conversion efficiencies and lower cost solar power.
STPV power systems typically utilize a monolithic absorber-emitter component that is heated with concentrated sunlight through a highly absorptive surface. The monolith radiatively illuminates a low-bandgap PV cell from a different, spectrally selective emitter surface, producing electricity. This added spectral selectivity allows for improved photovoltaic conversion efficiencies compared to a standard PV cell illuminated with the solar spectrum. STPV systems, however, often operate above 1000°C and are hindered by substantial parasitic thermal losses.
In this thesis we first present an overview of the loss mechanisms currently limiting STPV system efficiencies and some theoretical approaches to address these losses. Previously demonstrated STPV systems have significant drops in efficiency through re-emission losses from the hot absorber surface. Selective absorber coatings can reduce these losses; however, experimentally demonstrated efficiency improvements have been limited due to non-ideal spectral selectivity and high-temperature instability. Through an alternative approach, we present a purely geometric solution to mitigate re-emission losses by varying the area ratio, defined as the ratio of thermal emitter area to solar absorber area. We model how our
4
solution could theoretically improve previously demonstrated STPV systems and also discuss the practical limitations of our approach.
Secondly, we investigate the potential of integrating a cavity-based geometry for the absorber-emitter monolith in place of typical planar designs. By incorporating a cavity in place of the planar absorber-emitter, we take advantage of both increased absorption across the full solar spectrum and enable very high area ratios in a compact design.
Third, we address how thermal gradients might develop within the absorber-emitter monolith and how these gradients might impact system performance. We present a numerical model capable of predicting PV cell performance degradation under uneven illumination resulting from emitter temperature gradients.
Finally, we validate our model through experiments using cavities made from high-temperature refractory materials and a high-powered laser to emulate highly concentrated sunlight. By integrating a cavity-type absorber-emitter with state-of-the-art spectrally selective surfaces and filters, the maximum system efficiency demonstrated in previous works could be increased from 6.8% to upwards of 9% without any improvements in spectral selectivity. This cavity-type approach, which has the potential to improve solar absorber performance both for STPV and other solar thermal technologies, could help realize the full potential of these systems as efficient and useful methods of solar energy conversion.
Thesis Supervisor: Evelyn N. Wang
5
Acknowledgments
I would like to thank my advisor Evelyn N. Wang for her excellent mentorship and guidance during my time at MIT. She has helped me work through significant challenges in my work and progress as an engineer in my thinking and presentation abilities. I am very grateful to have been offered a place in her lab. Throughout this project I have received great advice from all my lab mates, but three of them stand out in particular. David Bierman first introduced me to STPVs and convinced me of their enormous potential as energy conversion devices. His teaching and support during my first year of the project has continued to benefit me even after he graduated and started a company focusing on STPVs. In his stead, Bikram Bhatia has been a great mentor and teacher, helping me write my first papers and work through many iterations of presentations on this topic. Arny Leroy sits right across from me and has been an amazing sounding board for ideas and advice. His expertise in vacuum related projects and thermal radiation has been invaluable throughout this project.
I would also like to thank all the people in the Device Research Lab. They have been an incredible resource, helping to improve my presentation skills and giving advice on general graduate student life. It is a privilege to have access to so many intelligent people with expertise in such varied areas.
Finally, this work would not have been possible without the support of my funding sources. This project was supported as part of the Solid-State Solar Thermal Energy Conversion (S3TEC) Center, an Energy Frontier Research Center funded by the U.S. Department of Energy, Office of Science, Basic Energy Sciences under Award No. #DE-FG02-09ER46577.
7
Contents
1. Introduction ... 13
Motivation ... 13
Background ... 15
1.1.1. Fundamentals of solar thermophotovoltaics (STPV) ... 15
Thesis objectives and outline ... 17
2. Improving solar thermophotovoltaic system efficiency ... 19
STPV literature review ... 19
STPV system sub-efficiencies ... 20
2.2.1. Optical efficiency ... 21
2.2.2. Photovoltaic efficiency ... 21
2.2.3. Photothermal efficiency ... 24
Improving photothermal efficiency... 24
2.3.1. Isothermal modelling of approach ... 25
2.3.2. Coupling between system sub-efficiencies ... 27
Summary ... 28
3. Cavity-type Absorber-Emitters for STPV ... 29
Advantages of cavities ... 29
Materials selection ... 31
Practical cavity design considerations ... 33
Summary ... 34
4. Thermal Gradients Within Cavity-type Absorber-Emitters ... 35
Impact of geometric and scale parameters on thermal gradients ... 35
Impact on PV cell performance... 37
4.2.1. Past work on uneven PV cell illumination ... 37
4.2.2. PV cell electrical model under uneven illumination ... 37
Summary ... 42
5. Experimental Setup and Methodology ... 43
Experimental absorber-emitter cavities ... 43
Solar emulator experimental setup ... 44
Emitted power measurements ... 46
8
Summary ... 47
6. Realizable Improvements Using Cavity Absorber-Emitters ... 49
Modelling and experimental results ... 49
Experimental error analysis ... 50
6.2.1. Parasitic radiative losses from cavity inactive area ... 50
6.2.2. Surface roughness emittance error ... 50
6.2.3. Thermocouple temperature gradient error ... 52
6.2.4. Modelled cavity absorptance error ... 54
6.2.5. Hemispherical versus normal emittance measurement error ... 55
6.2.6. Collimating lens contamination error... 57
6.2.7. Error analysis summary and next steps ... 57
Combining selective emitters with cavity absorber-emitters ... 58
Summary ... 58
7. Opportunities and Future Work in STPVs ... 59
Conclusions on STPV device design ... 59
Proposed future work ... 59
7.2.1. Optimization of spectral selectivity method ... 59
7.2.2. PV gradient model validation ... 60
7.2.3. Integrated thermal energy storage ... 60
Bibliography ... 63
9
List of Figures
Figure 1: Available energy by type compared to global annual energy consumption, reproduced from Perez et al. [1]. ... 13 Figure 2: Estimated global electricity consumption by source, end-2017, reproduced from the Renewable Energy Policy Network for the 21st Century [2]. ... 14 Figure 3: Shockley-Queisser fundamental PV efficiency limit at various bandgap wavelengths, including typical cell chemistries’ progress towards the S-Q limit, reproduced from Polman et al. [3]. ... 14 Figure 4: Impact of photon wavelength on photovoltaic conversion effectiveness for direct solar illumination. The yellow highlighted region below the bandgap wavelength of a silicon PV cell represents inefficiency conversion due to photon thermalization losses. The green highlighted portion represents efficient conversion, and the red portion represents low-energy photons that are not converted by the indicated cell chemistry. ... 16 Figure 5: Potential emission tailoring enabled by an intermediate spectral converter including GaSb cell chemistry and an emitter at 1800 K. Darker portion represents the electricity generation potential at each wavelength accounting for thermalization of high energy (low wavelength) photons. ... 16 Figure 6: Schematic of a typical planar STPV system identifying system sub-efficiencies, optical efficiency (o) photothermal efficiency (PT), and photovoltaic efficiency (PV). ... 21 Figure 7: Theoretical impact of narrowing emission band on PV conversion efficiency for an ideal GaSb (λg=1.77 m) cell illuminated with black-body emission at 1800 K (light grey shaded region). The darker shaded region represents the power capable of being extracted from the PV cell, taking thermalization losses into account. Band width for the band-pass selective emitter is 200 nm. ... 22 Figure 8: External quantum efficiency (EQE) values for JX Crystals GaSb PV cells for photon wavelengths ranging from 400 nm to 2 m, reproduced from JX Crystals’ cell specifications datasheet [13]. ... 23 Figure 9: Schematic of modelled absorber-emitter geometry including relevant variables. ... 25 Figure 10: Isothermal modelling results for photothermal efficiency with respect to area ratio (AR) for both a black body emitter and a short-pass selective emitter (inset) cutoff at the bandgap wavelength of GaSb (1.77 μm). The emitter temperature was assumed to be 1800 K for the effective emittance calculation. .. 27 Figure 11: Isothermal modelling results for a simplified STPV system efficiency. PV efficiencies were calculated for ideal cells assuming the bandgap of GaSb (1.77 μm), an emitter temperature of 1800 K, and the emission spectra described in Figure 10 (inset) using Eqs. (10) and (11). ... 28 Figure 12: Impact of cavity aspect ratio on absorber effective emittance for several surface effective emittances. ... 30 Figure 13: Estimate of the sensitivity of the cavity emittance to incoming light distribution for a surface effective emittance of 0.2. Collimated and diffuse light sources were simulated with COMSOL. ... 31 Figure 14: Comparison of material selection criteria and material classes. ... 31 Figure 15: Comparison of graphite and tungsten spectral hemispherical emissivity profiles at 300 K (measured) and 1800 K (literature) [25]. ... 32 Figure 16: Equilibrium cavity temperature versus AR at several input solar concentrations. Both emitter emission spectra are detailed in Figure 10 (inset). ... 34 Figure 17: Schematic for thermal gradient scaling analysis represented as a cross section of an axisymmetric cylindrical cavity with internal diameter D, length L, and wall thickness t. ... 35
10
Figure 18: Thermal gradients in cavities with different geometries (L/D) and scales (L, t). Incoming light was modelled as diffuse and optical concentration, thermal conductivity, and AR was held constant for all four cases. Temperature is in degrees kelvin (K). ... 36 Figure 19: Comparison of thermal emission magnitude and spectra at 1800 K and temperatures corresponding to a 50% increase and 50% decrease in emitter power. ... 37 Figure 20: Diagram of modelled emitter-PV cell system with an emitter wall ranging from Tmin to Tmax. Vi
an Ii represent the local voltage and generated current across the p-n junction for a discrete slice of a PV
cell. Ai represents the vertical cross-sectional area of each slice. ... 38
Figure 21: (a) Reference dimensions for discretized slice of PV cell. (b) Simplified circuit diagram of a discretized PV cell accounting for the bulk resistance of both p-type and n-type semiconductor layers. .. 39 Figure 22: (a) Modelled temperature profiles normalized to the average emitted power (T4). (b) Modelled optical intensity profiles normalized to the average optical illumination intensity calculated at 1800 K. (c) I-V curves for an ideal PV cell illuminated with bandgap of 1.77 μm and constant EQE of 1 illuminated with several thermal gradients. (d) I-V curves for the same ideal PV cell illuminated by optical intensity gradient. (e) I-V curves for a similar PV cell, accounting for the EQE values specified in Figure 8, illuminated with several thermal gradients. (f) I-V curves for the same cell as part (e), but illuminated by optical intensity gradients. ... 41 Figure 23: Photographs of sample cavities for experiments with two area ratios (AR), 106 and 24, and two materials, graphite and tungsten... 43 Figure 24: Experimental apparatus schematic summarizing major components. ... 44 Figure 25: Details of the experimental fixturing (not to scale, scale bar provided for order of magnitude dimension reference). ... 45 Figure 26: Photographs of experimental setup including the tungsten cavity with AR = 24. ... 45 Figure 27: Schematic of parasitic loss model. ... 47 Figure 28: (a) - (d) Modeled temperature and photothermal efficiency versus input concentration for a tungsten and graphite cavities with area ratios of 24 and 106. Concentration uncertainties include instrument error as well as two standard deviations of the fluctuations in the measured calibration data. Uncertainty in cavity temperature accounts for instrument error. Uncertainty in photothermal efficiency is derived from both the concentration uncertainty and temperature uncertainty. ... 49 Figure 29: Impact of maximum inactive area radiative parasitic loss on agreement between modelled and experimental data for a tungsten and graphite cavity with AR = 24. ... 50 Figure 30: Tungsten cavity surface roughness before and after experiment and predicted final surface roughness. ... 51 Figure 31: Impact of surface roughness on agreement between modelled and experimental data for a tungsten cavity with AR = 24. Surface feature sizes of 0.02, 0.05, and 0.07 μm were considered. ... 52 Figure 32: Visualization of temperature gradients within the cavity, glue ball, and thermocouple. The thermocouple measurement and reference points are also indicated. ... 53 Figure 33: Results from COMSOL analysis indicated absolute and relative error in thermocouple reading due to thermal gradients within the glue ball and thermocouple. ... 53 Figure 34: Comparison of modelled and measured cavity absorptance for a tungsten cavity with AR = 24. A relative error of roughly 5% was observed throughout the measured data range. ... 54 Figure 35: Impact of absorptance error on agreement between modelled and experimental data for a tungsten cavity with AR = 24. ... 55
11
Figure 36: Comparison of literature data on the difference between hemispherical and normal emission for a polished tungsten surface [25]... 55 Figure 37: Impact of implementing hemispherical emittance correction factor on agreement between modelled and experimental data for a tungsten cavity with AR = 24. ... 56 Figure 38: Comparison of literature and measured emissivity data for graphite surfaces. Literature data is for hemispherical emission [30] and measured data is obtained using normal reflectance measurements. 56 Figure 39: Impact of implementing hemispherical emittance data on agreement between modelled and experimental data for a graphite cavity with AR = 24. ... 57 Figure 40: Comparison of (a) past demonstrated STPV system [10] and (b) predicted performance improvements through the integration of a cavity-type absorber-emitter with AR = 35. ... 58 Figure 41: Illustration of the major operating principle of three promising spectral selectivity techniques: (a) selective emitters, (b) optical filters, and (c) cell back surface reflectors/mirrors. Yellow arrows represent PV convertible photons, while red arrows represent low-energy photons. ... 60 Figure 42: Proposed STPV cavity design integrating high-temperature phase change thermal storage medium. ... 61
13
Chapter 1
1. Introduction
MOTIVATION
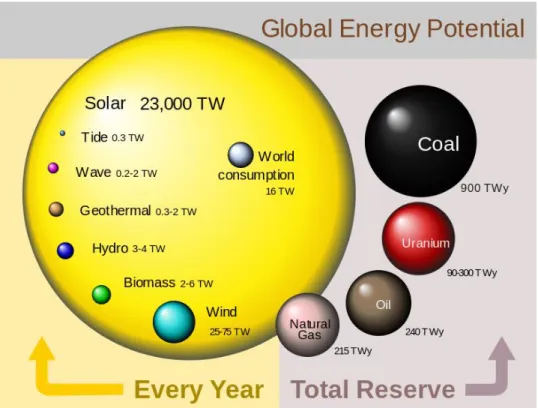
The sun provides an enormous amount of energy to the earth every day, dwarfing all other energy sources known to mankind [1]. Figure 1 illustrates the relative magnitudes of our fossil and nuclear energy reserves, as well available power from various renewable resources. Even with the availability of this abundant solar resource, less than 2.2% of the world’s electricity in 2017 was obtained from direct solar conversion, shown in Figure 2. Instead, the world relies primarily on non-renewable energy sources that contribute to the steady warming of our planet.
Figure 1: Available energy by type compared to global annual energy consumption, reproduced from Perez et al. [1].
14
Figure 2: Estimated global electricity consumption by source, end-2017, reproduced from the Renewable Energy Policy Network for the 21st Century [2].
Solar power has the potential to sustain the world’s energy consumption 1000 times over [1], but current conversion technologies have several key limitations. Two important issues with the most prevalent solar energy technology, direct photovoltaic conversion, are its intermittency and fundamental conversion efficiency limits. This efficiency limit is known as the Shockley-Queisser limit and identifies the maximum possible sun-to-electricity conversion efficiency for a sunlight illuminated single-junction solar cell as around 33%, illustrated in Figure 3. Technologies like multi-junction PV cells seek to exceed this limit, but do so at high cost and complexity. Intermittency can be addressed through methods of electrical energy storage, but few widely available and economical options exist to store utility scale quantities of electrical energy.
Figure 3: Shockley-Queisser fundamental PV efficiency limit at various bandgap wavelengths, including typical cell chemistries’ progress towards the S-Q limit, reproduced from Polman et al. [3].
15
BACKGROUND
1.1.1. Fundamentals of solar thermophotovoltaics (STPV)
Thermophotovoltaic systems (TPVs) are solid-state heat engines capable of converting heat to electricity through the emission and conversion of thermal radiation. These systems can utilize a spectrally selective emitter material heated in excess of 1000°C and capture the radiant emission using a photovoltaic cell. Solar TPVs (STPVs) facilitate the conversion of the full solar spectrum by absorbing sunlight through one surface of an absorber-emitter monolith and emitting a tailored spectrum from a separate emitter surface. This selective emission allows for photovoltaic conversion efficiencies higher than the Shockley-Queisser limit [4] that currently constrains the performance of conventional PV cells directly illuminated with sunlight. These STPV systems have the potential to outperform turbomachinery based power cycles currently utilized by concentrated solar power (CSP) plants in efficiency and reliability. The higher operating temperatures of STPV systems also enable the integration of ultra-high temperature, low-cost thermal storage for on-demand electricity production [5].
A typical photovoltaic cell illuminated by sunlight is performance limited based on the wide range of light wavelengths contained in the solar spectrum. The cell converts a portion of this broadband spectrum into electricity through the photoelectric effect. Through this effect, the energy of an incident absorbed photon excites an electron to the energy of that photon within the cell’s semiconductor structure. If the energy of this electron is above a certain value, known as the cell bandgap energy (Eg), it moves through the cell inducing a current flow. By the time the electron leaves the cell, however, its energy does not exceed the bandgap energy. Any additional energy imparted by the photon is absorbed as heat in the cell through a process known as thermalization. The significance of this process is that whether an incoming photon is highly energetic, or just energetic enough, the excited electron leaves the cell with a constant energy. Figure 4 shows the AM1.5 solar spectrum in light grey with the power able to be extracts when accounting for thermalization in dark grey. The bandgap wavelength of a silicon cell, the most ubiquitous PV cell chemistry, is also indicated. The photon wavelength is inversely proportional to the photon energy, so a bandgap wavelength can also be defined using Eg. The portion of the spectrum indicated in green in Figure 4 is converted efficiently from photons to electrons, the yellow region suffers from inefficiencies due to thermalization, and the red region contains photons that are too low energy to excite electrons enough to leave the cell. By shifting the cell bandgap wavelength higher or lower, the yellow and red regions shrink or grow accordingly. These competing effects are what give rise to the well-known Shockley-Queisser limit on PV cell efficiency, shown in Figure 3.
16
Figure 4: Impact of photon wavelength on photovoltaic conversion effectiveness for direct solar illumination. The yellow highlighted region below the bandgap wavelength of a silicon PV cell represents inefficiency conversion due to photon thermalization losses. The green highlighted portion represents efficient conversion, and the red portion represents low-energy photons that are not converted by the indicated cell chemistry.
Solar thermophotovoltaic devices seek to exceed this limit through the spectral conversion of sunlight. Instead of illuminating the cell with the solar spectrum presented in Figure 4, the selective emitter portion of an STPV system can emit a tailored spectrum with reduced emission in the red region. Figure 5 shows one such example of an emitter heated to 1800 K with suppressed emission at wavelength longer than the bandgap wavelength of a GaSb PV cell. Section 2.2.2 provides more detail on how tailoring the emission spectrum can significantly improve PV conversion efficiency.
Figure 5: Potential emission tailoring enabled by an intermediate spectral converter including GaSb cell chemistry and an emitter at 1800 K. Darker portion represents the electricity generation potential at each wavelength accounting for thermalization of high energy (low wavelength) photons.
λ g, Si (Eg = 1.12 eV) E bb (1800 K) λ g, GaSb cell (Eg = 0.726 eV) Suppressed Emission
17
THESIS OBJECTIVES AND OUTLINE
The objective of this thesis is to perform a quantitative analysis on how geometric and material parameters affect absorber-emitter performance as part of a larger STPV system. The goal is for this analysis to be used to guide absorber-emitter design for future systems and enable higher system efficiencies.
In Chapter 1, we have discussed the motivation for developing more efficient solar energy conversion technologies and the theoretical advantages of solar thermophotovoltaics over traditional direct photovoltaic conversion.
In Chapter 2, we review current approaches to developing high-efficiency STPV systems and propose a geometric solution to a significant parasitic loss. We present a theoretical model that evaluates the impact material and geometric parameters have on absorber-emitter performance.
In Chapter 3, we expand on our geometric solution and propose a shift from a planar-type to cavity-type absorber-emitters. We develop some theoretical and practical design guidelines and discuss some important considerations for materials selection.
In Chapter 4, we examine how thermal gradients within the emitter surface affect the photovoltaic conversion performance. We propose a simple electrical model that can be used to evaluate PV cell performance under a number of illumination profiles.
In Chapter 5, we introduce a laser-based solar emulation apparatus to validate our modelling from Chapter 2 with some preliminary cavity absorber-emitter heating experiments. We also investigate some of the experimental and practical challenges that arise with such a system.
In Chapter 6, we present the results of the cavity characterization experiments using the apparatus described in Chapter 5 and estimate the benefits of including cavity absorber-emitters into previously demonstrated STPV systems.
19
Chapter 2
2. Improving solar thermophotovoltaic system efficiency
STPV LITERATURE REVIEW
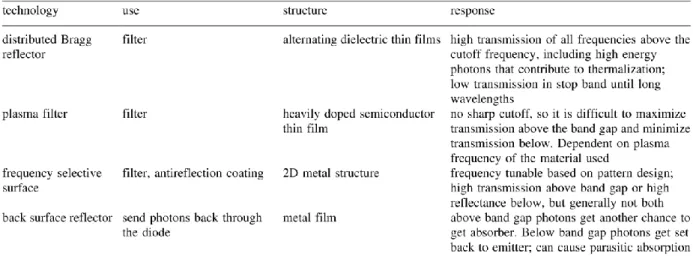
A significant portion of the work on STPVs in the past has focused on the design of spectral selectivity on the emitter side. Work in this area can be generally grouped into three approaches: selective emitters, optical filters, and back surface reflectors. Table 1 summarizes these spectral control techniques and some of the corresponding advantages and disadvantages. There is a significant body of literature on all of these techniques, but this thesis will not focus on the optimization or selection of one of them for a specific application.
Table 1: Comparison of several typical methods of spectral control for TPV, reproduced from Pfiester et al. [6]
Many of the challenges associated with STPV devices arise due to the multi-component, systemic nature of the devices. Recently, there have been several papers that present selective-emitters and reflectors fabricated and incorporated into STPV systems, but these systems have not demonstrated high system conversion efficiencies. Rinnerbauer et al. [7] built an STPV system utilizing a 3D photonic crystal selective emitter and were able to demonstrate a system efficiency of 4.8%. Additionally, Shimizu et al. [8] demonstrated a multi-layer coating of tungsten and yttria-stabilized zirconia and reported an efficiency of 8% based on characterization of their material, however, this efficiency was not experimentally demonstrated. Ungaro et al. [9] also demonstrated a micro-textured tungsten selective emitter within an STPV system and achieved a conversion efficiency of 6.2% using a laser-based simulated solar source. Bierman et al. [10] presented a system utilizing a 2D photonic crystal selective-emitter capable of achieving the highest STPV system efficiency experimentally demonstrated using a broadband solar source. Full system efficiency converting sunlight to electricity was measured to be 6.8% but was predicted to be as high as 9.4% under different operating conditions.
20
Although a majority of the STPV literature focuses on spectral selectivity of the emitted light, there have been several recent papers that focus on the design of different system components. Datas et al.[11] and Vlasov et al. [12] have demonstrated STPV systems utilizing actual concentrated sunlight and implementing absorber-emitter cavities, but reported relatively low system efficiencies of around 1%. From past works we see that there are significant challenges associated with attaining high STPV conversion efficiencies. The remainder of this thesis seeks to break down the full system into intermediate components capable to be analyzed independently. In particular, it seeks to take a new look at system losses other than those associated with imperfect spectral selectivity.
STPV SYSTEM SUB-EFFICIENCIES
Solar thermophotovoltaic devices are typically complex systems with multiple interacting components. At its most simple, an STPV device consists of a solar concentrator, an absorber-emitter, and a PV cell. The total system efficiency can be written as a product of these three component sub-efficiencies
𝜂STPV= 𝜂o𝜂PT𝜂PV (1)
Optical efficiency, 𝜂o, represents how efficiently the concentrating optics focus the incident sunlight to the absorber surface and can be written as
𝜂o≡ 𝑄̇opt
𝑄̇sun (2)
where 𝑄̇sun represents the incident solar power on the concentrating apparatus and 𝑄̇opt represents the concentrated solar power incident on the absorbing surface.
Photothermal efficiency, 𝜂PT, represents how efficiently the incident concentrated sunlight is converted into thermally radiated photons from the emitter surface and can be written as
𝜂PT≡𝑄̇emit
𝑄̇opt (3)
where 𝑄̇emit represents the net power leaving the emitter surface and 𝑄̇sun represents the incoming concentrated solar power.
Finally, photovoltaic efficiency, 𝜂PV, represents how efficiently the emitted light is converted into electricity and can be written as
𝜂PV≡ 𝑄̇elec
𝑄̇emit (4)
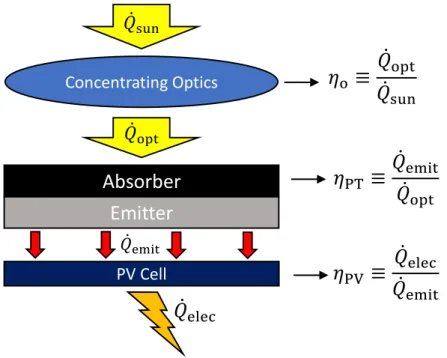
where 𝑄̇emit represents the net power leaving the emitter surface and 𝑄̇elec represents electrical power generated by the PV cell. The definitions of these efficiencies and power variables are clarified in Figure 6.
21
Figure 6: Schematic of a typical planar STPV system identifying system sub-efficiencies, optical efficiency (o) photothermal efficiency (PT), and photovoltaic efficiency (PV).
2.2.1. Optical efficiency
All three of these sub-efficiencies are important, but optical efficiency typically only contributes a small amount to the total efficiency of STPV systems. For the remainder of this thesis, optical efficiency was assumed to contribute negligibly and to be 100%.
2.2.2. Photovoltaic efficiency
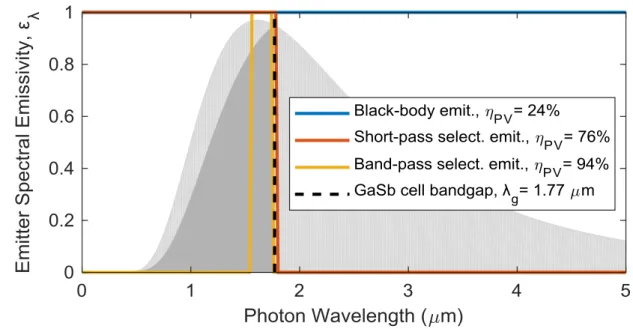
The most significant advantage of STPV systems over a bare PV cell is enhancement in photovoltaic (PV) conversion efficiency due to a carefully tailored emission spectrum. To illustrate this enhancement, Figure 7 shows several thermal emission spectra superimposed over a black-body emission spectrum at 1800 K, light grey shaded region. This temperature closely aligns the peak of emission with the bandgap of a typical STPV photovoltaic cell, gallium antimonide (GaSb), enabling high power densities and minimizing parasitic loss.
Emitter
𝑄̇
sunPV Cell
Absorber
Concentrating Optics
𝑄̇
opt𝑄̇
emit𝑄̇
elec𝜂
o≡
𝑄̇
opt𝑄̇
sun𝜂
PT≡
𝑄̇
emit𝑄̇
opt𝜂
PV≡
𝑄̇
elec𝑄̇
emit22
Figure 7: Theoretical impact of narrowing emission band on PV conversion efficiency for an ideal GaSb (λg=1.77 m) cell illuminated with black-body emission at 1800 K (light grey shaded region). The darker shaded region represents the power capable of being extracted from the PV cell, taking thermalization losses into account. Band width for the band-pass selective emitter is 200 nm.
The darker grey region represents the actual power an ideal PV cell could produce when illuminated with black body emission. To calculate the value of this available power, we can first write the energy of a photon as a function of its wavelength as
𝐸P(𝜆) = ℎ ∙ 𝑐0
𝜆 (5)
where is photon wavelength, h is Planck’s constant, and c0 represents the speed of light in a vacuum [4]. Planck’s law also states that the power emitted at each wavelength by a black-body emitter with a specified temperature is
𝐸bb(𝜆, 𝑇) =
2𝜋ℎ𝑐0
𝜆5(𝑒𝑘ℎ𝑐b𝜆𝑇0 − 1) (6)
where h, , and c0 are the same as in Eq. (5), and kb represents the Boltzmann constant. From Eq. (5) and Eq. (6), we can then calculate the number of photons emitted at each wavelength as
𝑁photons(𝜆, 𝑇) = 𝐸bb(𝜆)
ℎ ∙ 𝑐0 𝜆
(7)
Since photons below the bandgap wavelength (g) each excite one electron enough to leave the cell with the bandgap energy (Eg), we can write the total power produced by an ideal cell as
23
𝑃cell,ideal(𝑇) = ∫ 𝑁𝜆g photons(𝜆, 𝑇) ∙ 𝐸g 0
𝑑𝜆 (8)
In reality, all the photons below the bandgap wavelength do not necessarily excite an electron or even get absorbed by the cell. These effects are typically lumped into a term called external quantum efficiency (EQE), a function of both cell chemistry and non-idealities within the cell. It can be understood as the probability that a sub-bandgap photon hitting the cell actually excites an electron enough to leave the cell and is a function of wavelength as well. Eq. (8) can be modified to include this probability as
𝑃cell,real(𝑇) = ∫ 𝑁𝜆g photons(𝜆, 𝑇) ∙ 𝐸𝑄𝐸(𝜆) ∙ 𝐸g 0
𝑑𝜆 (9)
which gives a more realistic estimate of the power produced by a PV cell. For an ideal cell as modelled in Figure 7, the EQE is assumed to be 1 for all wavelengths below the bandgap wavelength. For reference, Figure 8 shows the EQE values at a range of wavelengths for a PV cell designed for thermophotovoltaic applications.
Figure 8: External quantum efficiency (EQE) values for JX Crystals GaSb PV cells for photon wavelengths ranging from 400 nm to 2 m, reproduced from JX Crystals’ cell specifications datasheet [13].
Returning to Figure 7, the emission spectrum profiles correspond to the portion of the spectrum that is emitted. The black-body emitter will emit the full black-body curve colored light-grey, while the short-pass emitter only emits power below the bandgap wavelength. The band-pass emitter emits power only within a 200 nm band just below the bandgap wavelength. In each of these cases, the efficiency of the PV cell will be different. Pushing emission closer to the bandgap results in the highest level of conversion efficiency and the least amount of thermalization. We can write the PV efficiency for these three cases as
24 𝐵𝑙𝑎𝑐𝑘 − 𝑏𝑜𝑑𝑦 𝑒𝑚𝑖𝑡𝑡𝑒𝑟: 𝜂PV=∫ 𝑁photons(𝜆, 𝑇) ∙ 𝐸g 𝜆g 0 𝑑𝜆 ∫ 𝐸0∞ bb(𝜆, 𝑇)𝑑𝜆 (10) 𝑆ℎ𝑜𝑟𝑡 − 𝑝𝑎𝑠𝑠 𝑒𝑚𝑖𝑡𝑡𝑒𝑟: 𝜂PV=∫ 𝑁photons(𝜆, 𝑇) ∙ 𝐸g 𝜆g 0 𝑑𝜆 ∫ 𝐸0𝜆g bb(𝜆, 𝑇)𝑑𝜆 (11) 𝐵𝑎𝑛𝑑 − 𝑝𝑎𝑠𝑠 𝑒𝑚𝑖𝑡𝑡𝑒𝑟: 𝜂PV=∫ 𝑁photons(𝜆, 𝑇) ∙ 𝐸g 𝜆g 𝜆L 𝑑𝜆 ∫ 𝐸𝜆𝜆Lg bb(𝜆, 𝑇)𝑑𝜆 (12)
where L represents the lower cutoff of the emission band in the band-pass case. The resulting efficiencies for these examples are shown in the Figure 7 legend.
From this ideal analysis, we see that constraining thermal emission band to a narrow band close to the bandgap can result in very high conversion efficiencies. Unfortunately, narrowing the emission band also results in fewer overall photons incident on the cell. This results in a corresponding reduction in power density that can exacerbate the effects of any parasitic loads on the high-temperature emitter. These competing effects would need to be accounted for when designing a complete STPV system.
2.2.3. Photothermal efficiency
Adding the intermediate spectral converter of an STPV device to a PV cell can increase PV efficiency, but also introduces a source of losses. The absorber-emitter is particularly susceptible to a variety of thermal parasitic losses, including convective losses through the surrounding gas, conductive losses through any supporting structure, and thermal re-emission from the absorbing surface. Convective losses are often mitigated by operating in high-vacuum, and may become negligible when operating at very high absorber-emitter temperatures where radiation dominates. Conductive losses through supporting structures can be minimized through careful thermal engineering and low thermal conductivity materials. Thermal re-emission from the absorber, however, is fundamentally challenging to address as both emitter and absorber emission scale equally with temperature. This loss can be significant, and a high photothermal efficiency is very important when designing an STPV system to take full advantage of any benefits in PV efficiency gained through the introduction of the absorber-emitter.
IMPROVING PHOTOTHERMAL EFFICIENCY
The primary difference between STPVs and conventional solar photovoltaics is the presence of the absorber-emitter monolith. The added thermal step of absorption and re-emission introduces opportunities for thermal losses, including radiation emitted from the absorbing surface. Selective absorber materials, which are highly absorptive in the solar spectrum and have low emission in infrared wavelengths, address this problem by suppressing the dominant portion of the re-emission spectrum. However, the durability of these spectrally selective surfaces has not been demonstrated at the temperatures needed for efficient STPV systems (>1000°C) [14]–[17]. While some high-temperature stable absorptive coatings do exist, they are near black (abs ≈ 0.95) at wavelengths from 250 nm all the way to 20 μm [18], encompassing both the solar absorption and infrared emission spectra. When an absorber with one of these coatings is coupled with a
25
spectrally selective emitter (emit < 0.95), the emitted power flux at the absorber surface can exceed that of the emitter, resulting in significant losses. We propose a geometric approach to account for this discrepancy and have developed a model to predict the impact of certain geometric parameters on photothermal efficiency.
2.3.1. Isothermal modelling of approach
By reducing the area of the absorber with respect to the emitter, the fraction of the total emitted power exiting through the absorber can be decreased. To help quantify this relative area difference, we define the area ratio (AR) as
𝐴𝑅 ≡𝐴emit
𝐴abs (13)
where Aabs refers to the area of the absorbing surface and Aemit to the emitter area. To illustrate this approach, Figure 9 shows a thermally isolated absorber-emitter illuminated by concentrated sunlight with a defined absorber emittance (𝜀abs) and emitter effective emittance (𝜀̅).
Figure 9: Schematic of modelled absorber-emitter geometry including relevant variables.
To simplify this example, we can estimate the power leaving a surface via thermal radiation using the standard equation for radiative heat transfer instead of Planck’s law from Eq. (6).
𝑄̇radiation= 𝜀𝜎𝐴(𝑇4− 𝑇∞4) (14) Here, represents the Stefan-Boltzmann constant, A represents the surface area, T is the surface temperature, 𝑇∞ is the temperature of the surroundings, and represents the grey-body emittance of the surface. Using Eqs. (13) and (14), and assuming a high enough operating temperature that the 𝑇∞ term is negligible, the radiative power leaving the emitter and loss from the absorber can be written as
𝑄̇loss= 𝜀abs𝜎𝑇4𝐴
abs (15)
𝑄̇emit = 𝜀̅𝜎𝑇4𝐴abs𝐴𝑅 (16)
where 𝜀̅ represents the diffuse effective emittance of the emitter surface, accounting for any spectral selectivity, and 𝜀abs represents the emittance of the absorbing surface.
𝑄̇opt 𝑄̇loss 𝐴abs 𝜀abs 𝑄̇emit 𝐴emit 𝜀̅ Temit
26
In our modeling, the effect of a selective surface is simplified through the definition of this diffuse effective emittance term, defined as
𝜀̅ ≡𝐸emit
𝐸bb (17)
This ratio of net emitter radiative heat flux (Eemit) to black-body emissive power flux (Ebb) can be modified to account for several forms of spectral shaping including selectivity on the emitter side (i.e. selective emitters), the front surface of the PV cell (i.e., optical filters), or the back side of the PV cell (i.e., back surface reflectors) [6][19]. Eq. (18) shows how effective emittance would be derived for a selective emitter surface with known spectral emittance data, and Eq. (19) shows how the effective emittance would be calculated for a black-body emitter coupled with a spectrally selective filter and perfect view factor. An effective emittance value for more complex emitter-filter interactions with non-unity view factors can be calculated using a ray tracing approach detailed in Leroy et al. [20], but will not be addressed in this thesis.
𝜀̅ =∫ 𝜀𝜆𝐸bb,𝜆𝑑𝜆 ∞ 0 𝐸bb 𝜀̅ =∫ 𝜌filter,𝜆𝐸bb,𝜆𝑑𝜆 ∞ 0 𝐸bb (18) (19)
To understand how the effective emittance (𝜀̅) and area ratio (AR) affect photothermal efficiency, we can write an energy balance on the absorber-emitter with some simplifying assumptions. The most important assumption is that all the surfaces of the cavity are at the same temperature. Based on this assumption, the model is independent of bulk material properties like thermal conductivity and instead depends entirely on geometry and material surface properties (i.e., effective emittance). This energy balance can be written as
𝜀abs𝑄̇opt = 𝑄̇loss+ 𝑄̇emit (20)
This energy balance also assumes that the emittance and absorptance of the absorbing surface are equal, typical for a black absorber.
From Eqs. (3) and (20), we can then write photothermal efficiency as 𝜂PT= 𝜀abs𝑄̇emit
(𝑄̇loss+ 𝑄̇emit)
= 𝜀abs𝜀 ̅𝐴𝑅
𝜀abs+ 𝜀̅𝐴𝑅 (21) We can also make a further simplifying assumption that abs is relatively close to 1 to maximally absorb the concentrated sunlight, and obtain the final form of our photothermal efficiency equation
𝜂PT≈ 𝜀 ̅𝐴𝑅
1 + 𝜀̅𝐴𝑅 (22)
Figure 10 shows the results of the modelling using Eq. (22) for two different emitter surfaces and area ratios ranging from 1 to 100. As predicted, increasing area ratio improves photothermal efficiency, but
27
improvements reach a point of diminishing returns around AR=40. Also plotted are the reported photothermal efficiencies of two recent works on STPV. Bierman et al. [10] implements an area ratio approach to improving photothermal efficiency, achieving some success in improving absorber-emitter performance. Rinnerbauer et. al [7], however, utilizes an absorber-emitter with an area ratio of 1. Another interested finding of this modelling is that the photothermal efficiencies for a black-body emitter are significantly higher than those of the selective emitter for the same area ratio. This behavior touches back on the limitations of narrowing the emission spectrum discussed in Section 2.2.2. By constraining the emission from the emitter surface, the thermal resistance is increased and more heat leaves through the absorber surface.
Figure 10: Isothermal modelling results for photothermal efficiency with respect to area ratio (AR) for both a black body emitter and a short-pass selective emitter (inset) cutoff at the bandgap wavelength of GaSb (1.77 μm). The emitter temperature was assumed to be 1800 K for the effective emittance calculation.
2.3.2. Coupling between system sub-efficiencies
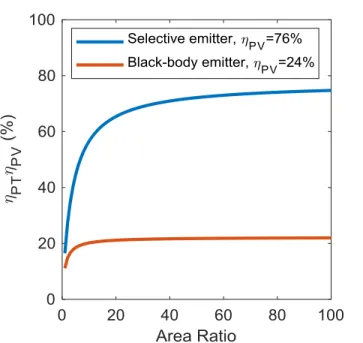
The individual components of STPV devices can be a challenge to optimize independently due to the coupled nature of these systems. From the modelling presented in the previous section, increasing emitter selectivity to improve PV efficiency can have negative effects on photothermal efficiency. To account for these competing effects, Figure 11 shows what the system efficiency might look at various area ratios. A similar improvement with higher area ratios is seen, but the importance of a selective emitter is also apparent. PV efficiencies are calculated using the approach presented in section 2.2.2.
28
Figure 11: Isothermal modelling results for a simplified STPV system efficiency. PV efficiencies were calculated for ideal cells assuming the bandgap of GaSb (1.77 μm), an emitter temperature of 1800 K, and the emission spectra described in Figure 10 (inset) using Eqs. (10) and (11).
SUMMARY
In this chapter, we presented an overview of current approaches to improving STPV system efficiency, and proposed an alternative, geometric solution. We showed an isothermal model capable of estimating the improvements in photothermal efficiency obtained through manipulating the relative areas of the absorbing and emitting surfaces of an STPV absorber-emitter. We also discussed the importance of how optimizing one component or sub-efficiency can have negative effects on other components.
29
Chapter 3
3. Cavity-type Absorber-Emitters for STPV
ADVANTAGES OF CAVITIES
Improving the photothermal efficiency of STPV systems by increasing area ratio shows promise, but with planar geometries as explored in previous works, even low area ratios can generate significant temperature gradients [10]. Utilizing a cavity-type geometry in place of the typical planar geometries has two distinct advantages. Cavities significantly enhance absorber effective emittance and also enable high area ratios without the same thermal gradient issues and cavities. The effect on temperature gradients by switching from a planar to cavity geometry is challenging to model analytically, but section 4 addresses this in more detail.
Assuming diffuse internal reflection, cavities are more absorptive than a flat surface of the same material but are not necessarily black-body absorbers. To account for this, the emittance of the absorbing cavity (𝜀abs) is calculated with a view factor based analysis assuming diffuse reflections, uniform internal illumination from the input optical source, and a cylindrical internal cavity with a flat circular bottom [21]. This emittance can be written as
𝜀abs=
1 + 4𝐷𝐿 1 𝜀 + 4𝐷𝐿
(23)
where the L/D ratio represents the ratio of internal cavity length to diameter and 𝜀 represents the material emittance.
30
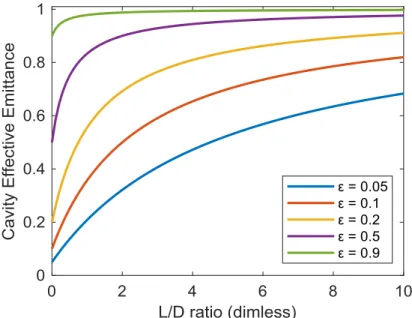
Using Eq. (23), Figure 12 compares cavity absorptance with the L/D ratio for various surface emittances.
Figure 12: Impact of cavity aspect ratio on absorber effective emittance for several surface effective emittances.
At higher L/D ratios, the improvement in emittance between the flat material and a cavity of the same material can be drastic. Highly absorptive coatings often have limitations on maximum temperature and can degrade over time [14]–[17]. A cavity, on the other hand, is made of one monolithic material and as such can be leveraged to provide high absorptance and temperature stability.
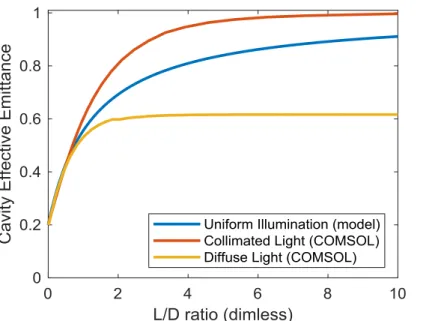
Eq. (23) represents an ideal case where incoming light is uniformly distributed on the interior walls of the cavity. In more realistic scenarios, if the incoming light is diffuse, there will be more illumination towards the opening of the cavity and if the light is collimated, more illumination towards the back. To evaluate the impact of these two optical conditions, we analyzed cavities with a range of L/D ratios and the two optical conditions as well as our ideal case with a COMSOL model. Figure 13 shows these three cases for a surface effective emittance of 0.2; the resulting changes in cavity effective emittance can be significant. Due to this discrepancy, care should be taken when approximating the level of collimation of incoming concentrated light to optimize the design of a cavity.
31
Figure 13: Estimate of the sensitivity of the cavity emittance to incoming light distribution for a surface effective emittance of 0.2. Collimated and diffuse light sources were simulated with COMSOL.
MATERIALS SELECTION
Materials selection is another important consideration when designing a cavity absorber-emitter for an STPV application. With a more complex geometry like a cavity, selecting a material with the ideal characteristics becomes very important. We consider three characteristics to be the most vital: high-temperature stability, high thermal conductivity, and desirable optical properties. Figure 14 compares these characteristics with three broad materials classes we considered for STPV absorber-emitter cavities.
32
When considering high-temperature stability, there are a limited number of materials capable of operating at 1800 K or hotter for extended periods of time. Options are mainly limited to refractory ceramics (i.e. alumina, titania, etc.), refractory metals (i.e. tungsten, tantalum, etc.), and various forms of carbon (i.e. diamond, graphite). An advantage of the refractory ceramics, particularly oxides like alumina, is that they are able to achieve the high operating temperatures in an oxygenated environment, something the metals and carbon compounds are not.
A more restrictive constraint is to have both high-temperature stability, as well as high thermal conductivity. In this category, ceramics are particularly bad. Sintered alumina materials typically have thermal conductivities in the range of 8-34 W/m-K [22] compared to tungsten at around 175 W/m-K [23] and graphite at around 100 W/m-K [24]. Thermal conductivity is particularly important when considering the isothermal assumption made in Section 2.3.1. Any gradients within the absorber-emitter will result in a higher absorber temperature, resulting in additional re-emission losses.
The final selection criterion is the spectral selectivity of the base materials. In this category, the refractory metals are particularly advantageous. Figure 15 shows measured spectral emissivity profiles for graphite and tungsten samples, as well as literature data for tungsten. Immediately apparent is the inherent spectral selectivity of tungsten, which is more emissive in the visible and ultra-violet wavelengths than in the infrared. When considering an STPV system implementing a GaSb PV cell with a bandgap of 1.77 m, the tungsten acts like a weak short-pass emitter enabling high PV conversion efficiencies. Unfortunately, this selectivity becomes less pronounced at higher temperatures but still persists up to the desired operating temperature of 1800 K.
Figure 15: Comparison of graphite and tungsten spectral hemispherical emissivity profiles at 300 K (measured) and 1800 K (literature) [25].
The three materials criteria discussed in this section are by no means comprehensive. When actually designing a full STPV system, other characteristics like thermal shock resistance, evaporation rate, and cost must also be considered.
33
PRACTICAL CAVITY DESIGN CONSIDERATIONS
The previous analyses presented in this thesis have indicated that a higher photothermal efficiency can always be achieved by increasing area ratio. There are, however, practical constraints on how high the area ratio can go. If we re-visit the model presented in section 2.3.1, the optical power term in Eq. (20) can be written as
𝑄̇opt = 𝐶𝐺0𝐴abs (24)
where C is the optical concentration ratio and G0 is the solar irradiance constant, typically assumed to be 1000 W/m2. Eq. (20) can be re-written with the definitions from Eqs. (15) and (16) as
𝜀abs𝑄̇opt = 𝑄̇loss+ 𝑄̇emit (20)
𝜀abs𝐶𝐺0= 𝜎(𝜀abs+ 𝜀̅𝐴𝑅)𝑇4 (25)
Rearranging and again assuming that abs is close to 1, we can write the steady-state absorber-emitter temperature as
The significance of this relationship between area ratio, input concentration, and steady state temperature is illustrated in Figure 16. Commercial solar concentrators are able to achieve a maximum concentration ratio of around 5000x, and only at significant cost [26]. Even with 5000x concentration, an absorber-emitter with a selective-emitter cannot have an area ratio greater than ~40 to operate at 1800 K.
𝑇 = √ 𝜀abs𝐺0𝐶 𝜎(𝜀abs+ 𝜀̅ 𝐴𝑅)
4
34
Figure 16: Equilibrium cavity temperature versus AR at several input solar concentrations. Both emitter emission spectra are detailed in Figure 10 (inset).
SUMMARY
In this chapter, we took a more practical approach to designing an absorber-emitter for high photothermal efficiencies. We identified cavity-based absorber-emitters as an approach to enable high area ratios with minimal thermal gradients, and also considered important material characteristics. Finally, we recognized practical limitations on increasing area ratio based on the current availability of solar concentrators.
35
Chapter 4
4. Thermal Gradients Within Cavity-type Absorber-Emitters
IMPACT OF GEOMETRIC AND SCALE PARAMETERS ON THERMAL
GRADIENTS
The isothermal condition was an important assumption for the previously presented analyses of absorber-emitter performance. In reality, some degree of thermal gradients within either a planar or cavity-type geometry is expected. To estimate how these gradients might scale with the cavity geometric parameters, we performed a scaling analysis on an example cavity. A schematic clarifying the scaled variables is shown in Figure 17.
Figure 17: Schematic for thermal gradient scaling analysis represented as a cross section of an axisymmetric cylindrical cavity with internal diameter D, length L, and wall thickness t.
From the conduction simplification of the 2D heat equation and the coordinate axes shown in Figure 17, we can write
𝜕2𝑇 𝜕𝑥2+
𝜕2𝑇
𝜕𝑦2 = 0 (27)
From this equation, we can associate the wall thermal gradients in the x- and y-directions as ∆𝑇𝑦
𝐿2 ~ ∆𝑇𝑥
𝑡2 (28)
Using Fourier’s law and a uniform internal wall heat flux assumption, the x-direction thermal gradient scales as
𝑞̇~𝑘∆𝑇𝑥
𝑡 (29)
∆𝑇𝑥~𝑞̇
𝑘𝑡 (30)
where 𝑞̇ represents internal wall thermal power flux, and k is the thermal conductivity of the cavity material.
y
x
𝑞̇
t
L
D
36
The y-direction gradient can also be estimated using Eq. (28) and the assumption that 𝑡~𝐷. ∆𝑇𝑦~𝑞̇
𝑘𝐿 ( 𝐿
𝐷) (31)
From this analysis, we see that gradients scale both with a geometric aspect ratio (L/D), the scale of the cavities themselves (L, t), and the (𝑞̇/k) term. To validate this approach, we developed a COMSOL model that evaluated the thermal gradients at two aspect ratios and two scales. To model a more realistic case, the uniform internal wall heat flux was replaced with diffuse optical power at the cavity opening. In the four cases considered, the area ratio, thermal power flux, and thermal conductivity were held constant. The results of this analysis are shown in Figure 18.
Figure 18: Thermal gradients in cavities with different geometries (L/D) and scales (L, t). Incoming light was modelled as diffuse and optical concentration, thermal conductivity, and AR was held constant for all four cases. Temperature is in degrees kelvin (K).
As predicted, both the profile and magnitude of the temperature gradients varied with scale and aspect ratio. Unfortunately, this also means that incorporating thermal gradient minimization into our cavity design guidelines is challenging. To accurately predict how these gradients might develop, we recommend a numerical simulation of the specific scale and geometries considered.
10 mm 10 m
𝐿 𝐷 = 4
𝐿
𝐷
= 6
37
IMPACT ON PV CELL PERFORMANCE
Some degree of thermal gradation can be expected with any cavity design, so an estimate of how these gradients might affect system performance is also important. To this end, we developed an electrical model to predict how PV cell performance might change with illumination from an emitter with non-uniform temperature.
4.2.1. Past work on uneven PV cell illumination
The negative impact of uneven illumination on PV cell performance is not a particularly new problem. The problem has been studied since the 1980s in the context of contact fingers shading certain portions of standard PV cells. Dhariwal et al. [27] presented an analytical model to determine how the voltage of a solar cell might be reduced with partial shading due to contact fingers and found there was an effect, although not significant. Additionally, Franklin et al. [28] investigated how uneven illumination in a concentrated PV context might impact the cell performance. Although the prior work identifies useful approaches to estimating the impact of thermal gradients in and STPV application, the models and results presented are specific to either one illumination profile [27] or one cell chemistry and geometry [28], and do not take the spectral shifting impacts of temperature gradients into account. Illustrated in Figure 19, changes in emitter temperature affect both the intensity and spectrum of emitter light.
Figure 19: Comparison of thermal emission magnitude and spectra at 1800 K and temperatures corresponding to a 50% increase and 50% decrease in emitter power.
4.2.2. PV cell electrical model under uneven illumination
This first order estimate of how an illumination gradient might affect PV performance builds on the methodology described in Dhariwal and Franklin, accounting for internal lateral current flows within the cell and associated resistive losses. Figure 20 illustrates the modelled system, a PV cell illuminated by a thermally non-uniform emitter.
38
Figure 20: Diagram of modelled emitter-PV cell system with an emitter wall ranging from Tmin to Tmax. Vi an Ii represent the local voltage and generated current across the p-n junction for a discrete
slice of a PV cell. Ai represents the vertical cross-sectional area of each slice.
To simplify the model, temperature gradients are only considered in one direction. The cell shown in Figure 20 was discretized into N slices, represented in Figure 21(b) as voltage dependent current sources in parallel with resistors accounting for the bulk material resistance in the lateral and vertical directions. The relationship between local voltage (Vi) and local current (Ii) can be estimated with the typical photovoltaic
cell equation [4], written as
𝐼𝑖 = 𝐴𝑖(𝐽L,𝑖− 𝐽0𝑒 𝑉𝑖
𝑛𝑘𝑏𝑇𝑐𝑒𝑙𝑙) (32)
where dark circuit current density (J0) and n are cell specific constants, kb is the Boltzmann constant, Tcell is the cell temperature (assumed to be constant at 300 K), and JL,i represents the light generated current density.
Also included is the vertical cross-sectional area Ai. This area term is a function of the number of slices as
well as the total length of the cell. JL,i is calculated based on the number of sub-bandgap photons incident
on the discrete slice and is written as
𝐽L,𝑖 = ∫ 𝜆 ∙ 𝑄̇(𝜆)
ℎ ∙ 𝑐0 ∙ 𝐸𝑄𝐸(𝜆) ∙ 𝑞 𝜆𝑔
0
𝑑𝜆 (33)
which is similar in form to Eq. (9), but replaces bandgap energy Eg with q, the charge of an electron, to calculate current instead of energy.
p
n
Thermally emitting surface
+
V
cell-+
V
cell -+ Vi -IiT
maxT
min Ai39
Figure 21: (a) Reference dimensions for discretized slice of PV cell. (b) Simplified circuit diagram of a discretized PV cell accounting for the bulk resistance of both p-type and n-type semiconductor layers.
The resistance terms shown in Figure 21(b) were estimated using simple bulk resistance equations 𝑅1−n=𝜌n𝑡n 𝐴𝑖 (34) 𝑅1−p=𝜌p𝑡p 𝐴𝑖 (35) 𝑅2−n = 𝜌n𝐿𝑖 𝐴2−n (36) 𝑅2−p = 𝜌p𝐿𝑖 𝐴2−p (37)
with dimensional terms clarified in Figure 21(a) and material bulk resistivities (𝜌n and 𝜌p) taken from specific cell properties. The cell properties used in the following analysis are presented in Table 2.
↑
R
1-nR
2-nR
1-pR
2-pI
1↑
R
1-nR
2-nR
1-pR
2-pI
i↑
R
1-nR
1-pI
N+
V
cell-
+
V
i-
n
p
A
2-nt
nL
it
pA
i (a) (b)A
2-p40 Table 2: Cell properties used in PV cell gradient model
Cell Property (units) Value
Chemistry/manufacturer GaSb/JX Crystals
Length (mm) 16 Width (mm) 11 tn (m) 500 tp (m) 700 𝜌n (-cm) 0.012 𝜌p (-cm) 0.08 N 120 (Li = 130 m) n 1 J0 (A/m2) 3.67 x10⁻⁶ Tcell (K) 300
The circuit described in Figure 21 was analyzed using the software LTspice XVII with a netlist generated in MATLAB and cell voltage was swept from 0V to 0.7V in order to obtain I-V curves for the modelled PV cells. Figure 22 presents the result of the analysis, along with the modelled illumination profiles. To isolate the impact of the intensity changes as well as the spectral shift due to emitter temperature gradients, both emitter temperature and illumination intensity were varied independently. Figure 22(c)(e) show the modelled I-V curves for a cell illuminated with four different emitter temperature gradients, detailed in Figure 22(a). All four profiles will result in the same average black-body emitted power flux, and are used to study the response of the PV cell under non-uniformity in both spectrum and intensity. To exclude the effects of the spectral shift, Figure 22(b)(f) show the results of the modelling using the illumination profiles presented in Figure 22(b). These profiles only vary in intensity, not spectrum, and also all have the same black-body emitted power flux. Figure 22(c)(d) are for an ideal cell with an EQE of 1 for all wavelengths, and Figure 22(e)(f) are for a cell with the spectral EQE values shown in Figure 8. For all the cases, emission is assumed to be black-body with a view factor of 1. Also included in Figure 22(b)-(f) are the maximum power point power densities and conversion efficiencies for each modelled profile and cell.
Based on the modelling presented in Figure 22, temperature gradients appear to have some effect on PV cell performance. The impact of the modelled gradients, however, only becomes significantly pronounced with extreme variations in either emitter temperature or illumination. In reality, the gradients developed within an absorber-emitter are likely to most closely resemble the modelled “linear” temperature gradient, which resulted in a 3% absolute (6.5% relative) decrease in PV conversion efficiency for an ideal cell and only a 1.5% absolute (4.4% relative) decrease in efficiency for cell incorporating realistic EQE values. Although this performance degradation is relatively small, we believe it is significant enough to warrant incorporating this gradient model in any absorber-emitter design optimization.
41
Figure 22: (a) Modelled temperature profiles normalized to the average emitted power (T4). (b) Modelled optical intensity profiles normalized to the average optical illumination intensity calculated at 1800 K. (c) I-V curves for an ideal PV cell illuminated with bandgap of 1.77 μm and constant EQE of 1 illuminated with several thermal gradients. (d) I-V curves for the same ideal PV cell illuminated by optical intensity gradient. (e) I-V curves for a similar PV cell, accounting for the EQE values specified in Figure 8, illuminated with several thermal gradients. (f) I-V curves for the same cell as part (e), but illuminated by optical intensity gradients.
(a) (b)
(c) (d)
42
SUMMARY
In this chapter, we investigated whether temperature gradients play an important role in STPV absorber-emitters design. We performed a scaling analysis to determine what geometric parameters contribute to the appearance of gradients in a cavity absorber-emitter, and we developed a numerical model based on previous literature that can estimate performance degradation of a cell under non-uniform illumination. From the results of this model, we estimated an absolute decrease of up to 3% in PV efficiency was expected by illuminating a cell with a significant linear temperature gradient when compared to uniform illumination with the same average power flux. Based on these findings, we suggest that incorporating this PV gradient model into any future design optimization for absorber-emitters would be useful.
43
Chapter 5
5. Experimental Setup and Methodology
EXPERIMENTAL ABSORBER-EMITTER CAVITIES
Section 2.3.1 presented a model predicting the photothermal efficiency of an absorber-emitter as a function of its effective emittance and area ratio. To validate this model and determine if cavity absorber-emitters are a viable option, we fabricated four experimental cavities. The experimental cavity design was guided both by the dimension guidelines set by area ratio and available cell geometry for an eventual STPV system demonstration. Cavities were manufactured with a triangular profile, shown in Figure 23, to maximize external surface area (Aemit) while minimizing wall thickness and cavity length to reduce thermal gradients. Two area ratios (24 and 106) were considered with two of the candidate materials from section 3.2, graphite and tungsten.
Figure 23: Photographs of sample cavities for experiments with two area ratios (AR), 106 and 24, and two materials, graphite and tungsten.
In addition to verifying material viability, the cavity materials selection provided two different surface selective emittances to further validate the modelling. Surface spectral emittance was measured at 25°C with a UV-VIS and FTIR measurement system from 0.25 to 15 μm, shown in Figure 15, and used to calculate effective emittance as a function of cavity temperature.
![Figure 2: Estimated global electricity consumption by source, end-2017, reproduced from the Renewable Energy Policy Network for the 21 st Century [2]](https://thumb-eu.123doks.com/thumbv2/123doknet/14207430.481258/14.918.163.755.107.374/figure-estimated-electricity-consumption-reproduced-renewable-network-century.webp)

![Figure 15: Comparison of graphite and tungsten spectral hemispherical emissivity profiles at 300 K (measured) and 1800 K (literature) [25]](https://thumb-eu.123doks.com/thumbv2/123doknet/14207430.481258/32.918.229.658.600.932/comparison-graphite-tungsten-spectral-hemispherical-emissivity-profiles-literature.webp)
