HAL Id: hal-01060034
https://hal.archives-ouvertes.fr/hal-01060034
Submitted on 2 Sep 2014HAL is a multi-disciplinary open access archive for the deposit and dissemination of sci-entific research documents, whether they are pub-lished or not. The documents may come from teaching and research institutions in France or
L’archive ouverte pluridisciplinaire HAL, est destinée au dépôt et à la diffusion de documents scientifiques de niveau recherche, publiés ou non, émanant des établissements d’enseignement et de recherche français ou étrangers, des laboratoires
Low-cost photomask fabrication using laser ablation
Gérard Legeay, Xavier Castel, Ratiba Benzerga, Arnaud-Gides Moussavou,
Ronan Sauleau, Maryline Guilloux-Viry
To cite this version:
Gérard Legeay, Xavier Castel, Ratiba Benzerga, Arnaud-Gides Moussavou, Ronan Sauleau, et al.. Low-cost photomask fabrication using laser ablation. Journal of Materials Processing Technology, Elsevier, 2015, 216, pp.71-78. �10.1016/j.jmatprotec.2014.08.024�. �hal-01060034�
A
cce
pt
ed
M
an
uscr
ip
t
Low-cost photomask fabrication using laser ablation
G. Legeaya, X. Castela,*, R. Benzergaa, A.-G. Moussavoua,b, R. Sauleaua, M. Guilloux-Viryb a
Institut d’Electronique et de Télécommunications de Rennes, IETR / UMR 6164 / Université de Rennes 1, 18 rue Henri Wallon 22004 SAINT-BRIEUC, & 263 avenue du Général Leclerc 35042 RENNES, FRANCE
*
Corresponding author. E-mail: [email protected]. Phone: (33) 296 609 653. Fax: (33) 296 609 652
b
Institut des Sciences Chimiques de Rennes, ISCR / UMR 6226 / Université de Rennes 1, 263 avenue du Général Leclerc 35042 RENNES, FRANCE
Abstract
A specific fabrication process has been developed to produce low-cost photomasks using standard consumer products. This process is based on an indirect route, using a numerically-controlled excimer laser (KrF) etching technique. It begins with RF-sputtering deposition of a titanium film (200 nm-thick) on float glass substrate. Then a nitrocellulose lacquer, serving as a self-developing resist, is spin-coated on titanium. It is ablated with partially-overlapping laser impacts and undergoes self-combustion under laser beam. Proper heat treatments are applied before and after laser ablation to circumvent smearing and adhesion problems. Finally the titanium layer is wet etched through the openings in the resist by dilute hydrofluoric acid. Both nitrocellulose lacquer characterization and laser parameters are discussed. The resolution achieved here (10 µm, limited by diffraction effects of the laser optics and by side heating of the resist due to the titanium film) is suitable for the fabrication of microwave devices.
To confirm the suitability of the proposed process, several photomasks have been fabricated to pattern coplanar tunable stub resonators on ferroelectric KTa0.5Nb0.5O3 thin
A
cce
pt
ed
M
an
uscr
ip
t
1. IntroductionFor the past 30 years, laser processing has drawn greater attention in the microelectronic industry for various applications such as thin film deposition, laser direct writing, laser photolithography and circuit repairing by local removal of material (Bäuerle, 1984; Budin et al., 1989). The critical dimensions of thin-film hybrid electronic microcircuits and microwave circuits / antennas are often much larger than tens of micrometers and require fabrication accuracy in the range of a few micrometers. Such features are extremely easy to achieve using classical semiconductor fabrication technology (Kim et al., 2008; Kim et al., 2009) based on a mask aligner and rigid photomasks. The latter are made of thin chromium film with high cohesion strength deposited on borosilicate glass or fused quartz (Wang et al., 2012). However the use of such rigid photomasks requires their fabrication in micro or nanotechnology center (Hayden and Dalton, 2010). This way may be a costly and a lengthy process before starting the fabrication of the microwave circuits and antennas themselves. That is why we propose a home-made technique based on an indirect route to fabricate low-cost photomasks on conventional glass substrates such as soda-lime float glass. We report here how excimer laser ablation helps in fabricating suitable masks using low-cost consumer products.
The paper is organized as follows. The proposed fabrication process is described in Section 2. The lacquer characterization and the laser writing process are discussed in Section 3. Finally a frequency tunable device operating in X-band is fabricated using such a photomask. Performance at microwaves is given in Section 4. Conclusions are drawn in Section 5.
2. Fabrication process
Metal nature has only a little influence on its opacity at 365 nm (conventional wavelength used in photolithography process). A 200 nm-thick metal film deposited on glass
A
cce
pt
ed
M
an
uscr
ip
t
direct ablation of metal films deposited on glass substrates. The removal process of such films is explained by a combination of three physical mechanisms, namely: pure vaporization, solid phase explosive removal, and a two-phase removal/partial vaporization and subsequent liquid expulsion (Lee and Na, 1999; Liu and al., 2004).
Femtosecond lasers provide useful results in metal film direct ablation due to their advantages in high spatial resolution and small heat-affected zone (Lee et al., 2007). Hayden
and Dalton (2010) (Ti:sapphire; wavelength O=800 nm; pulse duration W =100 fs), and Venkatakrishnan et al. (2002) (Ti:sapphire; O=400 nm (second harmonic); W =150 fs) report direct patterning of 150-200 nm-thick gold-chromium bilayers deposited on quartz substrate. Metal films have been cleanly removed after laser parameter optimization, with good edge quality and without damaging the underlying substrate. This high-quality of metal film ablative removal has also been applied by Lieberman et al. (1999) for high-resolution photomask repair (photomask made of a 100 nm-thick chromium film deposited on quartz
substrate) by using a femtosecond laser (O=260 nm (third harmonic); W unspecified). Hermann, Benfarah, and Coustillier et al. (2006) also report selective or complete ablation of zinc oxide, cadmium sulfide, copper indium selenide (CIS) and molybdenum
micrometer-thick multilayers by femtosecond laser pulses (Ti:sapphire; O=800 nm; W =100 fs) without damaging the efficiency of the photovoltaic device built from these heterostructures. Direct ablation of such heterostructures under vacuum (10-4 Pa residual pressure) also restricts the backscattering of ejected particles (Hermann, Benfarah, and Bruneau et al., 2006).
Nanosecond lasers also provide useful results, even though the precision of metal laser removal is limited by the thermal heat diffusion in nanosecond regime (Hermann, Benfarah,
A
cce
pt
ed
M
an
uscr
ip
t
established on a thinnest metal film (100 nm-thick chromium film deposited on glass substrate), but they also notice the presence of a few micro-sized metal droplets inside and outside the ablated area.
When using a photomask, UV light (365 nm) has to pass through the openings in the metal mask printed on glass substrate without incurring diffraction, diffusion or/and absorption phenomena due to defects onto glass surface. Under our own practical experience,
it was difficult with our laser facility (nanosecond excimer lasers: KrF; O=248 nm; W=20 ns and XeCl; O=308 nm; W=15 ns) to cleanly remove a 200 nm-thick titanium film deposited on a soda-lime float glass substrate for the following reasons:
- at high fluence F (laser beam energy per unit area higher than 4 J.cm-2), the aerial image carried by the laser beam is distorted by interaction with the plume of ejected material (see Figures 1a and 1b) with a plasma screening phenomenon (Craciun and Craciun, 1995).
- even with high laser fluences, there is some melting of metal that collects into balls (micro-sized titanium droplets) which are very hard to remove (Figure 1b);
- once the metal layer removed, the surface of the soda-lime float glass substrate is damaged (Figures 1a and 2) which is unacceptable for our intended photomask application.
Fig. 1. 200 nm-thick titanium film coated with a nitrocellulose lacquer after 3 shots of
(a) (b)
A
cce
pt
ed
M
an
uscr
ip
t
excimer laser beam at O=248 nm, F=4.2 J.cm-2, W=20 ns. Note the distortion of the aerial image on the edges of the ablated surface: scanning electron microscope observation (a); light microscopy observation (b). Note also the cracking of the soda-lime float glass substrate (a) and the presence of titanium droplets inside the ablated surface and outside (open circles, (b)).
Fig. 2. Top view of crossing lines engraved directly by excimer laser on a 200 nm-thick titanium film deposited on soda-lime float glass substrate (O=308 nm, F=8.4 J.cm-2,
W=15 ns, 4 to 6 shots per point). Note the cratering of the substrate surface and the raveling of glass shards (scanning electron microscope picture).
This explains why an indirect route has been developed here to fabricate the suitable photomasks: coating a lacquer on a 200 nm-thick titanium film, local ablation of the lacquer at low fluence, and wet etching of the metal through the openings in the lacquer. Titanium metal (Ti) has been selected in this study for its outstanding hardness and high adhesion on glass. Moreover, Ti etching in dilute hydrofluoric acid (HF, acid with non-oxidizing anion) is compatible with a very thin organic resist. Previous works have shown that nitrocellulose acts
as a self-developing resist under irradiation of KrF laser (O=248 nm; W unspecified) (Deutsch and Geis, 1983); ArF laser (O=193 nm; W =10 ns) (Deutsch and Geis, 1983; Geis et al., 1983) or F2 laser (O=157 nm; W =5 ns) (Henderson et al., 1985). Nail polish formulations are based
A
cce
pt
ed
M
an
uscr
ip
t
2.1. Titanium sputtering and wet etching process
A standard 2 mm-thick soda-lime glass is cut into 109 mm u 109 mm substrates, and cleaned in an alkaline lye for 10 min at 60°C (Traitements Chimiques de Surface, RBS 25, diluted to 15% (v/v) in water). A 200 nm-thick Ti film is then sputtered in a RF-diode system (Plassys, MP 450S) fully described in Colombel et al. (2009). A RF power density of 3.4 W.cm-2 is used on the target; the argon working pressure is 1.1 Pa, and deposition time is 10 min. As the substrate is located above the target in this system, only very few defects appear due to dust.
Once the resist has been patterned, the Ti layer is etched in 3 % HF (v/v) at room temperature. To insure proper wetting on the metal film, 0.07% (w/w) of a fluorinated surfactant (polyfluorosulfonic acid: Dupont, Forafac 1033) is added in the solution.
2.2. Making up and coating the lacquer
Nitrocellulose lacquer is diluted to 19 % (w/w) in ethyl acetate and spin-coated (Chemat Technology, KW-4A) on the metalized substrate (10 s at 550 rpm + 30 s at 5500 rpm). There is no cobwebbing. Then the sample is dried 1 hour by baking in an air oven at 150°C. The final thickness (Fig. 3) varies from 0.3 µm to 0.5 µm.
Fig. 3. Lacquer coating on a cleaved substrate (scanning electron microscope picture).
lacquer substrate
A
cce
pt
ed
M
an
uscr
ip
t
2.3. Excimer laser and workstation
A LPX 120 excimer laser from Lambda Physics has been used for this study (KrF;
O=248 nm; W =20 ns, maximum repetition rate: 200 Hz). Fig. 4 represents a schematic diagram of the Optec workstation. The laser beam hits an adjustable aperture AB, and a projection lens forms a reduced image A'B' on the sample. The demagnification ratio
Rd=AB/A'B' can be tuned from 2 to 11. The laser fluence at the sample level is fixed by the
following parameters: (i) voltage command of the laser, (ii) Rd², and (iii) beam attenuator. The
X-Y tables range is 100 mm u 100 mm, with an overall accuracy of 2 µm. The X-Y tables and
the laser pulses are controlled numerically. Laser pulses can be fired either once the tables stopped (static mode), or "on the fly" (dynamic mode).
Fig. 4. Excimer laser and workstation, schematic diagram.
Because of the rounded corners of rectangular images, complex geometries cannot be printed just by paving the film. The technique described in Fig. 5 can be used "on the fly". It
projection lens X-Ytables sliding mirors laser adjustable aperture sample attenuator A B B' A'
A
cce
pt
ed
M
an
uscr
ip
t
Fig. 5. Line printing, overlapping in dynamic mode.
2.4. Means of characterization
Sample surface morphology is investigated with a Light Microscope Leica DMLM and a Scanning Electron Microscope (SEM, Jeol 5600) operating at 10 kV. Film thickness is measured by profilometry (Taylor Hopson, Talystep 100) and by SEM on a cleaved cross-section. Lacquer drying and burning are investigated by Differential Thermal Analysis coupled with Thermo-Gravimetric Analysis under nitrogen flow on a TA Instrument STD 2960 (scan rate: 1°C.min-1). Differential Thermal Analysis (DTA) is used to determine exothermic or endothermic change (crystallization, melting or sublimation) in material during a thermal cycle. Thermo-Gravimetric Analysis (TGA) is commonly used to determine mass loss or gain of material (decomposition, oxidation, or loss of volatile solvents) during a thermal cycle. For this, a crucible filled with the material under test and an inert reference (empty crucible) undergo a thermal cycle. The temperature and mass changes between sample and reference are recorded as a function of temperature. Optical transmittances are recorded on a Perkin Elmer Lambda 20 UV-visible spectrometer (2 nm-width slit and scanning speed: 240 nm.min-1) in the spectral range of 200-1100 nm at normal incidence. The UV-visible spectrophotometer is previously calibrated with air (blank).
3 2 1 shot number x window stacking
A
cce
pt
ed
M
an
uscr
ip
t
3. Lacquer characterization and laser writing process
3.1. Lacquer characterization
A 25.8 mg sample of undiluted lacquer has undergone DTA-TGA analysis (Fig. 6). At temperatures below 100°C, the volatile solvents evaporate quickly. Then the mass loss slows down between 100°C and 150°C. The quick mass loss from 150°C and the exothermic peak at 169°C come from autocombustion of the nitrocellulose component of the lacquer (Furutani et al., 1998). Less volatile components leave above 250-300°C. Some percents of coal-like residues remain in the crucible at 520°C. Autocombustion takes place because the nitrocellulose molecule contains both the fuel and the oxidizer. This complete combustion explains also why no soot falls back near the laser impact, as seen later in ablation experiments (§ 3.2.).
Fig. 6. DTA-TGA analysis of the lacquer, 1°C.min-1, N2 flow.
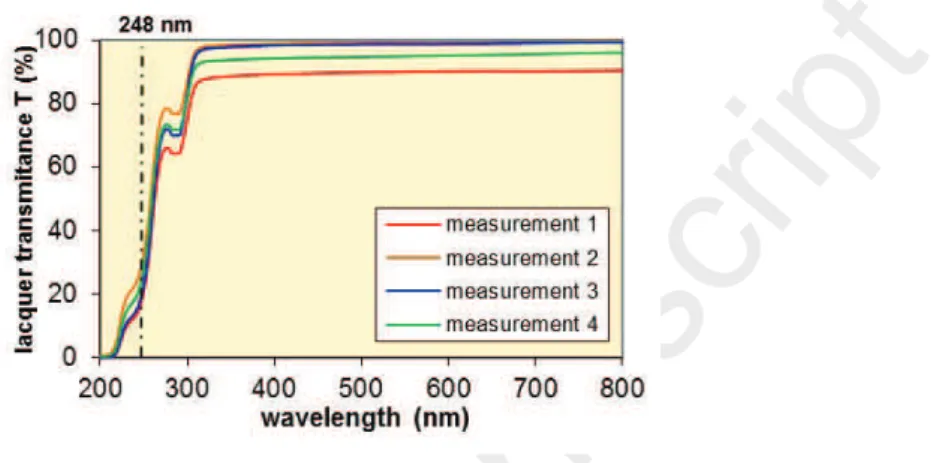
Fig. 7 shows the transmittance spectra T (corrected for the substrate transmission) of a 150°C baked lacquer film. Dispersion comes from thickness variations of the lacquer.
A
cce
pt
ed
M
an
uscr
ip
t
Therefore the used consumer lacquer is more UV absorbing that pure nitrocellulose. Probably other components added to its formulation act as sensitizer dyes (Furutani et al., 1998) - see the appendix for the qualitative composition of the consumer lacquer.
Fig. 7. Dispersion in transmission spectra on a 150°C backed lacquer sample.
3.2. Lacquer ablation over large areas
Firstly the importance of the baking temperature must be highlighted. When the lacquer is baked at a low temperature of 115°C, laser impacts throw many splashes out of the image. In addition, droplets of molten lacquer are seen to flow back into the ablated area. As shown by TGA analysis, a large part of solvents is vaporized by a 150°C baking. Nevertheless the lacquer film still melts when heated at 150°C, while it is more viscous as it contains a higher resin amount. Therefore during the ablation pulse and for a short time after, the lacquer actually melts at the edge of the image, but there is less splashes, and reflow is suppressed (Fig. 8-a).
A
cce
pt
ed
M
an
uscr
ip
t
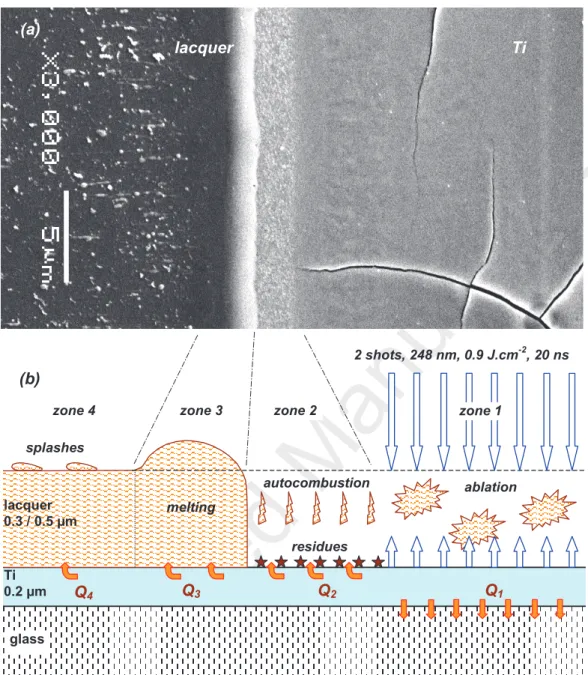
Fig. 8. Lacquer ablation on a Ti film, 2 shots, O=248 nm, F=900 mJ.cm-2, SEM picture (a) and schematic diagram (b).
Fig. 8 shows the lacquer ablated by two shots at F=900 mJ.cm-2. This fluence is somewhat too high because Ti has flaked off, and even begins to melt in places. However
zone 2 zone 3 zone 4 ablation autocombustion melting residues splashes 2 shots, 248 nm, 0.9 J.cm-2, 20 ns Q2 Q1 Q3 Q4 Ti 0.2 µm glass lacquer 0.3 / 0.5 µm zone 1 lacquer Ti (a) (b)
A
cce
pt
ed
M
an
uscr
ip
t
reflected by the Ti film and can be absorbed on the way back. Thus the first shot nearly ablates the whole lacquer layer. Ti film does not crack after only one shot. The bare Ti layer is then exposed to the second shot. It heats quickly and goes to a high temperature. Stored heat drains off mainly to the glass substrate (Q1 on the sketch in Fig. 8). Another part (Q2 + Q3 +
Q4 in Fig. 8-b) leaks to unexposed zones by lateral thermal conduction in Ti. With a lumped capacitance model described by Incropera and DeWitt (1996), Ti cooling time has been
computed around trd1 ms (Legeay, 2011). This rough thermal cycle causes cracking and local
delamination of the Ti film.
- In the second zone of Fig. 8 (~2 µm wide along the spot edge), the lacquer leaves some residues. They look like the final residues after the TGA analysis. These do not form a dense and continuous layer. Therefore HF solution actually etches Ti through. We suggest that the laser beam does not light this zone. The lacquer receives enough heat Q2 via the Ti film to melt and to reach its autocombustion temperature (~170 °C, cf. § 3.1). As autocombustion is exothermic, temperature raises still higher. The whole lacquer vaporizes, except residues. - In the third zone (~3 µm wide), the lacquer only melts. Surface tension builds an edge bead. Melting occurs in this zone at the first shot, but the border clearly moves back at the second shot (1.5 µm to 2 µm). No more significant recoil is noticed here with further shots. As the aerial image does not change from one shot to the next one, melting must come from indirect heating of the lacquer via the Ti film (heat transfer Q3).
- On the outside (zone 4), ejected droplets show that, far from the lighted spot (t 5 µm), the lacquer layer does not reach a temperature high enough to allow melting and smoothing. Among splashes, we do not notice any back scattered soot.
Fig. 9 shows the edge of a line etched with F=490 mJ.cm-2 in the dynamic mode as described in Section 2.3. Each point along this line has been hit by 4 to 6 shots (by caution to guarantee the complete process). Thus a laser fluence close to 500 mJ.cm-2 seems well suitable. Indeed it allows ablation of 0.3 to 0.5 µm-thick lacquer by a single shot. There is no
A
cce
pt
ed
M
an
uscr
ip
t
more Ti crack. Working at O=193 nm, Deutsch and Geis (1983) noticed a non-linear ablation speed for pure nitrocellulose. They obtained a maximum efficiency for one Joule close to 500 mJ.cm-2.
Fig. 9. Dynamic etching of lacquer on a Ti film, 4 to 6 shots, O=248 nm, F=490 mJ.cm-2. Note the presence of some residues of the lacquer after autocombustion at the top left and the
Ti film surface at the top right (SEM picture).
3.3. Resolution limit in lacquer ablation
Adjustable aperture AB is significantly closed up to etch narrow lines, at least in one dimension. Fig. 10 shows line widths obtained by optimizing both the AB slit opening and laser beam energy (different line widths for each opening come from different energy tuning). Trying to reduce the line width below 8-9 µm, closing the slit actually enlarges the width of the printed line. Such behavior is typical of a diffraction phenomenon. The image projection lens in our workstation (24 mm-diameter) has not been designed for a better resolution.
Ti
A
cce
pt
ed
M
an
uscr
ip
t
Fig. 10. Resolution of lacquer ablation, Rd=7.5,O=248 nm.
The photomontage in Fig. 11 shows lacquer etched by a series of static shots. Slit
opening changes of r0.02 mm on b and c lines (i.e. ~r 2.5 µm u Rd) around a critical value on
a line.
Fig. 11. Ablated spots by changing AB slit opening, b: +0.02 mm, c: -0.02 mm; 1, 2, 6 shots,
O=248 nm, Rd=7.5 (light microscope picture).
Geometric rectangular images are heavily distorted. Again slit closing widens the image. Moreover this time for all spots ablated in Fig. 11, the settings of the laser energy, of the attenuator and of the reduction factor Rd have been kept constant, same as those giving
F=900 mJ.cm-2 on large areas. Unfortunately fluence computation makes no more sense for
5 10 15 20 25 0.04 0.06 0.08 0.10 0.12 0.14 0.16 0.18 AB slit opening (mm) p ri n te d w id th ( µ m
) dynamic modestatic mode theoretical
b1 b2 b6
a1 a2 a6
A
cce
pt
ed
M
an
uscr
ip
t
these tiny spots. Partial ablation obtained on c1, c2, and Ti melted on b2, b6, show that actual energy distribution in the spot results:
- from the fact that a wider slit opening allows more energy to get through, without enlarging the image;
- from stacking or spreading of diffraction fringes from each edge (depending on the actual tuning of the optical system).
Then the longitudinal opening also changes the total energy amount in the spot and its lateral distribution. It acts too on widths of the image and of the ablated spot. On the other hand, as noticed earlier, lateral thermal diffusion in Ti allows the lacquer to reach its autocombustion temperature nearer or further from the edge of the aerial image, depending on the total energy in the spot (compare a6 and b6 in Fig. 11).
Thus near the resolution limit, tuning of the laser etching becomes tricky and difficult to foresee because of numerous interdependent parameters (that explains dispersion in results shown in Fig. 10). Consequently fine lines etching has been optimized empirically. For tuning the fluence, we rely on the appearance of Ti film after ablation. By aiming the beginning of Ti film cracking, we avoid local lacquer ablation failures while restricting Ti melting. Such a tuning is reproducible. Under our experimental data, laser fluence close to 500 mJ.cm-2 with 4 to 6 shots per point is a good trade-off and despite the poor quality of statically ablated spots, windows overlapping in the dynamic mode allows to engrave lines with a good resolution (Fig. 12). It is also possible to work at higher fluence. In that case, a single shot can ablate a lacquer thickness greater than 0.3 – 0.5 µm, but may even result in Ti film flaked off, mainly in dynamic mode.
A
cce
pt
ed
M
an
uscr
ip
t
Fig. 12. Top view of the line (9 µm wide) etched in the lacquer (SEM picture).
3.4. Lacquer postbake
Once the designed pattern written, if Ti is wet etched directly, a rapid and uneven undercutting develops under the lacquer. Some notches form on dusts or on small local defects. These problems are due to a poor adhesion of the lacquer near the line edges. In
separate laser ablation experiments at O=308 nm (Legeay, 2011), we have shown that heating of the lacquer via the Ti film (heat transfer Q3 in Fig. 8-b) could lift the line edges by a brutal vaporization of residual solvents.
One hour annealing step at 150°C in an oven in air, between lacquer ablation and Ti etching, restores a strong lacquer adhesion on the metal film. Fig. 13 shows a line edge after such a post-annealing. Comparing with Fig. 9, droplets thrown outside the pattern have disappeared by heating. This shows that the lacquer has undergone a liquid stage, enabling a new adhesion on the Ti film. By annealing, the edge bead sinks a little bit and the border moves back towards the line center. The etched line width decreases of about 1 µm (photomontage, Fig. 14).
Ti lacquer
A
cce
pt
ed
M
an
uscr
ip
t
Fig. 13. Ablated line edge, O=248 nm, F=505 mJ.cm-2, annealed 150°C, 1 hour (SEM picture).
Fig. 14. Lines etched in the lacquer, before and after postbake 150°C, 1 hour (light microscope picture).
3.5. Lacquer stripping
After annealing at 150°C, the lacquer becomes insoluble in current solvents. Two ways to strip it have been investigated:
28 µm
9 µm 8 µm
as ablated annealed
Ti
A
cce
pt
ed
M
an
uscr
ip
t
- the lacquer is completely cleaned in a 300 mm Reactive Ion Etching system (Nextral, NE 110). Pure oxygen flow is 50 sccm, pressure 1.33 Pa, and RF power 100 W. Stripping needs about 1 min. Ti film is not damaged by 3 additional minutes in the plasma. Optical density remains higher than 4. Such plasma etchers are currently available in many laboratories.
4. Experimental validation
4.1. Writing and optimizing programs for the workstation
Line number of program and running time increase with the lacquer area to ablate. With the technique described here, applications such as lithographic masks for coplanar waveguide structures are of great interest. They are made of fine clear lines between metal areas (the latter corresponding to transmission lines and ground planes in complete devices). We report briefly an example of such home-made photomasks (Fig. 15), and how we have used them to fabricate coplanar tunable stub resonators (Moussavou et al., 2007 and 2008).
Fig. 15. Ti photomask for X-band frequency tunable coplanar stub resonators (a); enlarged details: (b) and (c) (light microscope picture).
10 mm 18 µm 10 µm 10 µm (a) (b) (c)
A
cce
pt
ed
M
an
uscr
ip
t
x and y dimensions of the smallest spot ablated in lacquer are imposed by the smallest
line widths of the designed mask (in each direction). In example Fig. 15, we use x=45 µm and
y=9 µm. This light pencil helps to build up the functional pattern. Firstly line segments are
etched, then (when needed) new segments are etched alongside the firsts (with 3 µm-overlapping) to build wider lines along x or y. The dynamic mode is used (each point is hit by 4 to 6 shots with a fluence of 500 mJ.cm-2), except in tricky places such as the stub end (Fig. 15-c). However covering large areas with a small pencil needs a prohibitive running time. Thus we use a wider window for external clearances with a specific program.
4.2. Test device
Thin films of KTa0.5Nb0.5O3 (KTN) are pulsed laser deposited (PLD) on R-plane
sapphire. Further details are reported elsewhere (Rousseau et al., 2008). They have been coated with a 2 µm-thick sputtered copper film. A coplanar waveguide (CPW) quarter-wavelength open-ended stub resonator has been designed to operate at 10 GHz (X-band) using
a 3-D commercial electromagnetic software (Ansoft HFSS), and masks are patterned. Then the copper films are etched by classical photolithography and using photomasks as the one shown in Figs. 15b and 15c.
KTN is a ferroelectric material. Therefore its dielectric permittivity Hr is monitored by
an external DC electric field Ebias (Simon et al., 2011). Thus for this kind of device, the resonance frequency is tuned by biasing applied across the gaps etched in the copper film (between the stub and the ground planes, Fig. 16) (Moussavou et al., 2008; Simon et al., 2011). Biasing up to 120 V is applied on 16 µm-width gaps, leading to a maximum biasing
A
cce
pt
ed
M
an
uscr
ip
t
Fig. 16. Bottom of the copper stub resonator etched on a KTN film (SEM picture).
5. Conclusion
Direct laser ablation of metal thin films deposited on glass substrate can be achieved with high quality. Nevertheless this requires the use of ultrashort lasers or/and specific facility not available at the moment in our laboratory. This explains why we develop an indirect route to fabricate low cost photomasks from consumer products. This adaptive process is well suited for medium resolution electronic devices. Titanium has been chosen as an opaque layer. A nitrocellulose lacquer (nail polish) acts as a self-developing resist for chemical etching of Ti. The worked out process is summarized in the diagram shown in Fig. 17. Successful application to a coplanar tunable microwave device has been reported. This work demonstrates a fast, cheap and versatile way to make prototypes of electronic devices.
ground plane
stub
A
cce
pt
ed
M
an
uscr
ip
t
Fig. 17. Process diagram for resonator photomasks.
Some improvements could be considered, such as a better thickness uniformity of the lacquer (by a clever choice of the thinning solvents). A fused quartz substrate could help to reduce the exposure time when using the photomask. Indeed although at a higher cost, diffraction problems could be significantly reduced by improving the optical design and the lens diameter in the workstation. Nevertheless even with a well-resolved aerial image, lateral thermal diffusion via the metal film would still limit the final resolution to a few micrometers.
Acknowledgements lacquer thinning 19% EtAc glass substrate cleaning, RBS sputtering Ti 200 nm spin coating 5500 t/mn oven bake 1 h 150°C XMR ablation 248 nm (2 prog.) postbake 1 h 150°C Ti etching HF 3% microscope check lacquer stripping Remover 80°C programs validation programs writing laser & slit tests & tuning
layout analysis
A
cce
pt
ed
M
an
uscr
ip
t
Appendix: lacquer formulation
Table 1 lists the nail lacquer components as they are printed on the blister. CAS number and/or a reference number from Haynes (2012-2013) are added. A tentative function is suggested for each component, from Le Flacon (2014).
Table 1
Qualitative lacquer formulation.
Component Handbook
ref.
CAS number Function
Nitrocellulose film former
Phtalic anhydride 7342 85-44-9 film former
Glycols copolymer film former
Ethyl acetate 186 141-78-6 solvent
Isopropyl alcohol 10335 67-63-0 solvent
Aqua solvent
Butyl acetate 121 123-86-4 solvent
Butylene glycol 3346 107-88-0 solvent Trimellitic anhydride 7341 552-30-7 esterification,
plasticizer Acetyl tributyl citrate 77-90-7 plasticizer Glyceryl linoleate (linoleic ac.:) (8223) (2277-28-3) emollient, emulsifier Glyceryl linolenate (linolenic ac.:) (8287) (18465-99-1) emollient, emulsifier Benzophenone-3 2771 31766-07-1 UV absorber Tocopheryl acetate 2788 58-95-7 antioxidant
Chondrus Crispus gelling agent
A
cce
pt
ed
M
an
uscr
ip
t
ReferencesBäuerle, D., 1984. Laser processing and diagnostics, Springer ed., Berlin, 39.
Budin, J.P., Boulmer, J., Débarre, D., 1989. Laser-assisted processes in the microelectronic industry. Thin Solid Films 175, 109-118.
Colombel, F., Castel, X., Himdi, M., Legeay, G., Vigneron, S., Motta Cruz, E., 2009. Ultrathin metal layer, ITO film and ITO/Cu/ITO multilayer towards transparent antenna. IET Sci. Meas. Technol. 3, 229-234.
Craciun, D., Craciun, V., 1995. Wavelength dependence in pulsed laser deposition of ZnO thin films. NATO ASI Ser. E Appl. Sci. 284, 67-74.
Deutsch, T.F., Geis, M.W., 1983. SelfǦdeveloping UV photoresist using excimer laser exposure. J. Appl. Phys. 54, 7201-7204.
Furutani, H., Fukumura, H., Masuhara, H., Kambara, S., Kitaguchi, T., Tsukada, H., Ozawa, T., 1998. Laser-induced decomposition and ablation dynamics studied by nanosecond interferometry. 2. A reactive nitrocellulose film. J. Phys. Chem. B 102, 3395-3401.
Gabran, S.R.I., Mansour, R.R., Salama, M.M.A. 2012. Maskless pattern transfer using 355 nm laser. Opt. Lasers Eng. 50, 710-716.
Geis, M.W., Randall, J.N., Deutsch, T.F., DeGraff, P.D., Krohn, K.E., Stern, L.A., 1983.
SelfǦdeveloping resist with submicrometer resolution and processing stability. Appl. Phys. Lett. 43, 74-76.
Hayden, C.J., Dalton, C., 2010. Direct patterning of microelectrode arrays using femtosecond laser micromachining. Appl. Surf. Sci. 256, 3761-3766.
Haynes, W.M., 2012-2013. Handbook of Chemistry & Physics, 93rd ed., CRC Press LLC, Inc. Boca Raton.
A
cce
pt
ed
M
an
uscr
ip
t
Hermann, J., Benfarah, M., Coustillier, G., Bruneau, S., Axente, E., Guillemoles, J.-F., Sentis, M., Alloncle, P., Itina, T., 2006. Selective ablation of thin films with short and ultrashort laser pulses. Appl. Surf. Sci. 252, 4814-4818.
Incropera, F.P., DeWitt, D.P., 1996. Introduction to Heat Transfer, J. Wiley & sons (Eds.), Inc. New York.
Kim, K.S., Lee, K.N., Roh, Y., 2008. Formation of nanometer-scale structures using conventional optical lithography. Thin Solid Films 516, 1489-1492.
Kim, H.S., Ahn, S., Kim, D.W., Kim, Y.C., Ahn, S.J., 2009. Photo-mask fabrication by low-energy microcolumn lithography. Microelectron. Eng. 86, 2049-2052.
Lee, S.K., Na, S.J., 1999. KrF excimer laser ablation of thin Cr film on glass substrate. Appl. Phys. A. 68, 417-423.
Lee, S., Yang, D., Nikumb, S., 2007. Femtosecond laser patterning of Ta0.1W0.9Ox/ITO thin
film stack. Appl. Surf. Sci. 253, 4740-4747.
Le Flacon, 2014. http://leflacon.free.fr/index.php (valid link on 04/2014).
Legeay, G., 2011. Couches minces amorphes d’ITO: caractérisation, structure, évolution et fonctionnalisation sous rayonnements UV. Ph.D. Thesis, University of Rennes 1, France. http://tel.archives-ouvertes.fr/tel-00567155/fr (valid link on 04/2014).
Lieberman, K., Shani, Y., Melnik, I., Yoffe, S., Sharon, Y., 1999. Near-field optical photomask repair with a femtosecond laser. J. Microsc. 194, 537-541.
Liu, G., Toncich, D.J., Harvey, E.C., 2004. Evaluation of excimer laser ablation of thin Cr film on glass substrate by analyzing acoustic emission. Opt. Lasers Eng. 42, 639-651. Moussavou, A.-G., Legeay, G., Sauleau, R., Députier, S., Castel, X., Perrin, A., Benzerga, R.,
Guilloux-Viry, M., Mahdjoubi, K., 2007. Tunable stub resonators on KTN ferroelectric thin films. In: Proceedings of the 2nd European Conference on Antennas and Propagation, Edinburgh, UK, pp. 1-5.
Moussavou, A.-G., Députier, S., Perrin, A., Sauleau, R., Castel, X., Legeay, G., Benzerga, R., Mahdjoubi, K., Guilloux-Viry, M., 2008. KTa0.5Nb0.5O3 ferroelectric thin films grown by
pulsed laser deposition: structural characteristics and applications to microwave devices. Phys. Stat. Sol. (c) 5, 3298-3303.
Rousseau, A., Laur, V., Députier, S., Bouquet, V., Guilloux-Viry, M., Tanné, G., Laurent, P., Huret, F., Perrin, A., 2008. Influence of substrate on the pulsed laser deposition growth and microwave behaviour of KTa0.6Nb0.4O3 potassium tantalate niobate ferroelectric thin films.
Thin Solid Films 516, 4882-4888.
Simon, Q., Corredores, Y., Castel, X., Benzerga, R., Sauleau, R., Mahdjoubi, K., Le Febvrier, A., Députier, S., Guilloux-Viry, M., Zhang, L., Laurent, P., Tanné, G., 2011. Highly tunable microwave stub resonator on ferroelectric KTa0.5Nb0.5O3 thin film. Appl. Phys.
Lett. 99, 092904.
Venkatakrishnan, K., Ngoi, B.K.A., Stanley, P., Lim, L.E.N., Tan, B., Sivakumar N.R., 2002. Laser writing techniques for photomask fabrication using a femtosecond laser. Appl. Phys. A 74, 493-496.
A
cce
pt
ed
M
an
uscr
ip
t
Wang, W., Mei, X., Jiang, G., Wang, K., Yang, C., 2012. Effect of film properties on the material removing characteristics in femtosecond laser rear-side ablation of chromium film. Opt. & Laser Technol. 44, 153-158.
A
cce
pt
ed
M
an
uscr
ip
t
Figure captionsFig. 1. 200 nm-thick titanium film coated with a nitrocellulose lacquer after 3 shots of excimer laser beam at O=248 nm, F=4.2 J.cm-2, W =20 ns. Note the distortion of the aerial image on the edges of the ablated surface: scanning electron microscope observation (a); light microscopy observation (b). Note also the cracking of the soda-lime float glass substrate (a) and the presence of titanium droplets inside the ablated surface and outside (open circles, (b)).
Fig. 2. Top view of crossing lines engraved directly by excimer laser on a 200 nm-thick titanium film deposited on soda-lime float glass substrate (O=308 nm, F=8.4 J.cm-2,W =15 ns, 4 to 6 shots per point). Note the cratering of the substrate surface and the raveling of glass shards (scanning electron microscope picture).
Fig. 3. Lacquer coating on a cleaved substrate (scanning electron microscope picture). Fig. 4. Excimer laser and workstation, schematic diagram.
Fig. 5. Line printing, overlapping in dynamic mode.
Fig. 6. DTA-TGA analysis of the lacquer, 1°C.min-1, N2 flow.
Fig. 7. Dispersion in transmission spectra on a 150°C backed lacquer sample.
Fig. 8. Lacquer ablation on a Ti film, 2 shots, O=248 nm, F=900 mJ.cm-2, SEM picture (a) and schematic diagram (b).
Fig. 9. Dynamic etching of lacquer on a Ti film, 4 to 6 shots, O=248 nm, F=490 mJ.cm-2. Note the presence of some residues of the lacquer after autocombustion at the top left and the Ti film surface at the top right (SEM picture).
Fig. 10. Resolution of lacquer ablation, Rd=7.5,O=248 nm.
Fig. 11. Ablated spots by changing AB slit opening, b: +0.02 mm, c: -0.02 mm; 1, 2, 6 shots,
O=248 nm, Rd=7.5 (light microscope picture).
Fig. 12. Top view of the line (9 µm wide) etched in the lacquer (SEM picture).
Fig. 13. Ablated line edge, O=248 nm, F=505 mJ.cm-2, annealed 150°C, 1 hour (SEM picture).
Fig. 14. Lines etched in the lacquer, before and after postbake 150°C, 1 hour (light microscope picture).
Fig. 15. Ti photomask for X-band frequency tunable coplanar stub resonators (a), enlarged details: (b) and (c) (light microscope picture).
Fig. 16. Bottom of the copper stub resonator etched on a KTN film (SEM picture). Fig. 17. Process diagram for resonator photomasks.
A
cce
pt
ed
M
an
uscr
ip
t
Table caption Table 1A
cce
pt
ed
M
an
uscr
ip
t
Table 1Qualitative lacquer formulation
Component Handbook
ref.
CAS number Function
Nitrocellulose film former
Phtalic anhydride 7342 85-44-9 film former
Glycols copolymer film former
Ethyl acetate 186 141-78-6 solvent
Isopropyl alcohol 10335 67-63-0 solvent
Aqua solvent
Butyl acetate 121 123-86-4 solvent
Butylene glycol 3346 107-88-0 solvent Trimellitic anhydride 7341 552-30-7 esterification,
plasticizer Acetyl tributyl citrate 77-90-7 plasticizer Glyceryl linoleate (linoleic ac.:) (8223) (2277-28-3) emollient, emulsifier Glyceryl linolenate (linolenic ac.:) (8287) (18465-99-1) emollient, emulsifier Benzophenone-3 2771 31766-07-1 UV absorber Tocopheryl acetate 2788 58-95-7 antioxidant
Chondrus Crispus gelling agent
A
cce
pt
ed
M
an
uscr
ip
t
Figure 1 (a) (b) ×200 100 µm Figure 1A
cce
pt
ed
M
an
uscr
ip
t
Figure 2 Figure 2A
cce
pt
ed
M
an
uscr
ip
t
Figure 3 lacquer substrate Figure 3A
cce
pt
ed
M
an
uscr
ip
t
Figure 4 (colour) projection lens X-Y tables sliding mirors laser adjustable aperture sample attenuator A B B' A' Figure 4A
cce
pt
ed
M
an
uscr
ip
t
Figure 4 (B&W) projection lens X-Y tables sliding mirors laser adjustable aperture sample attenuator A B B' A' Figure 4A
cce
pt
ed
M
an
uscr
ip
t
Figure 5 (colour) 3 2 1 shot number x window stacking Figure 5A
cce
pt
ed
M
an
uscr
ip
t
Figure 5 (B&W) 3 2 1 shot number x window stacking Figure 5A
cce
pt
ed
M
an
uscr
ip
t
Figure 6 (colour) 150°C 169°C 0 5 10 15 20 25 30 0 100 200 300 400 500 temperature (°C) m a s s ( m g ) -2.5 -2 -1.5 -1 -0.5 0 0.5 1 1.5 te m p . g a p ( °C ) mass T Série exo up -D Figure 6A
cce
pt
ed
M
an
uscr
ip
t
Figure 6 (B&W) 150°C 169°C 0 5 10 15 20 25 30 0 100 200 300 400 500 temperature (°C) m a s s ( m g ) -2.5 -2 -1.5 -1 -0.5 0 0.5 1 1.5 te m p . g a p ( °C ) mass T Série exo up - D Figure 6A
cce
pt
ed
M
an
uscr
ip
t
Figure 7 (colour) Figure 7A
cce
pt
ed
M
an
uscr
ip
t
Figure 7 (B&W) Figure 7A
cce
pt
ed
M
an
uscr
ip
t
Figure 8 (colour) zone 2 zone 3 zone 4 ablation autocombustion melting residues splashes 2 shots, 248 nm, 0.9 J.cm-2, 20 ns Q2 Q1 Q3 Q4 Ti 0.2 µm glass lacquer 0.3 / 0.5 µm zone 1 lacquer Ti (a) (b) Figure 8A
cce
pt
ed
M
an
uscr
ip
t
lacquer Ti (a) zone 2 zone 3 zone 4 ablation autocombustion melting residues splashes 2 shots, 248 nm, 0.9 J.cm-2, 20 ns Q2 Q1 Q3 Q4 Ti 0.2µm glass lacquer 0.3 / 0.5µm zone 1 (b) Figure 8A
cce
pt
ed
M
an
uscr
ip
t
Figure 9 Ti lacquer Figure 9A
cce
pt
ed
M
an
uscr
ip
t
Figure 10 (colour) 5 10 15 20 25 0.04 0.06 0.08 0.10 0.12 0.14 0.16 0.18 AB slit opening (mm) p ri n te d w id th ( µ m) dynamic modestatic mode theoretical
A
cce
pt
ed
M
an
uscr
ip
t
Figure 10 (B&W) 5 10 15 20 25 0.04 0.06 0.08 0.10 0.12 0.14 0.16 0.18 AB slit opening (mm) p ri n te d w id th ( µ m ) dynamic mode static mode theoretical Figure 10A
cce
pt
ed
M
an
uscr
ip
t
Figure 11 (colour) b1 b2 b6 a1 a2 a6 c1 20 µm c2 c6 Figure 11A
cce
pt
ed
M
an
uscr
ip
t
Figure 11 (B&W) b1 b2 b6 a1 a2 a6 c1 20 µm c2 c6 Figure 11A
cce
pt
ed
M
an
uscr
ip
t
Figure 12 Ti lacquer Figure 12A
cce
pt
ed
M
an
uscr
ip
t
Figure 13 Ti lacquer Figure 13A
cce
pt
ed
M
an
uscr
ip
t
Figure 14 (colour) 28 µm 9 µm 8 µm as ablated annealed Figure 14A
cce
pt
ed
M
an
uscr
ip
t
Figure 14 (B&W) 28 µm 9 µm 8 µm as ablated annealed Figure 14A
cce
pt
ed
M
an
uscr
ip
t
Figure 15 10 mm 18 µm 10 µm 10 µm (a) (b) (c) Figure 15A
cce
pt
ed
M
an
uscr
ip
t
Figure 16 ground plane stub ground plane Figure 16A
cce
pt
ed
M
an
uscr
ip
t
Figure 17 (colour) lacquer thinning 19% EtAc glass substrate cleaning, RBS sputtering Ti 200 nm spin coating 5500 t/mn oven bake 1 h 150°C XMR ablation 248 nm (2 prog.) postbake 1 h 150°C Ti etching HF 3% microscope check lacquer stripping Remover 80°C programs validation programs writing laser & slit tests & tuninglayout analysis
A
cce
pt
ed
M
an
uscr
ip
t
Figure 17 (B&W) lacquer thinning 19% EtAc glass substrate cleaning, RBS sputtering Ti 200 nm spin coating 5500 t/mn oven bake 1 h 150°C XMR ablation 248 nm (2 prog.) postbake 1 h 150°C Ti etching HF 3% microscope check lacquer stripping Remover 80°C programs validation programs writing laser & slit tests & tuninglayout analysis