Direct Identification of Hundreds of
Expression-Modulating Variants using a Multiplexed Reporter Assay
The MIT Faculty has made this article openly available.
Please share
how this access benefits you. Your story matters.
Citation
Tewhey, Ryan, Dylan Kotliar, Daniel S. Park, Brandon Liu, Sarah
Winnicki, Steven K. Reilly, Kristian G. Andersen, et al. “Direct
Identification of Hundreds of Expression-Modulating Variants Using
a Multiplexed Reporter Assay.” Cell 165, no. 6 (June 2016): 1519–
1529.
As Published
http://dx.doi.org/10.1016/J.CELL.2016.04.027
Publisher
Elsevier
Version
Author's final manuscript
Citable link
http://hdl.handle.net/1721.1/116742
Terms of Use
Creative Commons Attribution-NonCommercial-NoDerivs License
Direct identification of hundreds of expression-modulating
variants using a multiplexed reporter assay
Ryan Tewhey1,2,*, Dylan Kotliar1,2, Daniel S Park2, Brandon Liu2, Sarah Winnicki2, Steven K
Reilly1,2, Kristian G Andersen1,2, Tarjei S Mikkelsen2, Eric S Lander2, Stephen F Schaffner2, and Pardis C Sabeti1,2,*
1Center for Systems Biology, Department of Organismic and Evolutionary Biology, Harvard University, Cambridge, MA 02138, USA
2Broad Institute, Cambridge, MA 02142, USA
Summary
Although studies have identified hundreds of loci associated with human traits and diseases, pinpointing causal alleles remains difficult, particularly for non-coding variants. To address this challenge, we adapted the massively parallel reporter assay (MPRA) to identify variants that directly modulate gene expression. We applied it to 32,373 variants from 3,642 cis-expression quantitative trait loci and control regions. Detection by MPRA was strongly correlated with measures of regulatory function. We demonstrate MPRA's capabilities for pinpointing causal alleles, using it to identify 842 variants showing differential expression between alleles, including 53 well-annotated variants associated with diseases and traits. We investigated one in detail, a risk allele for ankylosing spondylitis, and provide direct evidence of a non-coding variant that alters expression of the prostaglandin EP4 receptor. These results create a resource of concrete leads and
illustrate the promise of this approach for comprehensively interrogating how non-coding polymorphism shapes human biology.
Graphical abstract
*Correspondence: [email protected]; [email protected].
Author Contributions: All authors contributed in the development of this work. R.T. and P.C.S. conceptualized and initiated the
study; R.T., D.S.P., and S.W. performed experimental work; R.T., D.K., B.L., S.K.R., K.G.A.,T.S.M., E.S.L., S.F.S, and P.C.S. analyzed the data; and R.T., S.F.S., and P.C.S. wrote the paper.
Accession Numbers: The accession number for the sequencing data reported in this paper is GSE75661.
Publisher's Disclaimer: This is a PDF file of an unedited manuscript that has been accepted for publication. As a service to our
customers we are providing this early version of the manuscript. The manuscript will undergo copyediting, typesetting, and review of
HHS Public Access
Author manuscript
Cell
. Author manuscript; available in PMC 2017 June 02.Published in final edited form as:
Cell. 2016 June 2; 165(6): 1519–1529. doi:10.1016/j.cell.2016.04.027.
A
uthor Man
uscr
ipt
A
uthor Man
uscr
ipt
A
uthor Man
uscr
ipt
A
uthor Man
uscr
ipt
Introduction
The genomic era has enormously increased our knowledge of human genetic variation, but our understanding of the functional consequences of that variation has not kept pace (Cooper and Shendure, 2011). While genome-wide association studies (GWAS) and whole genome scans for natural selection have identified numerous loci linked to human traits and diseases, correlation between nearby polymorphisms (linkage disequilibrium, or LD) within
individual associations often leaves dozens to hundreds of potential causal variants to be interrogated (Grossman et al., 2013; Schaub et al., 2012). Mounting evidence suggests that at the majority of these loci, the causal variant(s) is a non-coding regulatory change rather than an amino acid substitution (Farh et al., 2015). Indeed, regulatory changes drive some of the best-understood examples of phenotypic diversity and adaptive evolution (Claussnitzer et al., 2015; Musunuru et al., 2010; Tishkoff et al., 2007). Therefore, it is critical that we be able to test whether a variant affects gene regulation.
Current approaches for measuring a variant's effect on gene expression fall into two
categories, each with its own limitation. Indirect methods, such as whole-genome epigenetic assays, can only identify the broader regulatory state of a region, not necessarily the effect of a particular variant (Andersson et al., 2014; Consortium; Kasowski et al., 2013; McVicker et al., 2013). Direct methods, ones that measure the impact of individual alleles in an episomal or native context on gene expression, are currently low throughput and require substantial resources for comprehensive evaluation of a region.
We adopted the MPRA assay as a solution and modified it so that we could carry out large-scale, sensitive and direct testing of potential regulatory variants. This assay is based upon the well-established reporter gene assay, in which a vector containing a reporter gene (e.g. luciferase or green fluorescent protein [GFP]), a promoter and a potential regulatory sequence is inserted into a plasmid, which is transfected into a cell; sequences that regulate
A
uthor Man
uscr
ipt
A
uthor Man
uscr
ipt
A
uthor Man
uscr
ipt
A
uthor Man
uscr
ipt
gene expression then alter the amount of luciferase/GFP expressed (Arnold et al., 2013; Melnikov et al., 2012; Ow et al., 1986; Patwardhan et al., 2012; Vockley et al., 2015; Kwasnieski et al., 2014). Through the use of unique barcodes in the 3′ untranslated region (UTR) of the reporter to differentiate expression of individual oligos, MPRA can test many different sequences simultaneously, and it has been shown to reproducibly detect segments of the genome that change expression levels (Kheradpour et al., 2013; Mogno et al., 2013). We aimed to incorporate single nucleotide and small insertion/deletion polymorphisms, (referred to below as single nucleotide variants or SNVs), into these assays, to see if we could detect subtle differences in how each allele drives expression. Because we use only a minimal promoter, with very low baseline expression, in this iteration of the assay, we intend it primarily as a test of regulatory sequence that increases (i.e. enhancers and promoters), rather than decreases, expression; the latter will be difficult to detect, since baseline expression is already low.
Ideally, one would test the assay for sensitivity and specificity by applying it to a set of ‘gold-standard’ variants previously identified as expression quantitative trait loci (eQTLs) that act on enhancer and promoter elements. However, there is a dearth of such known variants. As the best available alternative, we studied a set of thousands of candidate eQTL variants in regions associated with differential gene expression in the population. There are important considerations in interpreting the results of such a test. First, we test multiple candidate variants (sometimes dozens) within each eQTL region that are in LD with one another. We generally expect that at most one of these variants will be causal, and sometimes the true causal variant will not appear in the set, because the degree of LD falls below the cutoff used for inclusion. For these reasons only a minority of the variants tested are expected to give a signal in the MPRA assay. Conservative estimates suggest that in 34-41% of eQTL peaks (dependent on the population tested), the causal variant will be the top associated allele. Second, only a subset of the true variants responsible for eQTLs (23-64%, according to recent estimates) will act on enhancers or promoters, which are the functional classes that will be detected in the MPRA assay (Farh et al., 2015; Gymrek et al., 2015; Lappalainen et al., 2013). Variants that work by other processes, such as microsatellites or post-transcriptional regulation, would not be expected to score.
Because we expect only a minority (8-26% based on the prior estimates) of the variants in our test set to score by MPRA, we must evaluate the assay by comparison with the
performance on control sets of common polymorphisms. We used two control sets: the first chosen randomly from the genome, and the second containing variants near but not associated with eQTL variants.
We estimated the specificity, sensitivity and reproducibility of MPRA to localize causal alleles within large genomic loci linked to variation in gene expression. In addition, we comprehensively interrogated GWAS loci that overlap with eQTLs to identify and characterize potential regulatory variants underlying human diseases and traits.
A
uthor Man
uscr
ipt
A
uthor Man
uscr
ipt
A
uthor Man
uscr
ipt
A
uthor Man
uscr
ipt
Results
Adapting MPRA to Test ∼30k Candidate Variants
We modified MPRA to increase its throughput while also improving its reproducibility and sensitivity (Figure 1, Experimental Procedures); the latter is crucial, since we aim not merely to find genetic elements that regulate genes, but to detect differences in regulation caused by single variants within those elements. To accommodate our large library size and to increase the sensitivity of the assay, we added 20 nucleotide barcodes to the oligos by emulsion PCR and cloned the fragments to generate a library; in this manner, each oligo is represented by an average of a thousand tags within the plasmid library. Following transfection, we captured the GFP mRNA by hybridization and perform high-throughput sequencing of the UTR barcode to determine the effects of the oligos on the transcription level of the reporter gene. This new experimental approach decreased inter-experimental noise and allowed us to apply a parametric statistical framework during analysis (Supplemental Experimental Procedures).
Selection of Variants Tested
For benchmarking and discovery, we first examined nearly thirty thousand SNVs within a set of eQTLs. We identified eQTLs from the Geuvadis RNA-seq dataset of lymphoblastoid cell lines (LCLs) from individuals of European (EUR) and West African (YRI) ancestry due to the availability of both genome sequences and immortalized cell lines for these
individuals (Consortium, 2012; Lappalainen et al., 2013). For each of the 3,642 eQTLs, we designed and synthesized DNA oligonucleotides (oligos) representing the top associated variant and all variants in perfect LD with it. This approach selects an average of 3 SNVs per eQTL peak. As noted above, we expect that (i) this set will often fail to contain the true causal variant, and (ii) when the set does contain the causal variant, the other two variants will not be causal. We also included 209 eQTLs that overlapped GWAS hits for deeper investigation; for these, we tested all alleles in moderately strong LD (r2 >= 0.9) with the lead variants. After inclusion of several smaller sets of variants, and accounting for
neighboring variants and orientation of the variant when associated with multiple genes, this first 79k oligo library included 39,479 oligo pairs, originating from 29,173 unique variants (see Supplemental Experimental Procedure for a complete breakdown).
We also performed a second MPRA experiment that assayed 264 positive control variants (sites identified in the first 79k MPRA library) and 3200 negative control variants. The negative controls included 2700 variants chosen at random across the genome matching the minor allele frequency distribution of the larger 79k library. To select a set of negative control variants with a similar biological profile, we included 500 SNVs that were in close proximity to an eQTL peak (within 250-1000bp) and not in LD with the lead variant. We incorporated all variants into a 7.5k oligo library. In total, across the two experiments we evaluated 85,358 oligos (42,679 reference/alternate pairs), centering the variant of interest in 150 bp of its genomic sequence.
A
uthor Man
uscr
ipt
A
uthor Man
uscr
ipt
A
uthor Man
uscr
ipt
A
uthor Man
uscr
ipt
Technical Performance of MPRA
We transfected the original 79k MPRA library into two separate lymphoblastoid cell lines (NA12878 & NA19239) from the 1000 Genomes project as well as into a hepatocarcinoma cell line (HepG2). We performed eight and five technical replicates for the lymphoblastoid and hepatocarcinoma cell lines, respectively. We observed high coverage and excellent reproducibility in the assay, capturing 98.4% of the 79K oligos tested at a depth of 20 reads or greater. Reproducibility was excellent between experimental replicates of identical cell lines, with an average correlation of 0.99 (Figures 2A-B & S1), and expression values were strongly correlated with a traditional single-plexed luciferase assay for the 29 sequences we examined (R=0.84, Figure 2C).
Each oligo in our initial 79k library was captured by an average of 73 unique barcodes per replicate during sequencing (per sample range: 34 – 117 barcodes), with an average total read count of 1102 (Figure S2A). A key feature of our approach is the use of additional barcodes to reduce variability between replicates; reducing this variability is crucial for achieving the sensitivity required to detect subtle difference between alleles, since detection requires distinguishing the distributions for the two alleles. To evaluate how this variability depended on the number of barcodes, we downsampled barcodes for each oligo. We observed little fluctuation in the estimated mean oligo count, as long as they were captured with greater than 20 barcodes (Figure S2B). The variance between the individual replicates, on the other hand, continued to improve throughout the range from 20 to 50 barcodes, indicating that power to detect small differences between oligos is substantially affected by barcode count (Figure 2D). This effect is highlighted in the second 7.5k library: its smaller size allowed us to tag each oligo with an average of 350 barcodes. This resulted in a greater sensitivity to detect weak expression changes, illustrating the impact of the number of barcodes tagging each variant, and also highlighting the requirement for normalization when comparing between libraries (Figure S3A-D, Supplemental Experimental Procedures). Evaluating Regulatory Activity of the Oligos
Before looking for allelic effects, we first identified the subset of sequences for which either or both variants altered the expression of the reporter. Of the 29k variants evaluated in the original assay, 12% (3432) had an effect on the reporter for at least one of the two alleles (Table S1); these we call “active” sequences. Of these, 95% enhanced expression of the reporter (Figures 3A & S3E). Because the assay uses a weak basal promoter, it is more sensitive to increases in expression than to decreases. It is conceivable, however, that the result also reflects differences in the proportion of activating and silencing elements in the genome. We found that active sequences were shared between LCLs from different individuals more often than between different cell types (74% between NA12878 & NA19239 compared to 52% between NA12878 and HepG2). This difference in overlap is likely an underestimate, since only three replicates were performed in NA19239 compared to five in HepG2. The active sequences were reproducible, with the effect sizes being highly correlated when we re-tested 274 active variants in the 7.5k MPRA experiment (R=0.95) (Figure S3F).
A
uthor Man
uscr
ipt
A
uthor Man
uscr
ipt
A
uthor Man
uscr
ipt
A
uthor Man
uscr
ipt
The sequences that scored as active in the assay are significantly enriched for markers associated with regulation in the genome, including open chromatin, biochemical marks denoting active promoters and enhancers, and individual transcription factors. We first evaluated overlap with open chromatin, as identified by DNase hypersensitivity sites (DHS). We found 43.3% of the active sequences were marked as DHS compared to only 19.4% for the non-active sequences, a 2.2 fold enrichment (OR=3.2, p=1.8×10-191, Figure 3B). Histone marks associated with active promoters and enhancers (H3k4me3, H2az, H327ac, CAGE) were both similarly enriched, while marks associated with heterochromatin and/or the blocking of transcription initiation (H3k9me3 and H3k36me3) were significantly depleted, as expected (Figure 3B). The strongest enrichments were seen with individual transcription factor (TF) binding locations, with increases ranging from 3 to 39-fold for all TFs surveyed in LCLs by ENCODE, except for the repressor element Ezh2. Enrichment was cell type specific, again as expected, with sequences active only in LCLs and not HepG2 cells being enriched for DHS sites in LCLs only (OR=2.2, p=6.6×10⁻³²). Similarly, sequences that were active only in HepG2 cells were depleted in LCL DHS sites (OR=0.29, p=8.7×10⁻⁸)
compared to all other sites tested (Figure 3C). Identifying Alleles with Differential Activity
Focusing on those sequences for which at least one allele affected the expression of the reporter, we identified those that showed differential expression between the reference and alternate allele (“allelic skew”). Of the 3432 active sequences, 842 showed allelic skew; we call these “expression-modulating variants” (emVars) (Table S1). Most of the emVars exhibited modest expression differences between alleles: only 46 had more than a 2-fold change (Figure 4A & B). The changes were, however, highly reproducible. We randomly selected 127 emVars for testing in the second, 7.5k MPRA experiment and observed strong correlation for allelic skew to that of the 79k experiment (R=0.97) (Figure 4C). For all 842 emVars, the effect size was highly correlated between the two LCLs tested (R=0.92) and moderately correlated between LCLs and HepG2 cells (R=0.63) (Figure 4D & S4A). Concordant with observations that eQTLs are associated with promoter regions (Veyrieras et al., 2008), we saw a 13.6-fold enrichment of emVars within core promoters (+100/-50 bp) relative to our test set of 29k variants, and a 113.7-fold enrichment relative to all common variation (RR=14.8, p=2.7×10-52 & RR=113.7, p=1.2×10-121 respectively). Despite this enrichment, many emVars fell outside promoters, with 59% lying at a distance of 10kb or more from the nearest transcription start site (TSS), suggesting a prominent role for distal regulatory elements.
Like the overall set of active sequences, our emVars were enriched for markers associated with regulation such as TF binding. We therefore examined whether the presence of allelic skew correlated with predicted disruption of a TF motif. Of the emVars that overlapped a ChIP-seq peak for a given TF and that contained the corresponding TF motif, the predicted strength of TF binding (based on position weight matrices) differs significantly between alleles in 76% of cases (35 out of 46, had a difference of at least 3 in log-likelihood binding score based on the position weight matrices). This was 4-fold greater than the difference for active sequences that did not show allelic skew (OR=4.1, p=8.1×10⁻⁸) and 41-fold greater than for the non-active sequences (OR=42.7, p=1.9×10-36, Figure 5A). The quantitative
A
uthor Man
uscr
ipt
A
uthor Man
uscr
ipt
A
uthor Man
uscr
ipt
A
uthor Man
uscr
ipt
change in predicted binding also correlated with the magnitude of allelic skew observed by MPRA, supporting a direct relationship between predicted binding dynamics and regulatory activity within MPRA (R=0.47, p=6.4×10⁻¹⁰, Figure 5B).
We predicted that if emVars were true regulatory variants, then the allele associated with higher expression would also be associated with greater chromatin accessibility as measured by DHS in their native context. We examined emVars that were heterozygous at DHS sites in LCLs to see if there was an allelic skew in DHS status by counting the number of DHS reads attributed to each allele. We found that emVars were significantly more likely to show DHS skew than active sequences that were not emVars (OR=2.5, p=0.003). Furthermore, 89% of variants shared the same direction of effect with a strong correlation in the magnitude of allelic skew of the emVar activity and the number of reads at DHS sites (R=0.78, p=1.0×10⁻⁸, Figure 5C). We also predicted the same effect would be observed for TF-binding as measured by ChIP-seq. We observed emVars were more likely to show allelic skew in the binding of at least one overlapping TF than active sequence that were not emVars (OR=1.9, p=0.03). For emVars that showed allelic skew in TF occupancy for at least one TF, there was a substantial concordance of direction and magnitude between the allelic skew in TF binding and the allelic skew in activity (77% agreement in directionality, R=0.60, p=2.1×10⁻⁷, Figure S5A & B).
Estimating specificity of the MPRA assay—We next set out to estimate the specificity of the MPRA assay. Because many of the variants tested are not actually drivers of eQTLs, we focused on a set that is likely to be enriched: the top associated variant for each eQTL and all variants in perfect LD. We carried out analysis on these 11,213 variants from 3,642 eQTLs taking into consideration that only one, if any, of the variants in each region may be a true regulatory variant and only a fraction of these may drive transcriptional regulation discoverable by MPRA.
We observed allelic skew in activity for 27% of the active sequences associated with an EUR eQTL, and 26% of the YRI variants. In contrast, only 9% of the active sequences for the location-matched controls exhibited allelic skew, suggesting that two-thirds of the emVars associated with an eQTL peak are true causal variants for that peak. Randomly selected controls gave a similar result: 11% of active sequences contained emVars. Based on these results, we estimate the positive predictive value (PPV) to be 58-68%. Because the controls were tested independently in a second library, we were careful to normalize the tag-counts to match those of the first experiment. To validate our normalization, we compared the
proportion of active sequences in the two libraries. In the second, 7.5k library, 13.4% of the 500 location-matched and 9.7% of the 2700 randomly selected controls scored as active sequences, compared to 12% for the 79k library (Supplemental Experimental Procedure). As an alternative approach to explore the false discovery rate, we compared how often the direction of effect agrees between MPRA and the eQTL analysis. If we focus first on those emVars that reside in regions biologically annotated as likely to be related to enhancer function (by virtue of being marked by at least two of the following; DHS, CAGE, histone ChIP or TF-ChIP), we find 80% agreement in directionality, corresponding to a PPV of 59% (R=0.61, p=7.5×10⁻¹⁵, Figure 5D & S5C, Supplemental Experimental Procedure). Notably,
A
uthor Man
uscr
ipt
A
uthor Man
uscr
ipt
A
uthor Man
uscr
ipt
A
uthor Man
uscr
ipt
when we examine sites not supported by annotation, we observe a level of agreement consistent with random chance (48%, R=0.06, p=0.61). When we consider all emVars together (regardless of whether they are annotated as related to enhancer function), the concordance is 67% (PPV of 34% (R=0.33, p=4.8×10⁻⁷). (We note that MPRA may not always correctly model the direction or magnitude of a variant's effect because the assay isolates a sequence from potential cofactors that may modify the effect; this has been observed for the genes yy1 and dorsal (Dubnicoff et al., 1997; Ip et al., 1991; Shi et al., 1991).) Finally, we explored whether some of the discordant emVars might represent false eQTL discoveries by removing the weakest one-third of eQTL associations; we observed a further increase in agreement for annotation-supported emVars of 84%, suggesting that false positive eQTLs indeed contribute to the discordance.
Estimating sensitivity of the MPRA assay—We next estimated the sensitivity of MPRA to identify a causal eQTL variant when it is present in our study. Based on previous estimates, we expect the causal allele to be in our enriched set (top eQTL variant and all variants in perfect LD) 34% of the time in the EUR population. Given our assay identified emVars in 8.6% (273/3171) of eQTL peaks, and 3-6% after accounting for false positives, we estimate a sensitivity of 9-18% in the EUR population. In the YRI population, lower LD makes it more likely that a top-scoring eQTL variant will be the causal allele, an estimated 41%. As expected we observe a larger fraction for YRI eQTLs with 13.8% (65/471) containing an emVar, 5-10% after accounting for false positives, giving an estimated sensitivity of 12-24%. When only taking into account variants supported by functional annotation, the estimated sensitivity is nearly equal by virtue of an increased PPV, emphasizing the value of filtering MPRA emVars with existing annotations. The estimate that MPRA can identify the causal allele for an eQTL for 9-24% of peaks when tested is in line with the previous observations that 23%-64% of eQTLs are driven by promoter or enhancer modifications, the processes we expect MPRA to capture.
We further performed two alternate estimates for sensitivity focusing on regions where the causal allele is likely to be captured in our data set. We first partitioned peaks based on the difference in variance (Δr2) between the lead variant (the variant tested by MPRA) and the second strongest association. The top eQTL variant is most likely to be causal when the Δr2 is large; accordingly we see an increase of emVars in these regions (Figure 5E). Modeling this relationship using a logistic regression that also controlled for the effect size of the eQTL, we derived a sensitivity of 16-21%. Second, we identified eQTL peaks where the same top associated variant occurred in both EUR and YRI. Differing LD structure between the two populations decreases the number of linked variants and increases the confidence that the top variant is causal. Of the 34 shared variants, 8 were identified as emVars, suggesting a 24% sensitivity of MPRA to correctly identify the causal allele when it is tested. Both orthogonal approaches are consistent with our initial estimate of 9-24%. GWAS Associated Regions
We next investigated regions previously associated with a trait or disease in human studies in greater depth. For 209 eQTLs overlapping 163 GWAS loci, we tested all alleles in strong LD (r2 > 0.9) of an eQTL variant, a total of 9664 variants. We identified 248 emVars in 99
A
uthor Man
uscr
ipt
A
uthor Man
uscr
ipt
A
uthor Man
uscr
ipt
A
uthor Man
uscr
ipt
eQTLs (Table S2). Based on our previous findings, we prioritized the emVars that also carry annotations associated with an enhancer or promoter; we identified 53 emVars in 56 eQTLs (a subset of these, further restricted by LD, is shown in Table 1). This represents a highly promising set of candidates and greatly reduced testing burden compared to current approaches. For example, applying only our ENCODE annotation criteria identifies 1302 variants across 171 of the 209 eQTL peaks.
Candidates identified through MPRA still require experimental validation. We pursued a striking example, in a distal enhancer for prostaglandin E receptor 4 (PTGER4). The emVar rs9283753 sits 190 kb away from the gene and is in strong LD with the top associated risk allele for ankylosing spondylitis (with moderate LD to risk alleles for Crohn's disease and multiple sclerosis) (Figure 6A-C) (Barrett et al., 2008; Evans et al., 2011; De Jager et al., 2009). The variant resides in a distal enhancer clearly defined by strong DHS and H3K27ac marks, with a CREB motif residing over rs9283753. The allele change is not predicted to alter binding of CREB, however, and further work will be needed to elucidate the mechanism of regulation.
To validate the PTGER4 emVar, we used homology-directed repair with CRISPR/Cas9 to perform allelic replacement. We edited two cell lines, a homozygous ancestral (NA12878) and a homozygous derived (NA11831) individual for the variant to test the effect of the allele in a controlled isogenic background. As expected from the MPRA and eQTL data, switching NA12878 to be homozygous for the derived allele caused an increase in expression for PTGER4, while the replacement with the ancestral allele decreased expression of NA11831 (Figure 6D-E). The concordant MPRA, eQTL and CRISPR data support the hypothesis that the risk allele is associated with decreased expression of PTGER4.
Our finding of a regulatory variant in the distal enhancer in PTGER4 is consistent with prior observations that identify elements outside core promoters as a significant contributor to the heritable component of complex diseases (Farh et al., 2015; Gjoneska et al., 2015; Parker et al., 2013). Looking more broadly, the 188 emVars in strong LD (r2 >= 0.9) with GWAS variants tend to lie further from promoters than randomly chosen eQTL variants: 78% (147) reside greater than 10kb from an active TSS, compared to 53% for all other emVars. We observed a corresponding depletion in strongly linked GWAS emVars within core promoters compared to all non-GWAS emVars (RR=5.3, p=0.0015).
There are many other promising candidates to pursue, including both a core promoter and intronic emVar in the BLK locus associated with systemic lupus erythematosus (SLE). The locus has previously been characterized by Guthridge and colleagues, who reported the promoter variant rs922483 (Guthridge et al., 2014). We replicated this finding via MPRA while also observing a second emVar within the first intron of the gene. This is a one base deletion at chr8:11353110 that introduces a novel NF-kB binding site. Notably, we found this emVAR decreased expression of BLK while increasing expression of the nearby gene FAM167A, and was validated with the traditional luciferase assay (Figure 6F-I). Moreover, this emVAR is in perfect LD with the top associated SLE risk variant among Europeans, rs2618476 (Graham et al., 2008; Guthridge et al., 2014).
A
uthor Man
uscr
ipt
A
uthor Man
uscr
ipt
A
uthor Man
uscr
ipt
A
uthor Man
uscr
ipt
Discussion
Our findings demonstrate that MPRA can be an invaluable tool for localizing individual causal variants influencing phenotypic traits. We have discovered hundreds of variants as putative causal alleles for gene expression, many of which are linked to known disease-causing loci. Furthermore we directly demonstrate causality by allelic replacement of an ankylosing spondylitis risk allele, rs9283753, which modulates expression of PTGER4 from a distal enhancer.
As with any assay, it is important to understand the limitations of MPRA. The sensitivity of our current assay, which can identify an estimated 9-24% of the eQTL causal alleles, is limited in several distinct ways. (i) Causal alleles of weak effect may fall below MPRA’s limit of detection. (ii) Regulatory processes may require additional sequence context not captured on the oligo, for example, when transcription depends on nearby DNA binding co-factor(s) or chromatin structure. (iii) Transcription repressing effects might be undetectable due to the low basal activity of the minimal promoter used. (iv) Causal alleles may regulate post-transcriptional events such as mRNA processing and stability.
The first three categories represent limitations of the current assay design and may be overcome in subsequent iterations of MPRA. Analysis of the proportion of active variants suggests that for one-third of the 79k library, we were underpowered due to a low abundance of the plasmid pool, something that could be overcome by increased sequencing and library uniformity (Figure S2C). In addition, further improvements, such as longer oligo sequences to capture greater contextual information and the use of a stronger constitutive promoter to detect repressive elements, may provide substantial gains in sensitivity. Nevertheless, there is undoubtedly contextual information, such as long distance interactions, that will never be captured by an episomal assay.
One of the largest influences to the current sensitivity is the substantial role of post-transcriptional effects driving eQTLs; these are not targeted by our assay. For example, a recent analysis by Farh and colleagues of eQTL causal variants estimated that 36% of sites fall within transcripts themselves and only 23% are attributed to known promoter/enhancer elements, suggesting a substantial role for post-transcriptional activities (Farh et al., 2015). This implies that, at best, MPRA would have a maximum sensitivity of 23-64% for detecting an eQTL causal allele, since it is not designed to detect variants acting post-transcriptionally. In contrast, the same study reported a very different picture for autoimmunity GWAS hits: only 19% of causal alleles fell in transcripts and 67% resided in known promoter/enhancers, with the remainder associated with unannotated non-coding sequence. The discrepancy in the predicted mechanisms of eQTL and GWAS causal sites suggests that the sensitivity of MPRA may well be higher for disease-associated variants than reported here.
While the sensitivity may be increased through further technical development, the positive predictive value of 34-68% is likely an inherent property of the assay. This suggests that a substantial segment of the genome has the potential to change gene expression but is repressed from doing so through modulating interactions or heterochromatin silencing. Endogenously silenced sequences likely also explain a proportion of the active sequences we
A
uthor Man
uscr
ipt
A
uthor Man
uscr
ipt
A
uthor Man
uscr
ipt
A
uthor Man
uscr
ipt
observed by MPRA, which we note was unexpectedly high. As a result some variants discovered by MPRA will be of little biological value. However, the assay still identifies 1-2 true causal allele for every 3 variants that score, which provides an enrichment and
throughput unparalleled by alternative approaches. While MPRA does not prove causality it does substantially reduce the test space of alleles linked to a trait locus and provides a concise list of high priority targets for follow-up. Furthermore, the improved agreement with eQTL directionality when subsetting those emVars with supporting biological annotation demonstrates the strength of a combined approach when searching for non-coding causal alleles.
Regardless of the high-throughput approach taken to identify variants influencing gene regulation, whether it is computational or experimental, it is critical the results are interpreted as the product of a discovery tool and not a test for causality; a first step in the difficult task of linking a genetic loci to a physiological phenotype. By example, we demonstrate for PTGER4 how we can readily identify and validate an allele that influences gene expression and extending this observation further to a disease causation will require further work. Being able to identify and validate expression modulating variants from tens of thousands of sites will ultimately greatly aid in our ability to translate non-coding regulatory code and will bring us a step closer to the difficult task of linking human genetic variation to specific phenotypic traits.
Experimental Procedures
Variant Selection
To construct the 79k oligo library eQTLs were identified by reanalysis of the Geuvadis RNA-seq dataset of lymphoblastoid cell lines (LCLs) from individuals of European (EUR) and West African (YRI) ancestry (Supplemental Experimental Procedures). We identified 3,642 eQTLs within EUR and YRI using significance thresholds corresponding to a 0.1% false positive rate within permutated samples. Using the selection and design criteria described in the Supplemental Experimental Procedures we selected 29,173 variants to test by MPRA. After accounting for both the reference and alternate alleles, neighboring variants and in some instances orientation of the oligo relative to the promoter we designed a total of 78,956 oligos with the variant of interest centered within 150 bp of genomic sequence. The 7.5k oligo library was constructed by selecting variants representing four different classes. (i) Variants called as expression positive in the 79k oligo experiment. (ii) Variants called as expression positive and having allelic skew (emVars) in the 79k oligo experiment. (iii) Location matched controls, selected for being between 250-1000 bp of a lead eQTL association, not in LD with the lead candidate (r2 <= 0.25) and not having an appreciable eQTL signal in the Geuvadis or GTEx datasets. (iv) Randomly selected variants from across the genome matching only to the minor allele frequency spectrum of EUR eQTL variants. A subset of the randomly selected variants were further filtered for having no detectable eQTL signal in the Geuvadis and GTEx datasets. The two sets of randomly selected sites behaved similarly by MPRA and were combined as a single set during analysis.
A
uthor Man
uscr
ipt
A
uthor Man
uscr
ipt
A
uthor Man
uscr
ipt
A
uthor Man
uscr
ipt
Massively Parallel Reporter Assay
Oligos were synthesized (Agilent Technologies) as 180 bp sequences containing 150 bp of genomics sequence and 15 bp of adapter sequence on either end. Unique 20 bp barcodes were added by emulsion PCR along with additional constant sequence for subsequent incorporation into a backbone vector by gibson assembly. The oligo library was expanded by electroporation into E.coli and the resulting plasmid library was sequenced by Illumina 2×150 bp chemistry to acquire barcode/oligo pairings. The library underwent restriction digest and GFP with a minimal TATA promoter was inserted by gibson assembly resulting in the 150 bp oligo sequence positioned directly upstream of the promoter and the 20 bp barcode falling in the 3′ UTR of GFP. After expansion within E.coli the final MPRA plasmid library was sequenced by Illumina 1×30 bp chemistry to acquire a baseline representation of each oligo within the library.
Libraries were electroporated into LCLs using the Neon system (Life Technologies). We performed multiple independent replicates for NA12878 (5 replicates) and NA19239 (3 replicates) with each replicate consisting of ∼5×10⁸ cells. Transfections for 5 independent replicates of HepG2 cells were performed using Lipofectamine 3000 (Life Technologies). For both cell types RNA was harvested 24 hours post transfection followed by DNA digestion, capturing of the GFP transcripts and cDNA synthesis. Sequencing libraries were constructed by adding adapters by PCR and sequenced using Illumina 1×30 bp chemistry. Detailed experimental conditions as well as oligo and primer sequences are provided in the Supplemental Experimental Procedures.
Allelic Replacement at PTGER4 Locus
Cas9-GFP vector, guide RNA (gRNA) targeting rs9283753, and a 150 bp homology oligo with either the reference (C) or alternate (T) allele, were transfected into 5×10⁶ LCLs. Cells were sorted for GFP expression 24 hours post-transfection and expanded for two week in bulk. Single cell dilutions of each bulk population were performed and after two weeks of growth genotyped using Illumina sequencing to identify mutations of interest. All clones were confirmed by Sanger sequencing. To quantify changes in expression of PTGER4 qPCR was performed on clonal colonies identified as either HDR or wild-type. RNA was collected from ∼7.5×10ˆ6 cells, and cDNA was synthesized. qPCR was performed with technical triplicates for each reaction. Detailed transfection and qPCR conditions as well as gRNA, homology oligo and primer sequences are provided in the Supplemental Experimental Procedures.
Data Analysis
The sum of the barcode counts for each oligo within replicates were normalized and oligos showing differential expression relative to the plasmid input were identified by modeling a negative binomial with DESeq2 and applying a threshold of 0.01 for the Bonferroni corrected p-value. For sequences that displayed regulatory activity we tested if the reference and alternate allele showed similar activity by applying a t-test on the log transformed RNA/ plasmid ratios for each experimental replicates (Figures S4B-E). Combining independent results from NA12878 and NA9239 using Fisher's method generated a final LCL specific call set. We used an FDR (Benjamini–Hochberg) cutoff of 5% as a threshold for calling
A
uthor Man
uscr
ipt
A
uthor Man
uscr
ipt
A
uthor Man
uscr
ipt
A
uthor Man
uscr
ipt
emVars. Detailed procedures for calculating enrichments, sensitivity/specificity and concordance with established measures of regulatory activity are provided in the Supplemental Experimental Procedures.
Supplementary Material
Refer to Web version on PubMed Central for supplementary material.
Acknowledgments
We would like to thank A. Melnikov, members of the Sabeti lab, the Broad walk-up sequencing platform and C. Daly and K. Groglio of Harvard's Bauer Core Facility for their expertise and advice. This work was supported by NIH grants DP2OD006514 to PCS and K99HG008179 to RT. TSM is supported by NIH grant R01HG006785.
References
Andersson R, Gebhard C, Miguel-Escalada I, Hoof I, Bornholdt J, Boyd M, Chen Y, Zhao X, Schmidl C, Suzuki T, et al. An atlas of active enhancers across human cell types and tissues. Nature. 2014; 507:455–461. [PubMed: 24670763]
Arnold, Gerlach, Stelzer, Boryn, Rath, Stark. Genome-Wide Quantitative Enhancer Activity Maps Identified by STARR-seq. Science. 2013; 339:1074–1077. [PubMed: 23328393]
Barrett JC, Hansoul S, Nicolae DL, Cho JH, Duerr RH, Rioux JD, Brant SR, Silverberg MS, Taylor KD, Barmada MM, et al. Genome-wide association defines more than 30 distinct susceptibility loci for Crohn's disease. Nat Genet. 2008; 40:955–962. [PubMed: 18587394]
Claussnitzer M, Dankel SN, Kim KHH, Quon G, Meuleman W, Haugen C, Glunk V, Sousa IS, Beaudry JL, Puviindran V, et al. FTO Obesity Variant Circuitry and Adipocyte Browning in Humans. The New England Journal of Medicine. 2015; 373:895–907. [PubMed: 26287746] Consortium, T. An integrated encyclopedia of DNA elements in the human genome. Nature. 489:57–
74. [PubMed: 22955616]
Consortium, T. An integrated map of genetic variation from 1,092 human genomes. Nature. 2012; 491:56–65. [PubMed: 23128226]
Cooper G, Shendure J. Needles in stacks of needles: finding disease-causal variants in a wealth of genomic data. Nature Reviews Genetics. 2011; 12:628–640.
Dubnicoff T, Valentine SA, Chen G, Shi T, Lengyel JA, Paroush Z, Courey AJ. Conversion of dorsal from an activator to a repressor by the global corepressor Groucho. Genes Dev. 1997; 11:2952– 2957. [PubMed: 9367978]
Evans DM, Spencer CC, Pointon JJ, Su Z, Harvey D, Kochan G, Oppermann U, Opperman U, Dilthey A, Pirinen M, et al. Interaction between ERAP1 and HLA-B27 in ankylosing spondylitis implicates peptide handling in the mechanism for HLA-B27 in disease susceptibility. Nat Genet. 2011; 43:761–767. [PubMed: 21743469]
Farh K, Marson A, Zhu J, Kleinewietfeld M, Housley W, Beik S, Shoresh N, Whitton H, Ryan R, Shishkin A, et al. Genetic and epigenetic fine mapping of causal autoimmune disease variants. Nature. 2015; 518:337–343. [PubMed: 25363779]
Gjoneska E, Pfenning AR, Mathys H, Quon G, Kundaje A, Tsai LHH, Kellis M. Conserved
epigenomic signals in mice and humans reveal immune basis of Alzheimer's disease. Nature. 2015; 518:365–369. [PubMed: 25693568]
Graham RR, Cotsapas C, Davies L, Hackett R, Lessard CJ, Leon JM, Burtt NP, Guiducci C, Parkin M, Gates C, et al. Genetic variants near TNFAIP3 on 6q23 are associated with systemic lupus erythematosus. Nat Genet. 2008; 40:1059–1061. [PubMed: 19165918]
Grossman SR, Andersen KG, Shlyakhter I, Tabrizi S, Winnicki S, Yen A, Park DJ, Griesemer D, Karlsson EK, Wong SH, et al. Identifying recent adaptations in large-scale genomic data. Cell. 2013; 152:703–713. [PubMed: 23415221]
A
uthor Man
uscr
ipt
A
uthor Man
uscr
ipt
A
uthor Man
uscr
ipt
A
uthor Man
uscr
ipt
Guthridge JM, Lu R, Sun H, Sun C, Wiley GB, Dominguez N, Macwana SR, Lessard CJ, Kim-Howard X, Cobb BL, et al. Two functional lupus-associated BLK promoter variants control cell-type- and developmental-stage-specific transcription. Am J Hum Genet. 2014; 94:586–598. [PubMed: 24702955]
Gymrek M, Willems T, Guilmatre A, Zeng H, Markus B, Georgiev S, Daly MJ, Price AL, Pritchard JK, Sharp AJ. Abundant contribution of short tandem repeats to gene expression variation in humans. Nature Genetics. 2015
Ip YT, Kraut R, Levine M, Rushlow CA. The dorsal morphogen is a sequence-specific DNA-binding protein that interacts with a long-range repression element in Drosophila. Cell. 1991; 64:439–446. [PubMed: 1988156]
De Jager PL, Jia X, Wang J, de Bakker PI, Ottoboni L, Aggarwal NT, Piccio L, Raychaudhuri S, Tran D, Aubin C, et al. Meta-analysis of genome scans and replication identify CD6, IRF8 and TNFRSF1A as new multiple sclerosis susceptibility loci. Nat Genet. 2009; 41:776–782. [PubMed: 19525953]
Kasowski M, Kyriazopoulou-Panagiotopoulou S, Grubert F, Zaugg J, Kundaje A, Liu Y, Boyle A, Zhang Q, Zakharia F, Spacek D, et al. Extensive Variation in Chromatin States Across Humans. Science. 2013; 342:750–752. [PubMed: 24136358]
Kheradpour P, Ernst J, Melnikov A, Rogov P, Wang L, Zhang X, Alston J, Mikkelsen T, Kellis M. Systematic dissection of regulatory motifs in 2000 predicted human enhancers using a massively parallel reporter assay. Genome Research. 2013; 23:800–811. [PubMed: 23512712]
Kwasnieski JC, Fiore C, Chaudhari HG, Cohen BA. High-throughput functional testing of ENCODE segmentation predictions. Genome Research. 2014; 24:1595–1602. [PubMed: 25035418] Lappalainen T, Sammeth M, Friedländer M, Hoen P, Monlong J, Rivas M, Gonzàlez-Porta M,
Kurbatova N, Griebel T, Ferreira P, et al. Transcriptome and genome sequencing uncovers functional variation in humans. Nature. 2013; 501:506–511. [PubMed: 24037378]
Maurano M, Humbert R, Rynes E, Thurman R, Haugen E, Wang H, Reynolds A, Sandstrom R, Qu H, Brody J, et al. Systematic Localization of Common Disease-Associated Variation in Regulatory DNA. Science. 337:1190–1195. 1776604555. [PubMed: 22955828]
McVicker G, van de Geijn B, Degner JF, Cain CE, Banovich NE, Raj A, Lewellen N, Myrthil M, Gilad Y, Pritchard JK. Identification of genetic variants that affect histone modifications in human cells. Science. 2013; 342:747–749. [PubMed: 24136359]
Melnikov A, Murugan A, Zhang X, Tesileanu T, Wang L, Rogov P, Feizi S, Gnirke A, C, Kinney J, et al. Systematic dissection and optimization of inducible enhancers in human cells using a massively parallel reporter assay. Nature Biotechnology. 2012; 30:271–277.
Mogno I, Kwasnieski J, Cohen B. Massively parallel synthetic promoter assays reveal the in vivo effects of binding site variants. Genome Research. 2013; 23:1908–1915. [PubMed: 23921661] Musunuru K, Strong A, Frank-Kamenetsky M, Lee NE, Ahfeldt T, Sachs KV, Li X, Li H, Kuperwasser
N, Ruda VM, et al. From noncoding variant to phenotype via SORT1 at the 1p13 cholesterol locus. Nature. 2010; 466:714–719. [PubMed: 20686566]
Ow DW, DE Wet JR, Helinski DR, Howell SH, Wood KV, Deluca M. Transient and stable expression of the firefly luciferase gene in plant cells and transgenic plants. Science. 1986; 234:856–859. [PubMed: 17758108]
Parker SC, Stitzel ML, Taylor DL, Orozco JM, Erdos MR, Akiyama JA, van Bueren KL, Chines PS, Narisu N, Black BL, et al. Chromatin stretch enhancer states drive cell-specific gene regulation and harbor human disease risk variants. Proc Natl Acad Sci U S A. 2013; 110:17921–17926. [PubMed: 24127591]
Patwardhan R, Hiatt J, Witten D, Kim M, Smith R, May D, Lee C, Andrie J, Lee SI, Cooper G, et al. Massively parallel functional dissection of mammalian enhancers in vivo. Nature Biotechnology. 2012; 30:265–270.
Schaub MA, Boyle AP, Kundaje A, Batzoglou S, Snyder M. Linking disease associations with regulatory information in the human genome. Genome Res. 2012; 22:1748–1759. [PubMed: 22955986]
A
uthor Man
uscr
ipt
A
uthor Man
uscr
ipt
A
uthor Man
uscr
ipt
A
uthor Man
uscr
ipt
Shi Y, Seto E, Chang LS, Shenk T. Transcriptional repression by YY1, a human GLI-Krüppel-related protein, and relief of repression by adenovirus E1A protein. Cell. 1991; 67:377–388. [PubMed: 1655281]
Tishkoff SA, Reed FA, Ranciaro A, Voight BF, Babbitt CC, Silverman JS, Powell K, Mortensen HM, Hirbo JB, Osman M, et al. Convergent adaptation of human lactase persistence in Africa and Europe. Nat Genet. 2007; 39:31–40. [PubMed: 17159977]
Veyrieras JBB, Kudaravalli S, Kim SY, Dermitzakis ET, Gilad Y, Stephens M, Pritchard JK. High-resolution mapping of expression-QTLs yields insight into human gene regulation. PLoS Genet. 2008; 4:e1000214. [PubMed: 18846210]
Vockley CM, Guo C, Majoros WH, Nodzenski M, Scholtens DM, Hayes GM, Lowe WL, Reddy TE. Massively parallel quantification of the regulatory effects of non-coding genetic variation in a human cohort. Genome Research. 2015 doi:gr.190090.115.
A
uthor Man
uscr
ipt
A
uthor Man
uscr
ipt
A
uthor Man
uscr
ipt
A
uthor Man
uscr
ipt
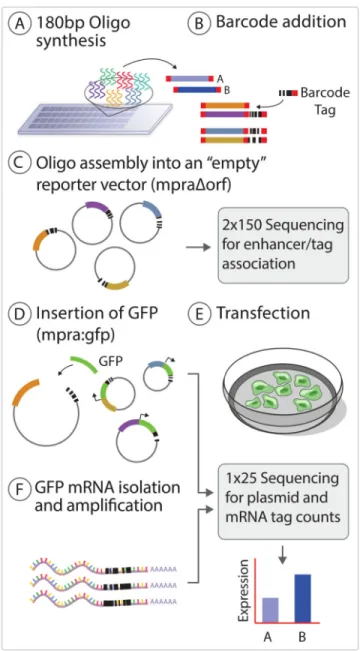
Figure 1. Overview of the MPRA workflow
(A) Oligos are synthesized as 180 mers followed by cleavage off of the array. (B) The ssDNA is amplified, barcoded and converted to dsDNA by emulsion PCR which is then cloned into a reporter vector which has had the reporter gene removed to create the mpra:Δorf library (C). The plasmid library is linearized between the barcode and oligo sequence by restriction digest and a minimal promoter and GFP open reading frame is inserted by gibson assembly to create the final mpra:gfp library (D) which is used for transfection into the desired cell type (E). RNA is harvested from the transfected cells, mRNA is captured, sequenced (F) and barcode counts are compared to the count estimates from the sequencing of the mpra:orf library (D).
A
uthor Man
uscr
ipt
A
uthor Man
uscr
ipt
A
uthor Man
uscr
ipt
A
uthor Man
uscr
ipt
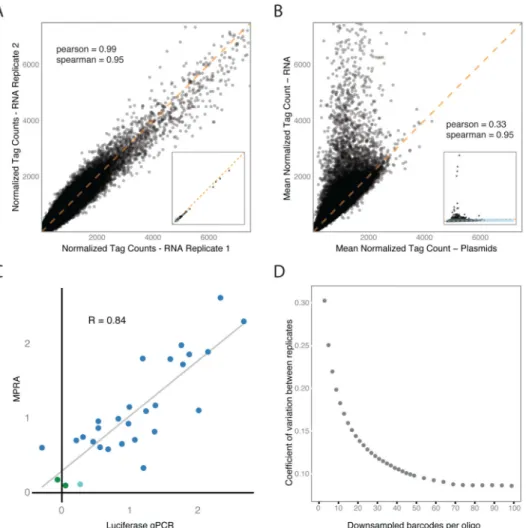
Figure 2. Experimental reproducibility
(A) Correlation of normalized oligo counts between two transfection replicates of NA12878. (B) Average normalized oligo counts for all five plasmid replicates compared to normalized counts for the five replicates from NA12878 RNA. Axis across all plots were kept constant with subplots added when additional datapoint were excluded from the main plot (A & B). Blue boxes within the inserts signify the displayed area of the main plots. (C) Luciferase assay validation of estimated effect sizes for individual oligos tested by MPRA. Each point represents the average of 8 MPRA and 4 qPCR replicates. qPCR values were normalized to two non-significant sequences (green points) as determined by MPRA. Blue points:
significantly expressed sequences from MPRA; cyan point: marginally significant sequence. Correlation is provided as Pearson's R. (D) Coefficient of variation between experimental replicates as a product of the number of barcodes tagging an oligo.
A
uthor Man
uscr
ipt
A
uthor Man
uscr
ipt
A
uthor Man
uscr
ipt
A
uthor Man
uscr
ipt
Figure 3. Validation of expression modifying sequences discovered by MPRA
(A) Distribution of effect sizes (log2 of the RNA/plasmid ratio) for oligos that were detected as being under or over expressed. (B) Log2(odds ratio) for the enrichment of regulatory
annotations in the 3432 MPRA active sequences within LCLs relative to non-active sequences. (C) Log2(odds ratio) for the enrichment in LCL DHS sites for active sequences
shared between LCLs and HepG2s (blue), active in only LCLs (red) and active in only HepG2 cells (green). Asterisk: fisher's test p-value < 0.01.
A
uthor Man
uscr
ipt
A
uthor Man
uscr
ipt
A
uthor Man
uscr
ipt
A
uthor Man
uscr
ipt
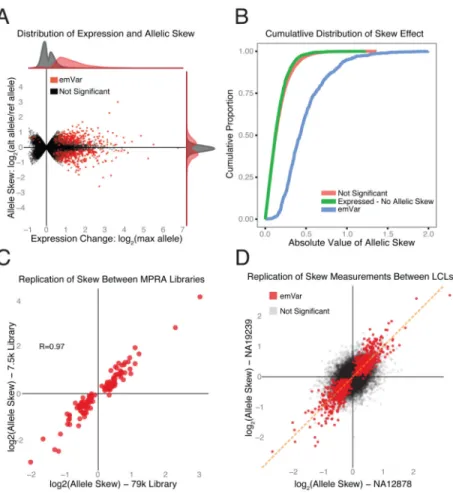
Figure 4. Expression-modulating variant (emVar) reproducibility and effect size distribution
(A) Distribution of expression strength (x-axis) and allelic skew (y-axis) for all 29k variants. (B) Cumulative distribution of the absolute difference of the log2 fold change between the reference and alternate allele for emVars (blue), expression positive variants that were not detected as emVars (green) and all other variants (red). (C) Allelic skew as measured by MPRA for 127 positive controls values discovered in the original 79k library (x-axis) that were tested in the 7.5k library (y-axis). (D) Comparison of allelic skew as estimated from the mean of 2 independent LCLs (NA12878 & NA19239). Red points in both plots denote variants called as emVars from the joint LCL analysis. Correlation is provided as Pearson's R.
A
uthor Man
uscr
ipt
A
uthor Man
uscr
ipt
A
uthor Man
uscr
ipt
A
uthor Man
uscr
ipt
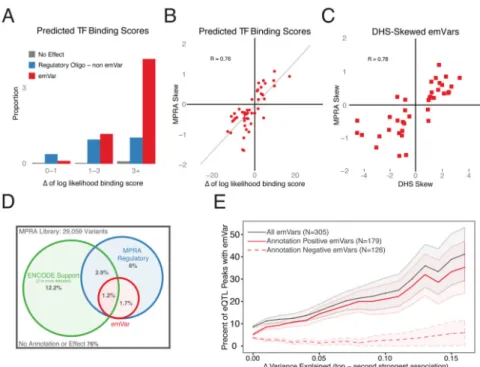
Figure 5. emVar concordance with existing measures of allelic effect
(A) Proportion of variants by their MPRA classification that fall in an ENCODE
transcription factor (TF) ChIP-seq peak and contain the predicted motif. Variants are binned according to the difference in predicted binding strength between the two alleles. (For multiple TF associations, the one with the largest delta is used). (B) MPRA skew estimates for LCL emVars with TF motif/ChIP annotations compared to the predicted change in binding between the two alleles. (C) Comparison between skew seen in MPRA and that in DHS for all emVars passing stringent filters for high-confidence DHS skew sites (methods). Skew is calculated as log2(Alt-allele counts / Ref-allele counts). (D) Overlap between annotation-positive sites (methods), sequences detected as regulatory by MPRA and emVars. (E) Proportion of EUR eQTLs explained by an emVar plotted against the difference in variance explained between the top variant and the second strongest association in the EUR eQTL analysis. grey line: all emVars, solid red line: annotation positive emVars, dashed red line: annotation negative emVars. All Correlations are provided as Pearson’s R.
A
uthor Man
uscr
ipt
A
uthor Man
uscr
ipt
A
uthor Man
uscr
ipt
A
uthor Man
uscr
ipt
Figure 6. emVars associated with ankylosing spondylitis and systemic lupus erythematosus
(A) Plot of the PTGER4 locus which overlaps a GWAS peak for ankylosing spondylitis displaying ChIA-PET and ENCODE annotations (top 6 tracks), observed allelic skew (track 7) and expression strength (track 8) from MPRA. Significant variants for expression (blue) and skew (red) in the MPRA data indicated by color; black: non-significant. (B) MPRA expression values of the PTGER4 variant rs9283753 in LCL's normalized to the plasmid library. (C) LCL eQTL results in EUR and YRI populations for the PTGER4 with rs9283753. (D & E) PTGER4 expression as measured by qPCR for two LCL's that underwent allelic replacement at rs9283753. (F) Plot of the FAM167A-BLK locus associated with systemic lupus erythematosus. (G) MPRA expression values of the chr8:11353110 deletion variant in LCL's normalized to the plasmid library. (H & I) LCL eQTL results in EUR and YRI populations for the FAM167A and BLK associations.
A
uthor Man
uscr
ipt
A
uthor Man
uscr
ipt
A
uthor Man
uscr
ipt
A
uthor Man
uscr
ipt
A
uthor Man
uscr
ipt
A
uthor Man
uscr
ipt
A
uthor Man
uscr
ipt
A
uthor Man
uscr
ipt
T ab le 1 High conf idence emVars associated with kno
wn GW AS loci GW AS T rait Gene(s) Sites T ested by MPRA
Encode & emV
ar c chr P os (hg19) r 2 with lead GW AS SNP All a Encode b emV ar Mean platelet v olume KIF1B 26 4 3 rs4240912 1 10437778 0.92 rs6670157 1 10458439 0.92 W ilms tumor DDX1 79 3 1 rs60016948 2 15728544 1
Renal function-related traits
P AX8 18 5 1 rs7576384 2 113993385 0.96 Ank ylosing spondylitis PTGER4 5 4 1 rs9283753 5 40490609 0.99 Crohn's disease ERAP2 147 25 2 rs1363974 5 96293816 0.91 Nasopharyngeal carcinoma IFITM4P ,HLA-H,HCG4P5,HLA-J,HLA-G 73 22 5 rs116025516 6 29910189 0.98 Beta-2 microglub ulin plasma le v els HCG27,HLA-L 41 39 1 rs116587107 6 31239227 0.92
Systemic lupus erythematosus
BLK,F AM167A 16 14 1 chr8:11353110:D 8 11353110 1
Narcolepsy with cataple
xy UBXN2B 12 3 1 rs56316188 8 59323811 0.95 IgG glycosylation B4GAL T1 12 5 1 rs12342831 9 33124872 1 Inflammatory bo wel disease MAP3K8 31 2 3 rs306587 10 30722908 0.98 Crohn's disease CREM 241 22 5 rs16935880 10 35415468 0.99 rs4934730 10 35415555 0.99
Body mass inde
x C1QTNF4 26 1 1 rs35184771 11 47475189 0.97 Atopic dermatitis AP5B1,O V OL1 2 1 1 rs10791824 11 65559266 0.91
Mean corpuscular hemoglobin
PTPLAD1 60 7 1 rs28640237 15 66070962 0.99
Body mass inde
x, Obesity , W eight EIF3CL,EIF3C,SPNS1,CDC37P1 137 33 4 rs7198606 16 28875122 1 P arkinson's disease STX4 50 10 2 rs58726213 16 31044683 0.95 rs11865038 16 31095171 1
Bone mineral density
C17orf53 56 15 1 rs227578 17 42210189 1
Coronary heart disease
UBE2Z 105 18 8 rs4378658 17 46993370 0.99 Li v er enzyme le v
els (alkaline phosphatase)
GINS1,ABHD12 319 45 5 rs2258769 20 25276680 0.99 a All v
ariants tested in this study by MPRA with and r2 of 0.9 or greater to the lead eQTL v
ariant.
b V
ariants within the tested subset classif
ied as ha
ving strong encode support (Supplemental Experimental Procedures).
c emV
ars that were classif
ied has ha