HAL Id: inserm-03217223
https://www.hal.inserm.fr/inserm-03217223
Submitted on 4 May 2021HAL is a multi-disciplinary open access archive for the deposit and dissemination of sci-entific research documents, whether they are pub-lished or not. The documents may come from teaching and research institutions in France or abroad, or from public or private research centers.
L’archive ouverte pluridisciplinaire HAL, est destinée au dépôt et à la diffusion de documents scientifiques de niveau recherche, publiés ou non, émanant des établissements d’enseignement et de recherche français ou étrangers, des laboratoires publics ou privés.
Carbon monoxide-induced metabolic switch in
adipocytes improves insulin resistance in obese mice
Laura Braud, Maria Pini, Lucie Muchova, Sylvie Manin, Hiroaki Kitagishi,
Daigo Sawaki, Gabor Czibik, Julien Ternacle, Geneviève Derumeaux, Roberta
Foresti, et al.
To cite this version:
Laura Braud, Maria Pini, Lucie Muchova, Sylvie Manin, Hiroaki Kitagishi, et al.. Carbon monoxide-induced metabolic switch in adipocytes improves insulin resistance in obese mice. JCI Insight, Amer-ican Society for Clinical Investigation, 2018, 3 (22), pp.e123485. �10.1172/jci.insight.123485�. �inserm-03217223�
1
Carbon monoxide-induced metabolic switch in adipocytes
1
improves insulin resistance in obese mice
2 3
Laura Braud1,2, Maria Pini2,3, Lucie Muchova4, Sylvie Manin1,2, Hiroaki Kitagishi5, 4
Daigo Sawaki2,3, Gabor Czibik2,3, Julien Ternacle2,3, Geneviève Derumeaux2,3, 5
Roberta Foresti1,2*, Roberto Motterlini1,2* 6
7 8
1
Inserm U955, Team 12, Créteil 94000, France 9
2
Faculty of Medicine, University Paris-Est, Créteil 94000, France 10
3
Inserm U955, Team 8, Créteil 94000, France 11
4
Institute of Medical Biochemistry and Laboratory Diagnostics, 1st Faculty of 12
Medicine, Charles University, Prague, Czech Republic 13
5
Department of Molecular Chemistry and Biochemistry, Faculty of Science and 14
Engineering, Doshisha University, Kyotanabe, Kyoto, 610-0321, Japan 15
16
*Corresponding authors: Roberto Motterlini and Roberta Foresti, Inserm U955, Team 17
12, Faculty of Medicine, University Paris-Est, 24 rue du Général Sarrail, 94000 18
Créteil. Phone: +33-149813637. Email address: roberto.motterlini@inserm.fr; 19 roberta.foresti@inserm.fr. 20 21 22 23 24
2
Abstract
25
Obesity is characterized by accumulation of adipose tissue and is one the most 26
important risk factors in the development of insulin resistance. Carbon monoxide-27
releasing molecules (CO-RMs) have been reported to improve the metabolic profile 28
of obese mice but the underlying mechanism remains poorly defined. Here, we show 29
that oral administration of CORM-401 in high fat diet (HFD) obese mice resulted in a 30
significant reduction in body weight gain accompanied by a marked improvement in 31
glucose homeostasis. We further unmasked a novel action by which CO 32
accumulates in visceral adipose tissue, uncouples mitochondrial respiration in 33
adipocytes ultimately leading to a concomitant switch towards glycolysis. This was 34
accompanied by enhanced systemic and adipose tissue insulin sensitivity as 35
indicated by a lower blood glucose and increased Akt phosphorylation. Our findings 36
indicate that the transient uncoupling activity of CO elicited by repetitive 37
administration of CORM-401 is associated with lower weight gain and increased 38
insulin sensitivity during HFD. Thus, prototypic compounds that release CO could be 39
investigated for developing promising insulin-sensitizing agents. 40 41 42 43 44 45
3
Introduction
46 47
Obesity is one the most important risk factors leading to metabolic dysfunction 48
and type 2 diabetes (1). Excessive accumulation of visceral fat is accompanied by 49
chronic low grade inflammation contributing to the development of insulin resistance, 50
hyperglycemia and adipose tissue dysfunction (2, 3). Whether malfunction of 51
mitochondria, which play a crucial role in cellular bioenergetics, is implicated in 52
adipose tissue dysfunction is still debated (4). Indeed, defective mitochondrial activity 53
can lead to impaired fatty acid oxidation and glycolysis, thereby causing disruption of 54
lipid and glucose metabolism (4). It has also been reported that mitochondrial 55
oxidative stress in adipocytes diminishes insulin-stimulated GLUT4 translocation and 56
glucose uptake resulting in insulin resistance (5). In contrast, an increased glucose 57
tolerance and insulin sensitivity was observed in mice with genetically altered 58
mitochondrial oxidative phosphorylation (6) and an enhanced mitochondrial capacity 59
was described in human subjects with insulin resistance (7). Nevertheless, 60
pharmacological interventions that target mitochondria for the treatment of diabetes 61
have attracted a strong interest over the last decade (8, 9). For example, 62
mitochondrial uncoupling agents such as 2,4-dinitrophenol or niclosamide 63
ethanolamine have demonstrated promising effects on diabetic symptoms in mice by 64
both promoting substrate oxidation and reducing oxidative stress in mitochondria 65
(10, 11). 66
Emerging evidence indicates that carbon monoxide (CO) modulates metabolism 67
in different cell types (12–15). CO is a ubiquitous gaseous molecule produced in 68
mammalian cells and tissues through the breakdown of heme catalyzed by heme 69
oxygenase (HO) enzymes (16). Initially considered as a toxic product, CO is now 70
recognized as a key signaling molecule with vasoactive and cardioprotective effects 71
as well as anti-thrombotic, anti-apoptotic and anti-inflammatory properties (17, 18). In 72
relation to cellular metabolism, we have shown that small amounts of CO increase 73
O2 consumption in cells via a mild uncoupling activity in mitochondria that is
74
accompanied by changes in the production of reactive oxygen species (12). The use 75
of CO-releasing molecules (CO-RMs), a class of compounds that release controlled 76
quantities of CO into cells and tissues, has helped to unravel this novel mechanism 77
of action and identify the potential therapeutic effects of this gas (12, 17, 19, 20). 78
4 Accordingly, the water soluble CORM-A1 has been shown to improve dietary-79
induced obesity, hyperglycemia and insulin resistance in mice (21, 22). However, the 80
mechanisms underlying this beneficial outcome of CO in obesity have been poorly 81
investigated. 82
In the current study, we examined the effect of CORM-401 on whole body insulin 83
sensitivity and glucose tolerance in C57BL6 mice subjected to an obesogenic high 84
fat diet (HFD). We report that oral administration of CORM-401 reduces the gain in 85
body weight and improves insulin resistance in HFD obese mice. CO delivered by 86
CORM-401 to adipose tissue and cells uncouples mitochondrial respiration leading 87
to an increase in glycolysis to maintain ATP levels. This metabolic switch was 88
associated with higher phosphorylation of the insulin signaling effector Akt and was 89
accompanied by an amelioration of systemic and adipocytes insulin sensitivity. Our 90
data demonstrate that the effect of CO on cellular bioenergetics in adipose tissue 91
serves to counteract insulin resistance in obese mice. 92 93 94 95 96 97
5
Results
98 99
Oral administration of CORM-401 reduces body weight gain and improves
100
insulin resistance in HFD-induced obesity in mice
101
We have shown recently that CORM-401, a manganese-based compound that 102
releases 3 equivalents of CO/mole (Structure shown in Supplemental Table 1), 103
exerts a stronger vasodilatory effect and angiogenic activity than CORM-A1, a boron 104
compound that liberates only 1 CO/mole (20). Thus, it appears that CORM-401 105
exhibits enhanced pharmacological activities due to liberation of higher amounts of 106
CO. Since CORM-401 has never been tested in vivo, we first determined the levels 107
of blood COHb in mice receiving CORM-401 at two different doses after oral gavage. 108
Figure 1A and Supplemental Figure 1A show that COHb significantly increased to 109
2.5% and 4.5% 30 min after administration of CORM-401 at 15 and 30 mg/kg, 110
respectively, and gradually decreased to control levels over a period of 48 h. These 111
data confirm that CO is released by CORM-401 and delivered into the circulation in a 112
dose-dependent fashion. Based on this kinetic, we decided to assess the metabolic 113
effects of CORM-401 (15 and 30 mg/kg) administered three times a week to mice 114
fed either a standard diet (SD) or a high fat diet (HFD) for 14 weeks. As shown in 115
Supplemental Figure 1B-E, CORM-401 decreased body weight gain and improved 116
both glucose metabolism and insulin resistance in a dose-dependent manner in HFD 117
mice but the effect was significant only at the dose of 30 mg/kg. Because consistent 118
results were obtained with 30 mg/kg CORM-401, we decided to continue our 119
investigation using this dose in two distinct protocols whereby CORM-401 was given 120
in concomitance with the HFD (prevention group, HFD+CORM-P) or 6 weeks after 121
the beginning of HFD ( treatment group, HFD+CORM-T). Body weight gain was 122
significantly increased by the HFD and was reduced by CORM-401 both in the 123
prevention and the treatment group (Figure 1B and C) as reflected by decreased 124
plasma leptin (Figure 1M). Changes in body weight were not due to differences in 125
food intake between the groups (Table 1). In addition, mice fed with SD and 126
SD+CORM-401 displayed similar body weight, suggesting that the compound was 127
well tolerated and the reduced weight gain in HFD-fed mice was not due to a toxic 128
effect of the drug (Supplemental Figure 2A and B). In addition, we did not observe 129
any change in cardiac function parameters by CORM-401 compared to untreated 130
6 obese mice (Supplemental Table 2). Interestingly, CORM-401 did not affect glucose 131
metabolism in SD mice (Supplemental Figure 2C-F) but improved whole-body 132
glucose tolerance and insulin sensitivity in HFD mice, as shown by a significant 133
decrease in glycemia (Figure 2D and E). In line with this, CORM-401 decreased 134
fasting plasma glycemia and insulin, improving the calculated HOMA-IR in HFD mice 135
(Figure 1 J-L), while plasma cholesterol and triglyceride levels remained unchanged 136
(Figure 1H and I). These results indicate that CORM-401 counteracts body weight 137
gain, impaired glucose tolerance and insulin resistance induced by HFD in mice. 138
139
CORM-401 remodels adipose tissue in obese mice
140
We next investigated the effect of CORM-401 on adipose tissue metabolic and 141
inflammatory profiles. Even though eWAT weight was not affected by CORM-401 142
(Figure 2A and B), the size of adipocytes was significantly reduced by 25% in the 143
HFD+CORM-P group (Figure 2A and C). Interestingly, conditioned media of eWAT 144
collected from both mice groups administered with CORM-401 displayed lower non-145
esterified free fatty acid (NEFA) content compared to the HFD group (Figure 2D). 146
Furthermore, the mRNA expression of the key metabolic genes PParg, Adiponectin 147
Fabp4, Hsl, Glut4, Irs1, Hk2 and Vegf was decreased by the HFD (Figure 2E) and
148
restored to basal levels by CORM-401 in the P but not in HFD+CORM-149
T group. In contrast, mRNA expression of PPara, Pgc1a and Cpt1 was decreased by 150
HFD but remained unchanged after CORM-401 treatment (data not shown). 151
Significant remodeling in other fat pads, particularly in brown adipose tissue (BAT), 152
was evident in the reduction of weight and lipid content in both groups administered 153
with CORM-401 (Supplemental Figure 3A-E). Similarly to eWAT, mRNA expression 154
of the metabolic genes PParg, Vegf, Adiponectin, Pgc1a and Ucp1 were decreased 155
in BAT of HFD-obese mice and fully or partially restored in the HFD+CORM-P group 156
(Supplemental Figure 3G). Conversely, gene expression of metabolic markers in 157
subcutaneous adipose tissue (SubWAT) was not affected by CORM-401 158
(Supplemental Figure 3F). Despite the fact that HFD did not induce a high-grade 159
inflammation in our model, CORM-401 still modulated local inflammation in obese 160
mice. First, the increased macrophage infiltration induced by HFD was virtually 161
abolished by CORM-401 administration (Figure 2F-G), although the induction of Ccl2 162
was unchanged by the compound (Figure 2H). Secondly, CORM-401 decreased 163
7
Hmox-1 expression induced by HFD (Figure 2I) and the levels of IL-6, IL-1β and
IL-164
10 in eWAT conditioned media (Figure 2J). These data demonstrate that the positive 165
effects of CORM-401 on weight gain and metabolism in obese mice correlate with an 166
amelioration of adipose tissue structure, function and inflammation. 167
CORM-401 had no effect on the liver, another crucial organ for the maintenance 168
of glucose homeostasis. In fact, CORM-401 did not modify the increase in liver 169
weight (1.5-fold) and lipid content caused by HFD (Supplemental Figure 4A-C) and 170
only marginally affected the deregulation of the metabolic genes PParg, Hk2, Irs1, 171
Hsl, Fabp4 induced by HFD (Supplemental Figure 4D). We note that the plasmatic
172
indexes of liver injury were not impacted by HFD (Table 2), suggesting non-173
advanced hepatic steatosis without major injuries. 174
175
CO delivered by CORM-401 increases systemic and adipocytes
insulin-176
sensitivity
177
To elucidate whether the improved insulin resistance promoted by CORM-401 is 178
linked to an effect of CO on adipocytes, we assessed insulin sensitivity in eWAT and 179
3T3-L1 adipocytes. We first confirmed that CO content in eWAT increased 180
significantly 2 and 6 h after oral gavage with CORM-401 compared to eWAT from 181
mice treated with PBS (CON) or inactive CORM-401 (iCORM) (Figure 3A). We then 182
determined glucose levels in mice treated with PBS, iCORM or CORM-401 1 h prior 183
to intraperitoneal injection of insulin (Figure 3B) and showed that only CORM-401 184
enhanced systemic insulin sensitivity (Figure 3C and D). In addition, phosphorylation 185
of protein kinase B (Akt) induced by insulin was increased in eWAT from CORM-186
401-treated mice compared to control (Figure 3E and F). This response was 187
recapitulated in eWAT of obese mice following oral gavage with CORM-401 188
(Supplemental Figure 5). As observed in eWAT, CO content in 3T3-L1 adipocytes 189
exposed to 50 µM CORM-401 was significantly higher compared to cells treated with 190
PBS or iCORM (Figure 3G). Likewise, only CORM-401-treated adipocytes exhibited 191
increased Akt phosphorylation in basal conditions and after stimulation with insulin 192
(20 nM) for 10 min (Figure 3H, 3I and J). These data demonstrate that CO liberated 193
from CORM-401 accumulates in adipose tissue and regulates Akt signaling to 194
improve insulin sensitivity. 195
8
CO uncouples mitochondrial respiration and increases glycolytic rate in
197
adipocytes
198
We next investigated the effects of CORM-401 on adipocyte bioenergetics based 199
on the emerging evidence that CO is a metabolic regulator in vascular, inflammatory 200
and cancer cells (12, 23). Using MitoStress assays, we showed that CORM-401-201
treated 3T3-L1 adipocytes display a concentration-dependent increase in oxygen 202
consumption rate (OCR) even in the presence of the ATP synthase inhibitor 203
oligomycin (Figure 4A and Supplemental Figure 4), resulting in decreased ATP-204
linked respiration (or coupled respiration) and higher proton leak (or uncoupled 205
respiration) compared to untreated cells (Figure 4B). This effect was followed by 206
reduced respiration in response to the uncoupling agent FCCP and augmented non-207
mitochondrial respiration after addition of rotenone/antimycin A. These results 208
indicate an uncoupling activity of CORM-401 in adipocytes, as previously observed 209
in other cell types (12). Interestingly, in the absence of inhibitors of the electron 210
transport chain, CORM-401 induced a transient increase in OCR lasting for 2 to 3 h 211
depending on the dose used. This effect was concomitant with a rise in glycolysis as 212
assessed by the extracellular acidification rate (ECAR) (Figure 4C and D). 213
Accordingly, intracellular lactate was increased by CORM-401 (Figure 4E). A 214
glycolysis stress test confirmed that CORM-401, but not iCORM, enhanced ECAR in 215
adipocytes following sequential addition of glucose, oligomycin and 2-DG (Figure 4F 216
and G). Increased glycolysis was not an artifact due to acidification of the medium by 217
CORM-401 since blocking this pathway with 2-DG completely prevented the effects 218
of CORM-401. 219
Notably, intracellular ATP levels were higher in CORM-401-treated adipocytes 220
compared to iCORM, suggesting that glycolysis is engaged as a compensatory 221
mechanism for maintenance of energy (Figure 4H). ATP content was diminished by 222
2-DG in iCORM and CORM-401-treated cells; however, this decrease was more 223
pronounced in adipocytes exposed to CORM-401, likely a result of the uncoupling 224
effect of CO and the inhibition of respiration caused by CORM-401 at the end of the 225
experiment (Figure 4H). We wanted to verify if this metabolic switch induced by 226
CORM-401 occurs in vivo by assessing OCR and ECAR in eWAT collected from 227
mice treated with iCORM or CORM-401 (Figure I). Although no significant 228
differences were observed in basal OCR between the two groups, the response to 229
9 FCCP was lower after treatment with CORM-401 (Figure 4J), as shown in cultured 230
adipocytes. Most importantly, ECAR was also higher in eWAT punches from CORM-231
401-treated mice (Figure 4K) and lactate levels in conditioned medium from eWAT 232
collected from mice receiving CORM-401 was increased (Figure 4L), confirming 233
stimulation of glycolysis by CO in vivo. 234
235
ATP counteracts CO induced-metabolic switch in adipocytes and reverses
CO-236
induced increase in insulin sensitivity
237
Our data indicate that CO induces a metabolic switch, favoring glycolysis, in 238
adipocytes both in vitro and in vivo. If CO decreases mitochondrial ATP production 239
because of transient uncoupling and/or partial inhibition of respiration leading to 240
increased glycolysis to maintain ATP levels, we postulated that ATP per se could 241
serve as the molecular trigger of this metabolic switch. To investigate this 242
hypothesis, we artificially delivered ATP packaged in liposomes to adipocytes and 243
examined the effects of CO on bioenergetics. ATP levels significantly increased in 244
adipocytes after exposure to encapsulated-ATP (Figure 5A). Importantly, exogenous 245
ATP supplementation counteracted the rise in ECAR as well as lactate elicited by 246
CORM-401 without affecting the increase in OCR (Figure 5B-D). Furthermore, ATP 247
delivery to adipocytes reversed the increase in insulin-dependent Akt 248
phosphorylation induced by CO (Figure 5E-F). Thus, the suppression of ECAR and 249
Akt phosphorylation by ATP suggests that the increase in glycolysis by CO is a 250
consequence of the uncoupling action of CO and is directly implicated in the 251
improved insulin sensitivity observed in adipocytes. 252
10
Discussion
254 255
We report in this study that treatment with the CO-releasing agent CORM-401 256
decreases gain in body weight and markedly ameliorates glucose tolerance and 257
insulin resistance in HFD-induced obese mice. We show that this effect is associated 258
with prevention of adipose tissue alterations as indicated by restoration in metabolic 259
gene expression, suppression of macrophage infiltration and reduction in key 260
inflammatory markers (IL-6, IL-1β and HO-1) characteristic of obesity. From a 261
mechanistic point of view, we further show that CORM-401: 1) increases insulin 262
sensitivity in adipose tissue by activation of Akt phosphorylation and 2) triggers a 263
metabolic switch that is dependent on mitochondrial uncoupling by CO and is 264
accompanied by an increase in glycolysis and lactate production. These results 265
reveal an important role of CO in regulating bioenergetic metabolism in adipose 266
tissue thus counteracting the deleterious consequences of obesity. 267
We observed that administration of CORM-401 for the whole duration of HFD 268
(CORM-P) was more effective in reducing body weight gain than treatment with 269
CORM-401 starting 6 weeks after the beginning of the HDF regime (CORM-T). This 270
effect is most likely due to a longer period of exposure to CO since we noticed that a 271
significant decrease in body weight becomes apparent in both groups 6 weeks after 272
the first administration of CORM-401. Despite these differences, both groups 273
exhibited the same improvement in glucose tolerance and insulin resistance, 274
suggesting that the effect of CORM-401 on body weight is not the only factor 275
explaining a beneficial role of CO on obesity-induced metabolic dysfunction. Indeed, 276
a lower glycemia and increased insulin sensitivity were also found after one single 277
administration of CORM-401 in lean mice, corroborating a direct pharmacological 278
action of CO on glucose metabolism. When we focused on visceral adipose tissue 279
(eWAT), which undergoes significant structural and functional changes during 280
obesity, we also observed some interesting differences. Although CORM-401 did not 281
affect the increased weight of eWAT in HFD-fed mice, a significant reduction in the 282
size of adipocytes and a restoration of metabolic gene expression were evident in 283
the CORM-P group. These effects correlate with the more pronounced decrease in 284
weight gain in this group. However, both CORM-P and CORM-T groups displayed a 285
similar reduction in the secretion of non-esterified fatty acid, infiltration of 286
11 macrophages and production of the pro-inflammatory cytokine IL-6 in eWAT, 287
supporting the idea that the pharmacological action mediated by CO on these 288
markers is also independent of the decrease in body weight gain. In particular, 289
inhibition of macrophage infiltration and the marked suppression of IL-6, a cytokine 290
strongly implicated in development of metabolic dysfunction during obesity (24, 25), 291
indicate another potential mechanism by which CORM-401 exerts its beneficial effect 292
on adipose tissue and insulin resistance. We also observed that treatment with 293
CORM-401 diminishes HO-1 gene induction caused by HFD in adipose tissue. This 294
is in line with previous studies showing that HO-1 is increased during HFD in mice 295
(21) and humans (26). HO-1 up-regulation in adipose tissue may be part of the 296
adaptive response mounted by the organism to counteract the inflammatory and 297
metabolic stress elicited by HFD. In fact, systemic induction of HO-1 by cobalt 298
protoporphyrin or genetic over-expression of HO-1 reduces adiposity and improves 299
insulin sensitivity in mice (27–30). However, the role of HO-1 in specific organs 300
involved in metabolic regulation is still controversial since it has also been reported 301
that macrophage and hepatic HO-1 deletion protect against insulin resistance and 302
inflammation (26, 31). Notably, in our study we found that CORM-401 does not have 303
any major effect on the liver. Thus, despite the fact that the liver is a crucial organ for 304
the maintenance of glucose, the findings of this study strongly suggest that the 305
beneficial effect of CO on glucose metabolism is mainly driven by its interaction with 306
adipose tissue. 307
Our results confirm previous findings showing that CORM-A1, another CO-308
releasing agent, significantly diminishes body weight gain and insulin resistance 309
when given intraperitoneally to HFD-fed mice for 30 weeks (17). A difference in our 310
study is that CORM-401 was administered orally to mice. In addition, we advance 311
the current knowledge on the pharmacological properties of CO-RMs by reporting 312
that a transient increase in COHb levels is associated with accumulation of CO 313
within the adipose tissue. Thus, we demonstrate that CO reaches the adipose tissue 314
and modulates its function in vivo. This finding is further supported by the complete 315
lack of effects by inactive CORM-401, which is depleted of CO. Importantly, we 316
identified that CO directly impacts insulin sensitivity since phosphorylation of Akt, a 317
major pathway implicated in insulin signaling, is significantly enhanced in adipocytes 318
and adipose tissue after CORM-401 treatment. Despite the fact that increased Akt 319
12 phosphorylation by CO has been reported in other cell types and tissues (32–34), 320
the specific activation of this signal transduction pathway in adipose tissue likely 321
explains the effect of CO on glucose metabolism independently from the reduction in 322
weight gain. 323
The additional mechanism that most likely accounts for an improved glucose 324
tolerance is the switch of adipose tissue metabolism towards glycolysis mediated by 325
CO. This effect was confirmed by increased lactate production in adipocytes and in 326
the secretome of adipose tissue after exposure to CORM-401, suggesting 327
augmented glucose utilization. This metabolic switch occurred in concomitance with 328
a rise in oxygen consumption and a decrease in ATP-linked respiration by CORM-329
401, which we attribute to an uncoupling activity by CO that we have demonstrated 330
previously in isolated mitochondria as well as in endothelial and microglia cells (12, 331
15, 35–37). Thus, a potential defective ATP production in response to CO-mediated 332
uncoupling would trigger glycolysis as a compensatory mechanism to preserve 333
energy levels leading to improved systemic glucose profile. Indeed, ATP levels were 334
maintained after CORM-401 treatment in adipocytes and were significantly 335
decreased only in the presence of the glycolysis inhibitor 2-deoxyglucose. In 336
addition, direct delivery of ATP into adipocytes prevented the metabolic switch 337
(glycolysis and lactate production) and the increase in insulin sensitivity (Akt 338
phosphorylation) without altering the uncoupling effect caused by CO. That is, when 339
ATP is artificially raised in adipocytes, cells sense adequate energy levels and do not 340
engage glycolysis, even though a diminished mitochondrial ATP production by the 341
uncoupling activity of CO is still occurring. The increase in glycolysis exerted by CO 342
in adipocytes is reminiscent of the action of metformin, an antidiabetic drug well-343
known to improve insulin resistance in chronic obese patients (38) and capable of 344
inhibiting mitochondrial ATP production (39). Notably, it has been reported that 345
genetic alteration of mitochondrial oxidative phosphorylation improves insulin-346
sensitivity in mice (6) while enhanced mitochondrial capacity in muscle is associated 347
with higher risk of diabetes in humans (7). It is still debated whether mild increases 348
or decreases in respiratory chain function are beneficial against insulin resistance. 349
Our findings argue in favor of reducing respiratory chain function as a promising 350
approach in the treatment of insulin resistance. 351
13 Uncoupling agents are renowned to promote weight loss because of their ability to 352
dissipate energy as heat at the expense of ATP production by mitochondria (9, 40). 353
Therefore, we propose that the transient uncoupling activity of CO elicited by 354
repetitive administration of CORM-401 is a prominent mechanism responsible for the 355
lower weight gain during the HFD regime. Because this uncoupling effect is 356
concomitant to enhanced glycolysis, these two actions of CO appear to be essential 357
in the restoration of metabolic homeostasis in obesity (Figure 6). 358
In summary, this study provides the first evidence that an orally active CO-359
releasing agent is effective in counteracting glucose intolerance and weight gain in 360
HFD obese mice. The ability of CO to interact with mitochondria and improve 361
adipose tissue function seems to be central to this effect. Thus, our findings support 362
the idea that CORM-401 could be investigated as a prototypic compound for the 363
development of promising insulin-sensitizing agents. 364
14
Materials and methods
366 367
Chemicals and Reagents. CORM-401 (Mn(CO)4{S2CNMe(CH2CO2H)}) (see
368
chemical structure in Supplemental Figure 1) was synthesized as previously 369
described (41). Stock solutions (5-10 mM) were prepared by solubilizing CORM-401 370
in Dulbecco Phosphate Buffer Solution (pH= 7.4) and stored at -20 °C until use. As a 371
negative control, CORM-401 was inactivated (iCORM) by incubation with equimolar 372
concentrations of hydrogen peroxide for 24 h in order to remove CO from CORM-373
401. The absence of CO release from iCORM was verified using a hemoglobin 374
assay (see below). For the animal experiments, standard diet (A04) and high fat diet 375
(Purified Diet 230 HF) were purchased from SAFE Diet (Augy, France). Dulbecco’s 376
modified Eagle’s medium (DMEM), penicillin/streptomycin, dexamethasone, new 377
born calf serum and fetal bovine serum (FBS) were purchased from Life 378
Technologies. Pyruvate, isobutylmethylxanthine (IBMX), insulin and all other 379
reagents were obtained from Sigma Aldrich unless otherwise specified. 380
381
Animals and experimental design. Eight-week-old male C57BL6 mice weighing
382
approximately 25 g were obtained from Janvier (France). Mice were housed under 383
controlled conditions of temperature (21±1°C), hygrometry (60±10%) and lighting (12 384
h per day). Animals were acclimatized in the laboratory for one week before the start 385
of the experiments. Mice were fed either a standard diet (SD) or a high fat diet (HFD) 386
for 14 weeks with or without CORM-401 treatment. In preliminary experiments, we 387
tested CORM-401 at 15 mg/kg and 30 mg/kg given orally three times a week to 388
evaluate its dose-dependent effects in our model. Because the effects were more 389
pronounced with 30 mg/kg CORM-401, we continued our study using this dose and 390
randomly divided mice into five groups (n=10 per group): 1) SD mice; 2) HFD mice; 391
3) SD mice administered with CORM-401 starting at week 6 after the beginning of 392
the diet (SD+CORM); 4) HFD mice administered with CORM-401 starting at week six 393
after the beginning of the diet (treatment group, SD+CORM-T); 5) HFD mice 394
administered with CORM-401 starting at the beginning of the diet (prevention group, 395
SD+CORM-P). Mice were weighed weekly and food consumption was measured at 396
week four and eight. The total amount of food was weighed daily in the afternoon 397
and averaged for each mouse to obtain a daily food consumption measurement per 398
15 mouse. Mice were sacrificed at the end of 14 weeks after a 6 h fasting and 48 h after 399
the last CORM treatment. Blood was collected for biochemistry analysis and 400
epididymal white adipose tissue (eWAT), inguinal white adipose tissue (iWAT), 401
brown adipose tissue (BAT) and liver were removed and weighed. In an additional 402
set of experiments, 6 h-fasted mice were given PBS, iCORM (30 mg/kg) or CORM-403
401 (30 mg/kg) by oral gavage. Metabolic assays were performed 1 h after CORM-404
401 administration for one set of experiment and mice were sacrificed 2 h after 405
CORM-401 administration for seahorse experiment and adipose tissue collection. 406
407
Fasting blood glucose, glucose and insulin tolerance tests. After 6 h fasting,
whole-408
body glucose tolerance and insulin sensitivity were assessed in all groups at weeks 409
five/six and 12/13 by intraperitoneal glucose (GTT) and insulin (ITT) tolerance tests, 410
respectively. In addition, GTT and ITT were also evaluated 1 h after oral gavage of 411
CORM-401. First, blood was obtained via tail clip to assess fasting blood glucose 412
(Caresens® N, DinnoSanteTM). Then, mice received a glucose (1.5 g/kg) or insulin 413
(0.3 UI/kg) solution by intraperitoneal injection and blood glucose was measured at 414
15, 30, 60, 90 and 120 min after the injection. The HOmeostasis Model Assessment 415
of Insulin Resistance (HOMA-IR) adjusted to rodents was calculated as ([glucose 416
(mg/dl)/18] x [insulin (ng/ml)/0.0347])/108.24 as reported (42) The area under the 417
curve (AUC) for the glucose excursion was calculated using Graphpad Prism. 418
419
Transthoracic Echocardiography. Transthoracic echocardiography was performed in
420
conscious mice as previously described (43, 44). Briefly, in hand-gripped mice
421
parasternal images were acquired at the level of papillary muscles using a
13-422
MHz linear-array transducer with a Vivid 7 ultrasound system (GE Medical System,
423
Chicago, IL). Left ventricular dimensions were serially obtained in M-mode and
424
derived parameters were calculated using standard formulas. Left ventricular mass
425
was determined using the uncorrected cube assumption (43, 44). Peak systolic
426
values of strain rate in the anterior and posterior wall were obtained using
427
Tissue Doppler Imaging. Strain rate analysis with EchoPac Software (GE Medical
428
System) was performed offline by a blinded observer. Peak systolic strain rate on 8
429
consecutive cardiac cycles were averaged to reduce the effect of respiratory
430
variations (43, 44).
16 432
Preparation of eWAT-conditioned medium (eCM). Epididymal white adipose tissue
433
(eWAT 0.1 g) was collected and kept at room temperature in a 24-well plate with 1 434
ml of DMEM/well. The tissue was minced into ∼1 mm3
pieces and incubated for 1 h 435
at 37°C and 5% CO2 prior to transferring it into a new plate with fresh DMEM
436
medium containing 4.5 g glucose, 2 mM glutamine, 1% free fatty acid bovine serum 437
albumin, 1% antibiotic and antimycotic solution. eWAT-conditioned medium (eCM) 438
was collected 24 h after incubation and stored at -80°C until analysis. 439
440
Plasma and eCM analysis. An enzyme-linked immunosorbent assay (ELISA) kit was
441
used to measure insulin (ALPCO Diagnostics, Salem, NH). Triglycerides (TG), total 442
cholesterol (CHOL), lactate, alanine transaminase (ALAT), aspartate transaminase 443
(ASAT), lactate dehydrogenase, creatinine as well as conjugated and total bilirubin 444
were measured in plasma samples using a Cobas 8000 analyser (Roche, 445
Indianapolis, USA). Cytokines (IL-1β, IL-10 and IL-6) and leptin were measured in 446
plasma and eCM samples using Mesoscale Multiplex and Single-plex plates, 447
respectively (Mesoscale Discovery, Gaithersburg, USA). 448
449
Analysis of mRNA expression. After an initial extraction step by mixing Extract-All
450
(Eurobio, France) and chloroform to samples, total RNA purification was performed 451
with a column extraction Kit (RNeasy Mini®, Qiagen, Germany). Double-strand cDNA 452
was synthesized from total RNA with the High-Capacity cDNA Reverse Transcription 453
Kit (Life Technologies, Carlsbad, CA). Quantitative real-time PCR (qPCR) was 454
performed in a StepOnePlus Real-Time PCR System using commercially available 455
TaqMan primer-probe sets (Life Technologies, Carlsbad, CA). Gene expression was 456
assessed by the comparative CT (ΔΔCT) method with β-actin as the reference gene. 457
458
Western Blot Analysis. Snap-frozen eWAT samples (200 mg) were lysed in cell lysis
459
buffer (Cell Signaling, Danvers, MA France) supplemented with 1% 460
phenylmethylsulfonyl fluoride (PMSF). Protein samples were resolved on 12% bis-461
Tris gels followed by transfer to nitrocellulose membrane. Antibodies for Akt and 462
phospho-Akt (Ser473) were from Cell Signaling (references #4991 and #4060 463
respectively) and antibodies for β-actin were from Santa Cruz (reference sc-47778). 464
17 Bands were visualized by enhanced chemiluminescence and quantified using 465
ImageJ software. 466
467
Histology and immunohistochemistry. Fresh tissues were fixed in 10%
phosphate-468
buffered formalin overnight. Paraffin wax sections of 5 µm were processed for 469
haematoxylin-eosin (H&E) and CD68 immunostaining. Images were analyzed using 470
ImageJ software. 471
472
3T3-L1 cell culture. 3T3-L1 murine pre-adipocytes (reference 088SP-L1-F) were
473
purchased from the ZenBio company (NC, USA) and cultured in an atmosphere of 5 474
% CO2 at 37 °C using DMEM supplemented with 10% newborn calf serum For
475
adipocyte differentiation, cells were stimulated with 3T3-L1 differentiation medium 476
containing IBMX (500 µM), dexamethasone (250 nM) and insulin (175 nM) for 2 days 477
after cells reached confluency. The medium was changed to DMEM containing 10% 478
FBS and insulin (175 nM) after 2 days and adipocytes were then kept into DMEM 479
containing only 10% FBS. Prior to the experiments, adipocytes were subjected to 480
serum deprivation for 16 h with DMEM supplemented with 0.5% FBS. 481
482
Cellular Bioenergetic Analysis. Bioenergetic profiles of 3T3-L1 adipocytes were
483
determined using a Seahorse Bioscience XF24 Analyzer (Billerica, MA, USA) that 484
provides real-time measurements of oxygen consumption rate (OCR), indicative of 485
mitochondrial respiration, and extracellular acidification rate (ECAR), an index of 486
glycolysis. An optimal cell density of 20,000 cells/well was determined from 487
preliminary experiments. Bioenergetic measurements were performed in FBS- and 488
bicarbonate-free DMEM (pH 7.4) supplemented with 4.5 g/L glucose, 1% glutamax 489
and 1% pyruvate to match the normal culture conditions of 3T3-L1 cells. In a first set 490
of experiments, the effect of CORM-401 (25-100 μM) on OCR and ECAR was 491
assessed over time. In a second set of experiments, the effect of CORM-401 on 492
mitochondrial function was evaluated by means of a MitoStress test, which allows 493
the measurements of key parameters such as ATP-linked respiration and proton leak 494
after sequential additions of: 1 μg/ml oligomycin (inhibitor of ATP synthesis), 0.7 μM 495
carbonyl cyanide 4-(trifluoromethoxy) phenylhydrazone (FCCP, uncoupling agent) 496
and 1 μM rotenone/antimycin A (inhibitors of complex I and complex III of the 497
18 respiratory chain, respectively). CORM-401 was added 1 h prior to oligomycin to 498
ensure delivery of CO to cells before assessment of mitochondrial function. In an 499
alternative set of experiments, we investigated the effect of CORM-401 on 500
respiration in the absence of ATP synthesis by adding first oligomycin to cells 501
followed by CORM-401, FCCP and rotenone/antimycin A. In a third set of 502
experiments, the effect of CORM-401 on glycolysis was evaluated by means of a 503
Glycolytic stress test, which allow the measurements of glycolysis and glycolytic 504
reserve capacity after sequential additions of: 10 mM glucose, 1 μg/ml oligomycin 505
and 50 mM of 2-deoxyglucose (inhibitor of glycolysis).The pharmacological action of 506
CORM-401 was compared to that of iCORM-401, which does not release CO. 507
508
ATP Assay. Intracellular ATP levels were measured using an ATPLiteTM
509
Bioluminescence Assay Kit (PerkinElmer, France) according to manufacturer’s 510
instructions. 511
512
Assays for the detection of CO in vivo and in vitro. The levels of carbonmonoxy
513
hemoglobin (COHb) in blood was determined as previously described by our group 514
(45). Briefly, blood (5 µl) collected from the mice tail vein at different time points after 515
oral administration with CORM-401 was added to a cuvette containing 4.5 ml of 516
deoxygenated tris(hydroxymethyl) aminomethane solution and spectra recorded as 517
reported above. The percentage of COHb was calculated based on the absorbance 518
at 420 and 432 nm with the reported extinction coefficients for mouse blood (46). 519
The detection of CO content in adipose tissue following oral gavage with CORM-401 520
was determined by the method of Vreman et al. (47). For this, adipose tissues were 521
initially placed in ice-cold potassium phosphate buffer (1:4 w/v) and stored at -80 522
C_until analysis. The day of the experiment, tissues were diced and sonicated and 523
forty microliters of this suspension was added to CO-free sealed vials containing 5 524
mL of 30% (w/v) sulfosalicylic acid and incubated for 30 min on ice. CO released into 525
the vial headspace was quantified by gas chromatography. CO accumulated in 526
cultured 3T3-L1 adipocytes after treatement with CORM-401 was measured 527
spectrophotometrically using a specific scavenger of CO (hemoCD1) as previously 528
described (48). 529
19
Statistics. Data are expressed as mean values ± standard error of the mean (SEM).
531
Statistical analysis were performed using the unpaired 2-tailed Student’s t test or 532
one-way or two-way analysis of variance (ANOVA) with Fisher multiple comparison 533
test. The result were considered significant if the p-value was <0.05. 534
535
Study approval. All animals received care according to institutional guidelines, and
536
all experiments were approved by the Institutional Ethics committee number 16, 537
Paris, France (licence number 16-090). 538
539 540 541
20
Author Contributions
542
L.B., R.F. and R.M. designed the study, performed experiments, collected and 543
analyzed data and wrote the manuscript. L.B. and M.P. performed metabolic tests. 544
L.M. performed CO measurements in adipose tissue. S.M. performed histological 545
staining. H.K. provided critical materials and advice on the use of hemoCD. L.B., 546
M.P., D.S. and G.C. collected organs for analysis. J.T. performed the 547
echocardiography. G.D. analyzed the echocardiography and read the manuscript. 548
R.M. is the guarantor of this work and, as such, had full access to all the data in this 549
study and takes responsibility for the integrity of the data and the accuracy of the 550 data analysis. 551 552 Acknowledgements 553
This work was supported by a grant from the French National Research Agency 554
(ANR) (ANR‐15‐RHUS‐0003). The authors thank Dr. Jayne-Louise Wilson for her 555
support in performing experiments with the Seahorse Analyzer. The authors also 556
thank Rachid Souktani and Cécile Lecointe for help in the animal facility platform; 557
Xavier Decrouy, Christelle Gandolphe and Wilfried Verbecq-Morlot from the 558
histology platform; and Stéphane Moutereau at Henri Mondor Hospital for blood 559
analysis. 560
561
Conflict of interest: The authors have declared that no conflict of interest exists.
562 563
21
References
564 565
1. Stumvoll M, Goldstein BJ, van Haeften TW. Type 2 diabetes: principles of 566
pathogenesis and therapy. The Lancet 2005;365(9467):1333–1346. 567
2. Guilherme A, Virbasius JV, Puri V, Czech MP. Adipocyte dysfunctions linking 568
obesity to insulin resistance and type 2 diabetes. Nat. Rev. Mol. Cell Biol. 569
2008;9(5):367–377. 570
3. Barazzoni R, Gortan Cappellari G, Ragni M, Nisoli E. Insulin resistance in obesity: 571
an overview of fundamental alterations. Eat. Weight Disord. EWD 2018;23(2):149– 572
157. 573
4. Montgomery MK, Turner N. Mitochondrial dysfunction and insulin resistance: an 574
update. Endocr. Connect. 2015;4(1):R1–R15. 575
5. Fazakerley DJ et al. Mitochondrial oxidative stress causes insulin resistance 576
without disrupting oxidative phosphorylation. J. Biol. Chem. 2018;jbc.RA117.001254. 577
6. Pospisilik JA et al. Targeted deletion of AIF decreases mitochondrial oxidative 578
phosphorylation and protects from obesity and diabetes. Cell 2007;131(3):476–491. 579
7. Nair KS et al. Asian Indians have enhanced skeletal muscle mitochondrial 580
capacity to produce ATP in association with severe insulin resistance. Diabetes 581
2008;57(5):1166–1175. 582
8. Green K, Brand MD, Murphy MP. Prevention of Mitochondrial Oxidative Damage 583
as a Therapeutic Strategy in Diabetes. Diabetes 2004;53(suppl 1):S110–S118. 584
22 9. Harper JA, Dickinson K, Brand MD. Mitochondrial uncoupling as a target for drug 585
development for the treatment of obesity. Obes. Rev. 2001;2(4):255–265. 586
10. Tao H, Zhang Y, Zeng X, Shulman GI, Jin S. Niclosamide ethanolamine–induced 587
mild mitochondrial uncoupling improves diabetic symptoms in mice. Nat. Med. 588
2014;20(11):1263–1269. 589
11. Crunkhorn S. Metabolic disease: Mitochondrial uncoupler reverses diabetes 590
[Internet]. Nat. Rev. Drug Discov. 2014; doi:10.1038/nrd4491 591
12. Wilson JL et al. Carbon monoxide reverses the metabolic adaptation of microglia 592
cells to an inflammatory stimulus. Free Radic. Biol. Med. 2017;104:311–323. 593
13. Lavitrano M et al. Carbon monoxide improves cardiac energetics and safeguards 594
the heart during reperfusion after cardiopulmonary bypass in pigs. FASEB J. Off. 595
Publ. Fed. Am. Soc. Exp. Biol. 2004;18(10):1093–1095.
596
14. Almeida AS, Sonnewald U, Alves PM, Vieira HLA. Carbon monoxide improves 597
neuronal differentiation and yield by increasing the functioning and number of 598
mitochondria. J. Neurochem. 2016;138(3):423–435. 599
15. Motterlini R, Foresti R. Biological signaling by carbon monoxide and carbon 600
monoxide-releasing molecules. Am. J. Physiol. - Cell Physiol. 2017;312(3):C302– 601
C313. 602
16. Motterlini R, Foresti R. Heme Oxygenase-1 As a Target for Drug Discovery. 603
Antioxid. Redox Signal. 2013;20(11):1810–1826.
604
17. Motterlini R, Otterbein LE. The therapeutic potential of carbon monoxide. Nat. 605
Rev. Drug Discov. 2010;9(9):728–743.
23 18. Foresti R, Braud L, Motterlini R. Signaling and Cellular Functions of Carbon 607
Monoxide (CO). In: Metallobiology Series - Gasotransmitters. Cambridge, UK: R. 608
Wang; 2018:161–191 609
19. Clark JE et al. Cardioprotective actions by a water-soluble carbon monoxide-610
releasing molecule. Circ. Res. 2003;93(2):e2-8. 611
20. Fayad-Kobeissi S et al. Vascular and angiogenic activities of CORM-401, an 612
oxidant-sensitive CO-releasing molecule. Biochem. Pharmacol. 2016;102:64–77. 613
21. Hosick PA et al. Chronic carbon monoxide treatment attenuates development of 614
obesity and remodels adipocytes in mice fed a high-fat diet. Int. J. Obes. 615
2014;38(1):132–139. 616
22. Hosick PA, AlAmodi AA, Hankins MW, Stec DE. Chronic treatment with a carbon 617
monoxide releasing molecule reverses dietary induced obesity in mice. Adipocyte 618
2015;5(1):1–10. 619
23. Wegiel B et al. Carbon monoxide expedites metabolic exhaustion to inhibit tumor 620
growth. Cancer Res. 2013;73(23):7009–7021. 621
24. Cai D et al. Local and systemic insulin resistance resulting from hepatic 622
activation of IKK-beta and NF-kappaB. Nat. Med. 2005;11(2):183–190. 623
25. Kim H-J et al. Differential effects of interleukin-6 and -10 on skeletal muscle and 624
liver insulin action in vivo. Diabetes 2004;53(4):1060–1067. 625
26. Jais A et al. Heme Oxygenase-1 Drives Metaflammation and Insulin Resistance 626
in Mouse and Man. Cell 2014;158(1):25–40. 627
24 27. Li M et al. Treatment of obese diabetic mice with a heme oxygenase inducer 628
reduces visceral and subcutaneous adiposity, increases adiponectin levels, and 629
improves insulin sensitivity and glucose tolerance. Diabetes 2008;57(6):1526–1535. 630
28. Ndisang JF, Lane N, Jadhav A. Upregulation of the heme oxygenase system 631
ameliorates postprandial and fasting hyperglycemia in type 2 diabetes. Am. J. 632
Physiol. Endocrinol. Metab. 2009;296(5):E1029-1041.
633
29. Nicolai A et al. Heme Oxygenase-1 Induction Remodels Adipose Tissue and 634
Improves Insulin Sensitivity in Obesity-Induced Diabetic Rats. Hypertension 635
2009;53(3):508–515. 636
30. Burgess A et al. Adipocyte Heme Oxygenase-1 Induction Attenuates Metabolic 637
Syndrome in Both Male and Female Obese Mice. Hypertension 2010;56(6):1124– 638
1130. 639
31. Huang J-Y, Chiang M-T, Yet S-F, Chau L-Y. Myeloid heme oxygenase-1 640
haploinsufficiency reduces high fat diet-induced insulin resistance by affecting 641
adipose macrophage infiltration in mice. PloS One 2012;7(6):e38626. 642
32. Kim HJ et al. Carbon monoxide protects against hepatic ischemia/reperfusion 643
injury via ROS-dependent Akt signaling and inhibition of glycogen synthase kinase 644
3β. Oxid. Med. Cell. Longev. 2013;2013:306421. 645
33. Yang P-M, Huang Y-T, Zhang Y-Q, Hsieh C-W, Wung B-S. Carbon monoxide 646
releasing molecule induces endothelial nitric oxide synthase activation through a 647
calcium and phosphatidylinositol 3-kinase/Akt mechanism. Vascul. Pharmacol. 648
2016;87:209–218. 649
25 34. Wegiel B et al. Nitric oxide-dependent bone marrow progenitor mobilization by 650
carbon monoxide enhances endothelial repair after vascular injury. Circulation 651
2010;121(4):537–548. 652
35. Iacono LL et al. A carbon monoxide-releasing molecule (CORM-3) uncouples 653
mitochondrial respiration and modulates the production of reactive oxygen species. 654
Free Radic. Biol. Med. 2011;50(11):1556–1564.
655
36. Kaczara P et al. Carbon monoxide released by CORM-401 uncouples 656
mitochondrial respiration and inhibits glycolysis in endothelial cells: A role for 657
mitoBKCa channels. Biochim. Biophys. Acta 2015;1847(10):1297–1309. 658
37. Sandouka A et al. Carbon monoxide-releasing molecules (CO-RMs) modulate 659
respiration in isolated mitochondria. Cell. Mol. Biol. Noisy--Gd. Fr. 2005;51(4):425– 660
432. 661
38. González-Barroso MM et al. Fatty acids revert the inhibition of respiration caused 662
by the antidiabetic drug metformin to facilitate their mitochondrial β-oxidation. 663
Biochim. Biophys. Acta BBA - Bioenerg. 2012;1817(10):1768–1775.
664
39. Zhang Y, Ye J. Mitochondrial inhibitor as a new class of insulin sensitizer. Acta 665
Pharm. Sin. B 2012;2(4):341–349.
666
40. Speakman JR et al. Uncoupled and surviving: individual mice with high 667
metabolism have greater mitochondrial uncoupling and live longer. Aging Cell 668
2004;3(3):87–95. 669
41. Crook SH et al. [Mn(CO)4{S2CNMe(CH2CO2H)}], a new water-soluble CO-670
releasing molecule. Dalton Trans. Camb. Engl. 2003 2011;40(16):4230–4235. 671
26 42. Lee S et al. Comparison between surrogate indexes of insulin sensitivity and 672
resistance and hyperinsulinemic euglycemic clamp estimates in mice. Am. J. 673
Physiol. Endocrinol. Metab. 2008;294(2):E261-270.
674
43. Sawaki D et al. Visceral Adipose Tissue Drives Cardiac Aging Through 675
Modulation of Fibroblast Senescence by Osteopontin Production. Circulation 676
[published online ahead of print: March 2, 2018]; 677
doi:10.1161/CIRCULATIONAHA.117.031358 678
44. Ternacle J et al. Short-term high-fat diet compromises myocardial function: a 679
radial strain rate imaging study. Eur. Heart J. Cardiovasc. Imaging
680
2017;18(11):1283–1291. 681
45. Nikam A et al. Diverse Nrf2 Activators Coordinated to Cobalt Carbonyls Induce 682
Heme Oxygenase-1 and Release Carbon Monoxide in Vitro and in Vivo. J. Med. 683
Chem. 2016;59(2):756–762.
684
46. Rodkey FL, Hill TA, Pitts LL, Robertson RF. Spectrophotometric measurement of 685
carboxyhemoglobin and methemoglobin in blood. Clin. Chem. 1979;25(8):1388– 686
1393. 687
47. Vreman HJ, Wong RJ, Kadotani T, Stevenson DK. Determination of carbon 688
monoxide (CO) in rodent tissue: effect of heme administration and environmental CO 689
exposure. Anal. Biochem. 2005;341(2):280–289. 690
48. Minegishi S et al. Detection and Removal of Endogenous Carbon Monoxide by 691
Selective and Cell-Permeable Hemoprotein Model Complexes. J. Am. Chem. Soc. 692
2017;139(16):5984–5991. 693
27 694
28
Figure
696
697
Figure 1. CORM-401 reduces body weight gain and improves insulin resistance
698
in HFD-induced obesity. Mice received a standard diet (SD) or high fat diet (HFD)
699
for 14 weeks. CORM-401 (30 mg/kg) was given by oral gavage starting either at the 700
beginning (HFD+CORM-T) or after 6 weeks (HFD+CORM-P) HFD. Carbonmonoxy 701
hemoglobin (COHb) was measured after oral gavage with CORM-401 (A). Body 702
weight (BW) was measured every week (B) and BW gain was calculated as 703
percentage of the basal weight (C). A glucose tolerance test (GTT) was performed at 704
week 13 (D) and data represented as the area under the curve (GTT AUC) (E). An 705
insulin tolerance test (ITT) was performed at week 14 (F) and data represented as 706
the area under the curve (ITT AUC) (G). Fasting total cholesterol (H), fasting 707
triglycerides (I), fasting glucose (J), fasting insulin (K), calculated HOMA-IR (L) and 708
fasting leptin (M) were measured after 14 weeks in all groups examined. Values 709
29 represent the mean ± SEM. A=4-6 mice per group; B-M=8-10 mice per group. 710
*p<0.05 vs. control group (SD) and #p<0.05 vs. HFD group, values not designated 711
with symbols are not statistically different, student’s t test or one-way or two-way 712
ANOVA with Fisher multiple comparison test. 713
30 715
Figure 2. CORM-401 improves visceral adipose tissue function in HFD-induced
716
obesity. Mice on standard (SD) or high fat diet (HFD) were sacrificed after 14
717
weeks. CORM-401 (30 mg/kg) was given by oral gavage starting either at the 718
beginning (HFD+CORM-T) or after 6 weeks (HFD+CORM-P) HFD. Pictures and 719
representative sections of epididimal white adipose tissue (eWAT) stained with 720
hematoxylin-eosin (A). eWAT was also evaluated for weight (B), adipocytes size (C), 721
free fatty acids (FFA) levels from conditioned media (D), mRNA expression of genes 722
involved in metabolism (E), CD68 expression (F, G), mRNA expression of CCl2 (H) 723
and Hmox-1 (I) as well as interleukins content from conditioned media (J). mRNA 724
31 expression was determined by real-time PCR and normalized to β-actin. Values 725
represent the mean ± SEM, n=6-8 mice/group. *p<0.05 vs. control group (SD) and 726
#p<0.05 vs. HFD group, values not designated with symbols are not statistically 727
different, one-way ANOVA with Fisher multiple comparison test. 728
32 730
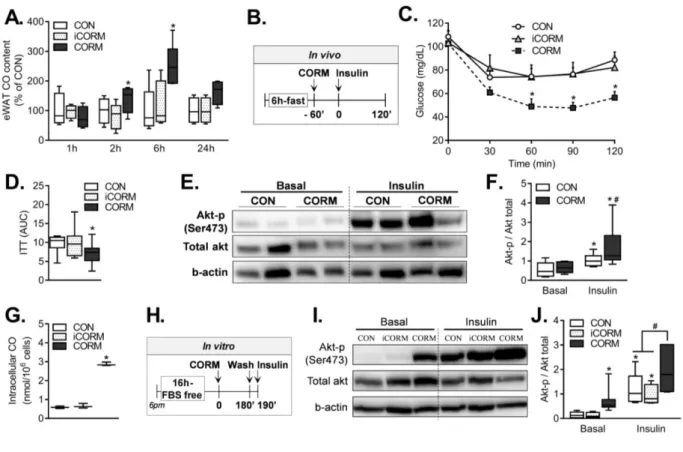
Figure 3. CO delivered by CORM-401 increases systemic and adipocytes
731
insulin sensitivity both in vivo and in vitro. CO content was measured in
732
epididimal white adipose tissue (eWAT) after oral gavage with PBS (CON), inactive 733
CORM that does not release CO (iCORM, 30 mg/kg) or CORM-401 (30 mg/kg) (A). 734
An ITT was performed in fasted mice 1 h after oral gavage with PBS (CON), iCORM 735
(30 mg/kg) or CORM-401 (30 mg/kg) (B), while blood glucose levels were measured 736
at the times indicated (C) and represented by area under the curve (ITT AUC) (D). 737
eWAT was evaluated for protein expression of total Akt and phosphorylated Akt 738
assessed by western blot (E, F). Intracellular CO level in 3T3-L1 adipocytes after 739
CORM-401 exposure at 50 µM for 3 h (G). Proteins were extracted from quiescent 740
3T3-L1 adipocytes after 3 h exposure to PBS (CON), iCORM (50 µM) or CORM-401 741
(50 µM) (see protocol in H). Expression of total Akt and phosphorylated Akt was 742
assessed by western blot (F, G). Results are expressed as mean ± SEM. A=4-6 743
mice per group; C-D=10 mice per group; E-F=8 mice per group; G=3 in triplicates, 744
J=4 independent experiments. *p<0.05 vs. control group (CON) and #p<0.05 vs. 745
insulin, values not designated with symbols are not statistically different, one-way 746
ANOVA with Fisher multiple comparison test. 747
33 749
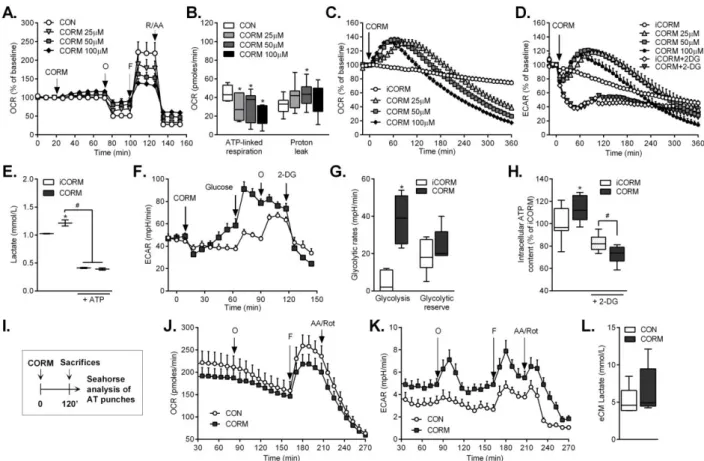
Figure 4. CO induces a metabolic switch in adipocytes in vitro and in vivo.
750
Oxygen consumption rate (OCR) and extracellular acidification rate (ECAR) were 751
measured in 3T3-L1 cells after addition of PBS (CON) or CORM-401 (25, 50, 100 752
μM). A MitoStress assay was performed on 3T3-L1 adipocytes after first addition of 753
PBS or CORM-401 followed by sequential addition of oligomycin, FCCP and 754
rotenone/antimycin A (A). ATP-linked respiration rate was calculated by subtracting 755
OCR values after oligomycin addition from basal OCR values and proton leak was 756
calculated by subtracting OCR values after R/AA addition from OCR values after 757
oligomycin addition (B). OCR (C) and ECAR (D) were measured for 6 h after addition 758
of CORM-401. Lactate (E) and intracellular ATP (H) were measured 3 h after 759
exposure to iCORM or CORM-401 with or without 2-deoxyglucose (2-DG). A 760
glycolytic assay was performed after addition of iCORM or CORM-401 (50 μM) 761
followed by sequential addition of glucose, oligomycin and 2-DG (F). Glycolysis rate 762
was calculated by subtracting ECAR values after glucose addition from basal ECAR 763
values and glycolytic reserve was calculated by subtracting ECAR values after 764
oligomycin addition from basal ECAR values (G). Experiments using the Seahorse 765
Analyzer were performed on punches of eWAT collected from mice 2 h after oral 766
34 gavage with iCORM or CORM-401 (30 mg/kg) (see protocol in I) and OCR (J) and 767
ECAR (K) were measured. Lactate was measured in eWAT conditioned media (L). 768
Results are expressed as mean ± SEM. A-D & F-H=4 independent experiments; C=3 769
independent experiments; J-L=6 mice per group. *p<0.05 vs. control group (CON) 770
and #p<0.05 vs. 2-DG, values not designated with symbols are not statistically 771
different, student’s t test or one-way ANOVA with Fisher multiple comparison test. 772
35 774
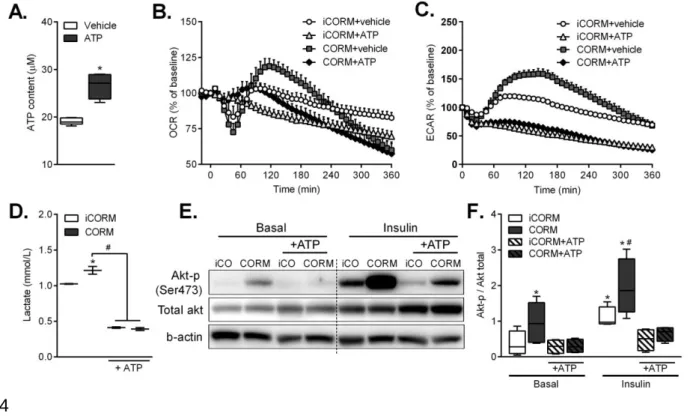
Figure 5. ATP counteracts CO induced-metabolic switch in adipocytes and
775
reverses CO-induced increase in insulin sensitivity. Intracellular ATP (A) was
776
measured after exposure of vehicle (H2O) or ATP encapsulated in liposome. OCR
777
(B) and ECAR (C) were measured for 6 h after addition of iCORM (50 µM) or CORM-778
401 (50 µM) with or without vehicle (H2O) or ATP encapsulated in liposome. Lactate
779
content (D) after exposure of iCORM or CORM-401 with or without ATP. Expression 780
of total Akt and phosphorylated Akt assessed by western blot (E, F). Results are 781
expressed as mean ± SEM. n=3-4 independent experiments. *p<0.05 vs. control 782
group (CON) and #p<0.05 vs. insulin, values not designated with symbols are not 783
statistically different, student’s t test or one-way ANOVA with Fisher multiple 784
comparison test. 785
36 Insulin
CO
CORM-401
↓ Mitochondrial
ATP
Akt P ActiveUncoupling
↑ Glycolysis
↑ ATP
intracellular
↑ Insulin
sensitivity
↓ Blood
glucose
↑
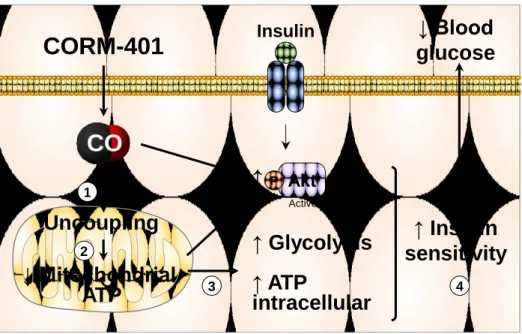
1 2 3 4 787 788Figure 6. Proposed mechanism for the beneficial effects of CO on glucose
789
metabolism in adipose tissue leading to improvement in glucose homeostasis
790
in obese mice. Obesity is characterized by adipose tissue dysfunction leading to
791
insulin resistance and fasting hyperglycemia. CO delivered by CORM-401 in adipose 792
tissue causes an uncoupling of mitochondrial respiration (1) resulting in a transient 793
decrease in mitochondrial ATP production (2). As counteracting mechanism to this 794
effect, glycolysis is stimulated in cells leading to maintenance to global intracellular 795
ATP content (3). This metabolic switch in adipocytes improves local and systemic 796
insulin sensitivity (4). A transient increase in adipose tissue insulin sensitivity 797
resolves adipose tissue dysfunction as well as insulin resistance caused by obesity. 798
799 800
37
Tables
801 802
Table 1. Food intake
803
Food intake (g/mouse/day)1-2 SD HFD HFD+CORM-T HFD+CORM-P
4th week 3.8 ± 0.2a 2.8 ± 0.2b 2.8 ± 0.2b 2.6 ± 0.3b
8th week 3.6 ± 0.1a 3.1 ± 0.1b 3.0 ± 0.2b 2.7 ± 0.1b
1
Results are means ± SEM; 2Means with different superscript letters are significantly 804
different among the same period (before treatment or during treatment), p < 0.05, 805
one-way ANOVA with Fisher multiple comparison test. 806
807 808 809 810
38
Table 2. Blood analysis
811
SD HFD HFD+CORM-T HFD+CORM-P
ASAT/ALAT 3.0 ± 0.5a 2.5 ± 0.9a 3.6 ± 0.9a 2.9 ± 0.7a Conjugated bilirubin (µmol/L) 0.62 ± 0.2a 0.47 ± 0.07a 0.46 ± 0.06a 0.36 ± 0.03a Total bilirubin (µmol/L) 6.46 ± 2.1a 4.8 ± 2.1a 7.4 ± 2.2 a 4.82 ± 1.9a Creatinine (mmol/L) 8 ± 0.8a 10.13 ± 1.8a 8.37 ± 1.0a 7.43 ± 1.5a Lactate deshydrogenase (U/L) 191.2 ± 56.3a 248.1 ± 46.5a 321.3 ± 93.8a 238 ± 66.3a
ALAT: Aspartate amino transferase, ASAT: Alanine amino transferase. 1Results are 812
means ± SEM; 2Means with different superscript letters are significantly different, p < 813
0.05, one-way ANOVA with Fisher multiple comparison test. 814