HAL Id: hal-00296864
https://hal.archives-ouvertes.fr/hal-00296864
Submitted on 16 Feb 2006
HAL is a multi-disciplinary open access
archive for the deposit and dissemination of
sci-entific research documents, whether they are
pub-lished or not. The documents may come from
teaching and research institutions in France or
abroad, or from public or private research centers.
L’archive ouverte pluridisciplinaire HAL, est
destinée au dépôt et à la diffusion de documents
scientifiques de niveau recherche, publiés ou non,
émanant des établissements d’enseignement et de
recherche français ou étrangers, des laboratoires
publics ou privés.
Evaluation of atmospheric instability indices in Greece
A. Marinaki, M. Spiliotopoulos, H. Michalopoulou
To cite this version:
A. Marinaki, M. Spiliotopoulos, H. Michalopoulou. Evaluation of atmospheric instability indices in
Greece. Advances in Geosciences, European Geosciences Union, 2006, 7, pp.131-135. �hal-00296864�
European Geosciences Union
© 2006 Author(s). This work is licensed under a Creative Commons License.
Geosciences
Evaluation of atmospheric instability indices in Greece
A. Marinaki1, M. Spiliotopoulos1,2, and H. Michalopoulou1
1Department of Applied Physics, Laboratory of Meteorology, University of Athens, Greece
2Department of Management of Environment and Natural Resources, University of Thessaly, Volos, Greece
Received: 10 November 2005 – Revised: 21 December 2005 – Accepted: 16 January 2006 – Published: 16 February 2006
Abstract. The potential of instability indices in assessing
atmospheric instability is examined for the areas of Attica, Thessaly and Central Aegean and Crete, Greece. Gener-ally, many indices have been developed to estimate the tro-posphere’s stability for forecasting purposes. At this study several instability indices, commonly used in Meteorology, are computed based on radiosonde data. Firstly, the indices are computed for several months based on the 00:00 and 12:00 UTC radiosonde data during the period 1981–2003. Statistical methods were used to compare and test the ef-fectiveness of these indices in the described area using me-teorological data from seventeen meme-teorological stations of Greece. Thus, the potential of monitoring the atmospheric instability conditions is examined. The next stage of this study is an effort to test the thresholds of the existing indices in order to improve the results of these indices. It seems that this effort can make a good simulation to the assessment of instability, contributing to local level weather forecasting.
1 Introduction
Thunderstorms and showers are very important phenomena affecting every aspect of human life. It is already known that in order to estimate the possibility of the development of thunderstorms, atmospheric instability is a major deter-minant especially in warm period weather. Generally, an unstable atmosphere tends to fire up showers or thunder-storms while a stable atmosphere usually brings sunny skies. The analysis of the atmosphere during the thunderstorms leads the scientific community to develop parameters that would indicate whether or not the conditions are favourable for thunderstorm development. Even if the development of medium scale numerical models enables forecasting of thun-derstorms it is still worth to estimate instability with such a traditional way like the instability indices.
Correspondence to: M. Spiliotopoulos
The estimation of atmospheric instability with the use of instability indices generally requires computation based on several thermodynamic parameters (Showalter, 1953; George, 1960; Boyden, 1963; Jefferson, 1963a, b; Miller, 1967; Litynska et al., 1976; Peppler, 1988; Peppler and Lamb, 1989; Jacovides and Yonetani, 1990; Reuter and Ak-tary, 1993). Instability indices have been developed and used to aid both research and operational forecasting of severe weather and thunderstorms by quantifying the thermody-namic instability with the aid of radiosonde data. A thorough comparison of instability indices for the Greek peninsula has been carried out in the near past (Dalezios and Papamanolis, 1991; Michalopoulou and Karadana, 1996; Sioutas and Flo-cas, 2003; Chrysoulakis et al., 2005). All these studies suf-fer from data deficiency and reliability that comes from the sparse existing radiosonde network. In general, it should be noticed that all the instability indices describe the potential of convection but the referred threshold values are not definite, but may vary with geographical location, season and synoptic situation (Michalopoulou and Jacovides, 1987; Prezerakos, 1989; Dalezios and Papamanolis, 1991; Haklander and Van Delden, 2003). The objective of this study is to investigate which index and where is the most appropriate for instability monitoring as well as to improve the prevailing thresholds according to each area’s profile.
2 Data and methodology
Upper air data from the three Greek upper air stations: Elliniko (Athens), Mikra (Thessaloniki) and Heraklion (Crete) are utilized at this study. Several months are exam-ined based on the 00:00 and 12:00 UTC radiosonde data dur-ing the period 1981–2003. Attention is given especially to spring and summer months where convective thunderstorms are more usual to occur. Radiosonde data such as Temper-ature T and Dew Point TemperTemper-ature Td for basic isobaric
levels of 850, 700 and 500 hPa are recorded and analyzed. Additionally geodynamic height Z for the (1000–700)hPa
132 A. Marinaki et al.: Evaluation of atmospheric instability indices in Greece
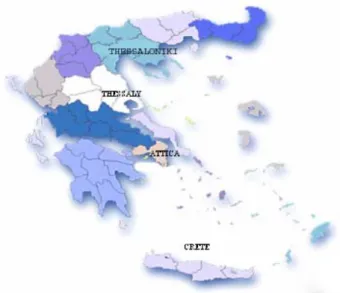
Fig. 1. Map of the study area, showing the related regions of Greece.
thickness, Potential Temperature θ for each isobaric level and wet bulb Potential Temperature θw are computed. Finally,
lapse rate 0, saturated lapse rate 0s and Relative Humidity
RH are considered for each case.
Each day is recorded as thunderstorm day if a thunder-storm event is observed at least for one station of each area. Rainfall data are observed from 17 Greek meteorological sta-tions located at three regions (Fig. 1):
– Attica (Elliniko, N. Philadelphia, National Observatory
of Athens, Dekeleia and Eleysina).
– Thessaly and Central Aegean (Aghialos, Trikala,
Lar-isa, Skiathos and Skyros)
– Crete (Chania, Heraklio, Tympaki, Rethimno, Kasteli,
Ierapetra and Siteia).
Usually, instability indices are employed to alert the me-teorologist on thunderstorm possibility. Generally, a certain threshold value is defined above (or below) which the pos-sibility of thunderstorms is considered (Haklander and Van Delden, 2003). Another aim of this study has been to derive threshold values that perform best in a dichotomous forecast-ing scheme that is to divide its range of values into two parts in which a thunderstorm event is either forecast or not fore-cast. Thus, the thunderstorm probability increases monoton-ically with either decreasing or increasing index values, ac-cording to a benchmark value to distinguish between “thun-derstorm” or “no-thun“thun-derstorm” forecasts. This benchmark value is called an upper threshold value or a lower thresh-old value according to if a thundery case is forecasting when the index value lies at or below that benchmark value (a non-thundery case is forecast otherwise). When using the various thunderstorm indices and parameters in such a two-class cat-egorical forecasting scheme, it makes sense to associate them with their optimal threshold values. The threshold value with
Table 1. Consistency table.
Forecast/Observed Yes No Total
Yes a b a+b
No c d c+d
Total a+c b+d a+b+c+d
the best performance is chosen to be associated with that par-ticular predictor (Haklander and Van Delden, 2003).
Every meteorological station of the study region gives the observed information of yes or no event. The objective of this study is to investigate which index and where is the most appropriate for instability monitoring as well as to improve the prevailing thresholds according to each area’s profile. For this reason the consistency table (Table 1) is constructed.
For the examination of atmospheric instability seven insta-bility indices are examined. The indices used are described as follows:
– Showalter Index (Showalter,1953):
SI = T500 hPa−T850 hPa−500 hPa (1)
– K Index (George, 1960):
KI = (T850−T500) + Td850−(T700−Td700) (2)
– Boyden Index (Boyden, 1963):
BI = Z − T700−200 (3) where, Z is the difference between the geopotential height between 700 hPa and 1000 hPa
– Jefferson Index (Jefferson, 1963a;b):
J I =1.60θw850−T500− 1
2(T − Td)700−8 (4)
– Total Totals Index (Miller, 1967) :
T T = (T850−T500) + (Td850−Td500) (5)
– Humidity Index (Litynska et al, 1976) :
H I = (T − Td)850+(T − Td)700+(T − Td)500 (6)
– Yonetani Index (Jacovides and Yonetani, 1990):
Y I =0.9660(900−800)hPa+2.41(0(850−800)hPa−0S850 hPa)
+9.66(RH 100) −15.5, if RH > 57 : (7a) Y I =0.9660i+2.41(0a−0s) +9.66 RH 100 −17, if RH < 57 (7b)
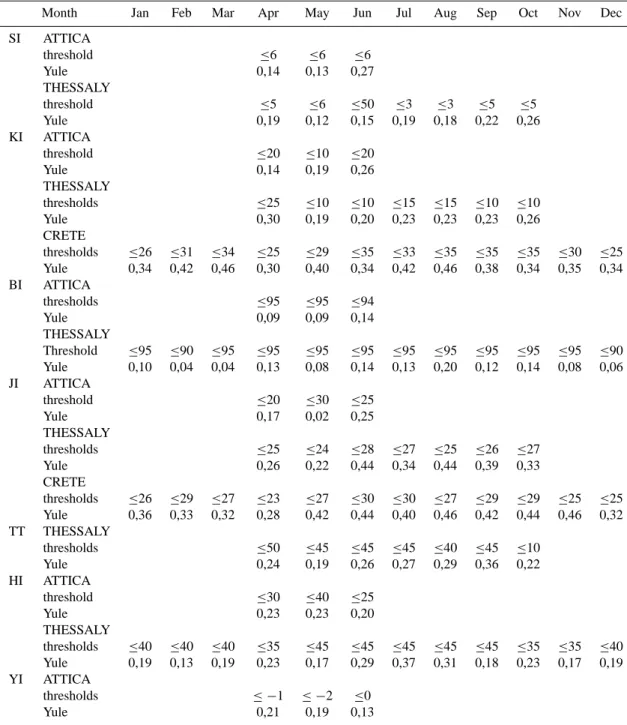
Table 2. General Results.
Month Jan Feb Mar Apr May Jun Jul Aug Sep Oct Nov Dec
SI ATTICA threshold ≤6 ≤6 ≤6 Yule 0,14 0,13 0,27 THESSALY threshold ≤5 ≤6 ≤50 ≤3 ≤3 ≤5 ≤5 Yule 0,19 0,12 0,15 0,19 0,18 0,22 0,26 KI ATTICA threshold ≤20 ≤10 ≤20 Yule 0,14 0,19 0,26 THESSALY thresholds ≤25 ≤10 ≤10 ≤15 ≤15 ≤10 ≤10 Yule 0,30 0,19 0,20 0,23 0,23 0,23 0,26 CRETE thresholds ≤26 ≤31 ≤34 ≤25 ≤29 ≤35 ≤33 ≤35 ≤35 ≤35 ≤30 ≤25 Yule 0,34 0,42 0,46 0,30 0,40 0,34 0,42 0,46 0,38 0,34 0,35 0,34 BI ATTICA thresholds ≤95 ≤95 ≤94 Yule 0,09 0,09 0,14 THESSALY Threshold ≤95 ≤90 ≤95 ≤95 ≤95 ≤95 ≤95 ≤95 ≤95 ≤95 ≤95 ≤90 Yule 0,10 0,04 0,04 0,13 0,08 0,14 0,13 0,20 0,12 0,14 0,08 0,06 JI ATTICA threshold ≤20 ≤30 ≤25 Yule 0,17 0,02 0,25 THESSALY thresholds ≤25 ≤24 ≤28 ≤27 ≤25 ≤26 ≤27 Yule 0,26 0,22 0,44 0,34 0,44 0,39 0,33 CRETE thresholds ≤26 ≤29 ≤27 ≤23 ≤27 ≤30 ≤30 ≤27 ≤29 ≤29 ≤25 ≤25 Yule 0,36 0,33 0,32 0,28 0,42 0,44 0,40 0,46 0,42 0,44 0,46 0,32 TT THESSALY thresholds ≤50 ≤45 ≤45 ≤45 ≤40 ≤45 ≤10 Yule 0,24 0,19 0,26 0,27 0,29 0,36 0,22 HI ATTICA threshold ≤30 ≤40 ≤25 Yule 0,23 0,23 0,20 THESSALY thresholds ≤40 ≤40 ≤40 ≤35 ≤45 ≤45 ≤45 ≤45 ≤45 ≤35 ≤35 ≤40 Yule 0,19 0,13 0,19 0,23 0,17 0,29 0,37 0,31 0,18 0,23 0,17 0,19 YI ATTICA thresholds ≤ −1 ≤ −2 ≤0 Yule 0,21 0,19 0,13
Finally, according to Table 1 Yule Index is applied given by Eq. (8):
Y = (ad − bc)
[(a + b) (b + d) (a + c) (c + d)]1/2 (8)
The first attempt in this study was to compute the seven described instability indices for the Attica region, taking into account only Elliniko station, but finally it was decided to work not only with Attica region incorporating Thessaly and Crete. Unfortunately, in order to work with these regions, Mikra and Heraklion upper-air stations were necessary for
data acquirement, but, for the study period there were too many data loses for 12:00 UTC. Thus, it was decided to pro-ceed with the 00:00 UTC. It is well known that 12:00 UTC represents convective phenomena better than 00:00 UTC, but, the authors believe that 00:00 UTC may have a better forecasting value because it comes many hours before the formation of convection.
134 A. Marinaki et al.: Evaluation of atmospheric instability indices in Greece
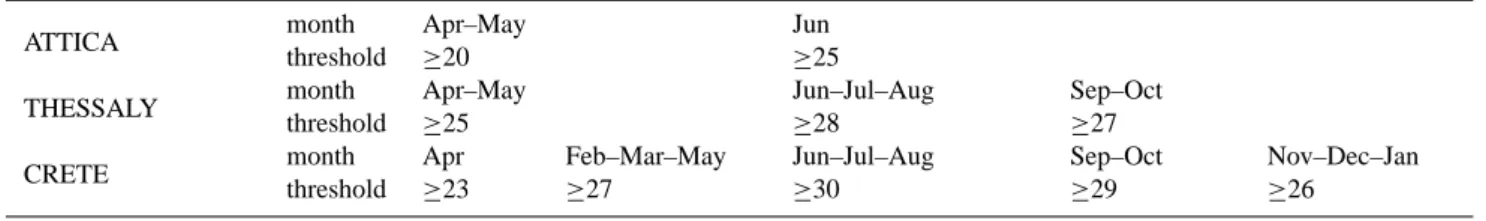
Table 3. Jefferson Index: Best thresholds.
ATTICA month Apr–May Jun
threshold ≥20 ≥25
THESSALY month Apr–May Jun–Jul–Aug Sep–Oct
threshold ≥25 ≥28 ≥27
CRETE month Apr Feb–Mar–May Jun–Jul–Aug Sep–Oct Nov–Dec–Jan
threshold ≥23 ≥27 ≥30 ≥29 ≥26
3 Results
Yule index is applied for every index and every region for this study.The result of such an application gives Table 2. Table 2 shows the values of Yule index for every one of the seven applied instability indices and for each of the three regions under consideration. Empty values indicate that there is no available radiosonde data.
According to Yule criterion Jefferson Index seems to be the most appropriate index for this study. Furthermore in order to find the appropriate periods with the best thresholds a new examination of the Yule Index gives Table 3 which describes the combinations of best thresholds as well as the corresponding periods for Jefferson instability index.
The general idea behind the analysis of the related periods is to find one threshold which fits better to the Yule criterion for consecutive months. It is found from the analysis that there is not too much alteration to the Yule value when the thresholds are shuffled for 1 or 2 points. This concept leads to a less complicated solution for the estimation of instability in space and time. According to this acceptance, Jefferson In-dex with threshold 25 has the best performance for Thessaly region for the summer months. According to Tables 2 and 3, for Crete Island Yule criterion gives that the best values are computed with threshold 30 for the summer months.
For the greater Attica region Humidity Index is found to be enough satisfactory, with the best thresholds at April-May (≤40) and June (≤25). For Crete Island K Index is found to be also enough satisfactory with the best thresholds at April (≥25), December – January (≥26) and February–March– June–July–August–September–October (≥35).
4 Conclusions
In this study, seven instability indices were computed. Each one of the seven indices was tested as independent, but, the truth is that these seven instability types are certainly not independent. It seems that because of the manifold of the Greek Peninsula, air masses have many and different geo-graphical sources. This fact together with the great elevation differences lead to a very complex response of the instability indices. Jefferson index seems to be the best for this study but, generally, an ideal index should, presumably, delineate space-time domains inside which the forecast events occur and outside of which the forecast events do not occur.
Gen-erally, it can be said that an index is a necessary ingredient but is not by itself sufficient. The fact is that an index can focus attention on places and times where the forecast events are likely to occur. In near future many techniques will have to improve the effectiveness of these indices as well as their spatial applicability. According to this it would be a very good idea to correlate SKIRON’s modelling system output with such instability indices in a future work.
Acknowledgements. The authors thank Greek National
Meteoro-logical Service for the provided atmospheric soundings data for the three upper-air stations and the meteorological data from the seventeen surface stations used at this study.
Edited by: V. Kotroni and K. Lagouvardos Reviewed by: anonymous referee
References
Boyden, C. J.: A simple instability index for use as a synoptic pa-rameter, Meteorological Magazine, 92, 198–210, 1963. Chrysoulakis, N., Spiliotopoulos, M., Domenikiotis, C., and
Dalezios, N. R.: Investigation of the atmospheric instability us-ing remotely sensed data, in: Proceedus-ings of the International Symposium on GIS and Remote Sensing: Environmental Ap-plications, edited by: Dalezios, N. R. and Dobesch, H., Volos, Greece, 7–9 November 2003, 155–166, 2005.
Dalezios, N. R. and Papamanolis, N. K.: Objective assessment of instability indices for operational hail forecasting in Greece, Me-teorol. Atmos. Phys., 45, 87–100, 1991.
George, J. J.: Weather forecasting for Aeronautics, Academic Press, New York, 409–415, 1960.
Haklander, A. J. and Van Delden, A.: Thunderstorm predictors and their forecast skill for the Netherlands, Atmos. Res., 67–68, 273– 299, 2003.
Jacovides, C. P. and Yonetani, T.: An evaluation of stability indices for thunderstorm prediction in Greater Cyprus, Weather Forecast, 5, 559–569, 1990.
Jefferson, G. J.: A modified instability index, Meteorological Mag-azine, 92, 92–96, 1963a.
Jefferson, G. J.: A further development of the instability index, Me-teorological Magazine, 92, 313–316, 1963b.
Litynska, Z., Parfiniewicz, J., and Pinkowski, H.: The prediction of air mass thunderstorms and hails, W.M.O., No. 450, 128–130, 1976.
Michalopoulou, H. and Jacovides, C.: Instability Indices for the Cyprus Area, Meteorol. Atmos. Phys., 37, 153–158, 1987.
Michalopoulou, H. and Karadana, E.: A review of instability in-dices for the greater area of Athens, 3rd Hellenic Conference on Meteorology and Atmospheric Physics, 193–198, 1996. Miller, R. C.: Note on analysis and severe storm forecasting
procedures of the Military Weather Warning Center, AWS Tech. Rep. 200, USAF, Scott AFB, IL, 94 pp., 1967.
Peppler, R. A.: A review of static stability indices and re-lated thermodynamic parameters, Illinois State Water Survey Misc. Publ. 104, (Illinois State Water Survey, 2204 Griffith Drive, Champaign, IL 61820), 87 pp.,1988.
Peppler, R. A. and Lamb, P. J.: Tropospheric static stability and cen-tral North American growing season rainfall, Mon. Wea. Rev., 117, 1156–1180, 1989.
Prezerakos, N. G.: An investigation into the conditions in which air-mass thunderstorms occur at Athens, Meteorological Magazine, 118 (1399), 31–36, 1989.
Reuter, G. W. and Aktary, N.: A slantwise Showalter index based on moist symmetric instability: Results for Central Alberta, Atmosphere-Ocean, 31, 379–394, 1993.
Showalter, A. K.: A stability index for thunderstorm forecasting, Bull. Amer. Meteorol. Soc., 34, 250–252, 1953.
Sioutas, M. V. and Flocas, H. A.: Hailstorms in Northern Greece: synoptic patterns and thermodynamic environment, Theor. Appl. Climatol., 75, 189–202, 2003.