HAL Id: hal-02178313
https://hal.archives-ouvertes.fr/hal-02178313
Submitted on 24 Jan 2021HAL is a multi-disciplinary open access
archive for the deposit and dissemination of sci-entific research documents, whether they are pub-lished or not. The documents may come from teaching and research institutions in France or abroad, or from public or private research centers.
L’archive ouverte pluridisciplinaire HAL, est destinée au dépôt et à la diffusion de documents scientifiques de niveau recherche, publiés ou non, émanant des établissements d’enseignement et de recherche français ou étrangers, des laboratoires publics ou privés.
Are granules good tracers of solar surface velocity fields?
M. Rieutord, T. Roudier, H.-G. Ludwig, Å. Nordlund, R. Stein
To cite this version:
M. Rieutord, T. Roudier, H.-G. Ludwig, Å. Nordlund, R. Stein. Are granules good tracers of solar surface velocity fields?. Astronomy and Astrophysics - A&A, EDP Sciences, 2001, 377 (2), pp.L14-L17. �10.1051/0004-6361:20011160�. �hal-02178313�
4 Lund Observatory, Box 43, 22100 Lund, Sweden 5
C.R.A.L, ´Ecole Normale Sup´erieure, 46 all´ee d’Italie, 69364 Lyon, France
6 Theoretical Astrophysics Center and Astronomical Observatory/NBIfAFG, Juliane Maries Vej 30,
2100 Copenhagen, Denmark
7 Michigan State University, East Lansing, MI 48824, USA
Received 3 July 2001 / Accepted 17 August 2001
Abstract. Using a numerical simulation of compressible convection with radiative transfer mimicking the solar
photosphere, we compare the velocity field derived from granule motions to the actual velocity field of the plasma. We thus test the idea that granules may be used to trace large-scale velocity fields at the sun’s surface. Our results show that this is indeed the case provided the scale separation is sufficient. We thus estimate that neither velocity fields at scales less than 2500 km nor time evolution at scales shorter than 0.5 hr can be faithfully described by granules. At larger scales the granular motions correlate linearly with the underlying fluid motions with a slope of.2 reaching correlation coefficients up to∼0.9.
Key words. convection – Sun: granulation – Sun: photosphere
1. Introduction
Since the work of November & Simon (1988) granules have been used to trace horizontal flows at the surface of the Sun, namely mesoscale flows and supergranula-tion (November 1989; Strous 1995a,b; Roudier et al. 1999; Rieutord et al. 2000). However, assuming that granules behave like passive scalars is a rather strong assump-tion regarding the nature of the granules: these are dy-namical structures which are far from being passive. Unfortunately, the validity of this assumption has never been assessed and one relies on the hope that advection of granules (as intensity structures) is statistically domi-nant compared to noise processes like the diffusion of tem-perature fluctuations and small-scale motions induced by granules.
To make further progress on this issue, we used a simulation of convection at the sun’s surface to test the tracking properties of granules. The simulation provides an observable – a time series of two dimensional images of the emergent intensity – together with the underlying three dimensional velocity and temperature fields. This al-lows to test and compare horizontal velocities as measured
Send offprint requests to: M. Rieutord,
e-mail: [email protected]
by different granule tracking techniques against the ac-tual flow velocities. The tracking techniques are presently two, namely LCT, for Local Correlation Tracking, and CST for Coherent Structures Tracking. LCT has been de-veloped by November and collaborators (see November & Simon 1988) and determines the flows from an opti-mization of the correlation between two subimages be-longing to successive images. CST was first proposed by Strous (1995a,b) and recently developed by Roudier et al. (1999) and Rieutord et al. (2001); it decomposes each image of the solar surface into a set of granules whose tra-jectories are used to derive the velocity fields. Both meth-ods have shortcomings whose effects can be quantified by the above comparison.
The simulation used in this letter has been performed using a compressible convection code coupling fluid mo-tion and radiative transfer originally developed by two of the authors (for a description see Stein & Nordlund 1998). For this particular run, which aims at simulating super-granulation, certain trade-offs have been made between physical realism and computational demands: the radia-tive transfer was treated in grey approximation (with frequency independent opacity, with a dependence on tem-perature and pressure similar to that of the solar contin-uum opacity) and the horizontal resolution was chosen to
Article published by EDP Sciences and available at http://www.aanda.org or http://dx.doi.org/10.1051/0004-6361:20011160
M. Rieutord et al.: Are granules good tracers of solar surface velocity fields? L15
Fig. 1. Correlations between the velocity field obtained from granule tracking and the actual velocity field as a function of depth
and time-window; both methods (LCT and CST) give very similar results. A layer 78 km thick has been used.
Fig. 2. Optimal depth for different thicknesses (line type) of
the contributing layer as a function of the time-window. We see that the depth at which correlation is maximum, remains around 250± 30 km.
be a rather coarse 95 km. The restrictions made it afford-able to study a large volume (30× 30 Mm2wide and 3 Mm deep represented by 315× 315 × 82 grid points) which contained several hundred granules at any given instant in time.
In Sect. 2 of this letter we shall present a global view of the velocity field, following Euler’s viewpoint while in Sect. 3 we try to characterize the gran-ules in their ability at tracing the flow field, thus adopting
Lagrange’s viewpoint. Our conclusion is that granules are able to trace statistically the large-scale flows but lead to a systematic underestimation of the actual velocities. 2. Euler’s view
As granules are extended test particles, the measured ve-locity fields are much less resolved than the one issued from the simulation. Typically, our granule tracking tech-nique yields a velocity field on a 45×45 grid, i.e. seven times coarser than the original 315×315 pixels. Hence, for comparison, simulated velocity fields are rebinned (aver-aged) to this coarser resolution. Granules also decrease the time resolution and velocity fields issued from granule tracking are usually averaged over a time window longer than 5 min; here, we shall consider three time-windows with durations of 1000 s, 1 h, and 2 h.
But granules are also three-dimensional structures and therefore they “feel” the large-scale velocity fields aver-aged over some range of depths. The approximate depth and thickness of the contributing layer need to be deter-mined.
Using the three above mentioned time-windows, we plotted in Fig. 1 the linear correlation between veloc-ity fields issued from granule tracking u (for a descrip-tion of how this field is derived, see Roudier et al. 1999 or Rieutord et al. 2001) and the “original” ones v as a function of depth; this correlation is defined by Cv =
hu · vi/phu2i hv2i. This figure clearly shows that the
cor-relation increases with the length of the time window hence showing that granules are best for tracing large-scale flows which evolve on long time large-scales. It also shows that the correlation is best at a depth below the τ = 1 surface (here z = 0); this is clearly emphasized by Fig. 2
ration of the 23scale as a consequence of the very few resolution
elements left for this scale (∼5×5). Line type have the same meaning as in Fig. 1.
where we see that the optimal depth (where the correla-tion is maximum) is between 200 km and 300 km.
We also tested the dependence of correlations with re-spect to the thickness of the layer and found that it is weak: variations of correlations are of 2 or 3% when the thickness of the layer is varied between 40 and 900 km.
The foregoing results show that granules do trace long time-averaged flows, thus we should observe a better cor-relation when small spatial scales are filtered out. This is indeed the case, as shown by Fig. 3. Using the decompo-sition of the velocity field onto the different scales yielded by a MultiResolution Analysis with Daubechies’ wavelets, using the scaling function φ4(Daubechies 1992), we show
that the correlation reaches∼0.9 at the largest scale avail-able.
In Fig. 4, we plotted the actual velocity as a function of the measured velocity for various length scales. The clouds of points clearly show that granules motions sta-tistically underestimate the actual plasma velocity by a factor which (likely) tends to unity as the scale increases. When no filtering is made, measured velocities miss “real” velocities by roughly a factor 2. This quantitative dis-agreement is of course even more pronounced in derivative quantities (divergence or vorticity).
This behaviour is of course no surprise because gran-ules are far from being passive lagrangian tracers: on the contrary they are active vortical structures which can move in the background fluid thanks to their own vor-ticity or the one of their neighbours. Their motion may be compared (but just qualitatively) to the random motion of molecules in a gas: only long time averages or large-scale averages are able to raise the signal of the mean motion above the noise of random motions.
Finally, let us mention that we have done these tests using the two presently known methods of granule track-ing, namely LCT and CST. As illustrated in Fig. 1, both methods give remarkably close results (within a few per-cent in correlation), a fact which gives confidence in the
flow. This figure, however, shows that large granules are sensitive to “deep” undercurrents. The depth for optimal correlation increases with the size of the granules.
On the other hand, the life-time is a good criterion for sampling the plasma velocity field. The motion of long-lived granules can reach 0.9 correlation with the actual flow field as shown in Fig. 6. Besides, the layer sampled by these granules is not precisely defined and oscillate around the τ = 1 level.
3. Conclusions
We have used a simulation of compressible convection with radiative transfer in grey approximation to test the ability of granules at tracing the actual plasma flow. The box used for this simulation is 30×30 Mm2 wide and 3 Mm deep,
resolved by a 315×315×82 grid. The results of these tests show that
– Granules tend to be Lagrangian tracers when the time and length scales of the flow tend to infinity: it shows that scale separation is a necessary condition for using granules at representing plasma flows. Quantitatively, we find that the length scale needs to be larger than 2.5 Mm and the time scale longer than 1h for the cor-relation to be higher than 0.9.
– They underestimate the velocity field, all the more that scale separation is weak.
– Statistically, they probe a layer 300–400 km beneath the τ = 1 surface.
– Long-lived granules are good tracers.
Hence, we see that granules can be used as tracers to reveal flows at meso- and supergranular scale. At smaller scales their own velocity field has a too strong interaction with the background velocity field. However, it may well be that velocity fields associated with exploding granules or with “strong positive divergences” (see Rieutord et al. 2000), which are near the lowest (allowed) scale, are correctly rep-resented by granules motions, at least qualitatively, since they are strong advective motions in nature.
Finally, let us note that the situation in the real sun may not be better than that of the simulation for the Reynolds number is much higher: nonlinear interactions
M. Rieutord et al.: Are granules good tracers of solar surface velocity fields? L17
Fig. 4. For three length scales (20, 21, 22), we represent the actual velocity (v which is either vx or vy) as a function of the measured velocity u for a two-hours average. The clouds represent the 452 grid points. The best fits (dashed line) show that
granules underestimate actual velocities by a factor which varies from 2.1 at small scales (20) to 1.6 at large scales (22).
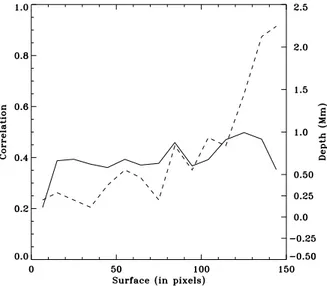
Fig. 5. Maximum correlation (solid line) between the actual
velocity field and the granule displacement at the place of the granule versus the surface area of the granule. Large granules are only slightly more correlated than smaller ones. The dashed line indicates the depth at which correlation is optimum.
are indeed stronger and thus real granules are less pas-sive. On the other hand, the drift of the thermal structure with respect to pure advection, which is another pitfall of granule tracking, is likely correctly represented by the simulation since it depends on the P´eclet number which is modeled accurately by the simulation in the layers of interest.
Acknowledgements. Calculations have been carried out on the
CalMip machine of the CICT which is gratefully acknowledged. R. F. Stein acknowledges financial support by NASA grant NAG 5-9563 and NSF AST grant 98-19799. ˚A. N. acknowl-edges support by the Danish Research Foundation, through its establishment of the Theoretical Astrophysics Center.
Fig. 6. Maximum correlation (solid line) between the actual
velocity field and the granule displacement at the place of the granule versus the lifetime of the granule. The dashed line in-dicates the depth at which correlation is optimum.
References
Daubechies, I. 1992, Ten lectures on wavelets (SIAM) November, L. J. 1989, in High Spatial Resolution Solar
Observations, ed. O. Von der L¨uhe, 457
November, L. J., & Simon, G. W. 1988, ApJ, 333, 427 Rieutord, M., Roques, S., Roudier, T., & Ducottet, C. 2001,
A&A, submitted
Rieutord, M., Roudier, T., Malherbe, J. M., & Rincon, F. 2000, A&A, 357, 1063
Roudier, T., Rieutord, M., Malherbe, J., & Vigneau, J. 1999, A&A, 349, 301
Stein, R. F., & Nordlund, ˚A. 1998, ApJ, 499, 914
Strous, L. 1995a, in Proc. of 4th SOHO Workshop: Helioseismology (ESA SP-376), 213
Strous, L. 1995b, in Proc. of 4th SOHO Workshop: Helioseismology (ESA SP-376), 219