HAL Id: hal-01762838
https://hal.archives-ouvertes.fr/hal-01762838
Submitted on 13 Jul 2018HAL is a multi-disciplinary open access
archive for the deposit and dissemination of sci-entific research documents, whether they are pub-lished or not. The documents may come from teaching and research institutions in France or abroad, or from public or private research centers.
L’archive ouverte pluridisciplinaire HAL, est destinée au dépôt et à la diffusion de documents scientifiques de niveau recherche, publiés ou non, émanant des établissements d’enseignement et de recherche français ou étrangers, des laboratoires publics ou privés.
Carlo Simulation Study
Réka Horváth, György Hantal, Sylvain Picaud, Milán Szöri, Pál Jedlovszky
To cite this version:
Réka Horváth, György Hantal, Sylvain Picaud, Milán Szöri, Pál Jedlovszky. Adsorption of Methy-lamine on Amorphous Ice under Interstellar Conditions. A Grand Canonical Monte Carlo Simulation Study. Journal of Physical Chemistry A, American Chemical Society, 2018, 122 (13), pp.3398 - 3412. �10.1021/acs.jpca.8b01591�. �hal-01762838�
Adsorption of Methylamine on Amorphous Ice under Interstellar
Conditions. A Grand Canonical Monte Carlo Simulation Study
Réka A. Horváth
a, György Hantal
b, Sylvain Picaud
c, Milán Szőri
d, Pál
Jedlovszky
e,*
a
Apáczai Csere János School of the ELTE University, Papnövelde u. 4. H-1053
Budapest, Hungary
b
Faculty of Physics, University of Vienna, Boltzmanngasse 5, A-1090 Vienna,
Austria
c
Institut UTINAM (CNRS UMR 6213), Université Bourgogne Franche-Comté, 16
route de Gray, F-25030 Besançon, France
d
Institute of Chemistry, University of Miskolc, Egyetemváros A/2, H-3515
Miskolc, Hungary
e
Department of Chemistry, Eszterházy Károly University, Leányka u. 6, H-3300
Eger, Hungary
Running title: Adsorption of methylamine on ice
*E-mail: [email protected] 3 4 5 6 7 8 9 10 11 12 13 14 15 16 17 18 19 20 21 22 23 24 25 26 27 28 29 30 31 32 33 34 35 36 37 38 39 40 41 42 43 44 45 46 47 48 49 50 51 52 53 54 55 56 57
Abstract:
The adsorption of methylamine at the surface of amorphous ice is studied at various temperatures, ranging from 20 K to 200 K, by grand canonical Monte Carlo simulations under conditions that are characteristic to the interstellar medium (ISM). The results are also compared with those obtained earlier on crystalline (Ih) ice. We found that methylamine has a
strong ability of being adsorbed on amorphous ice, involving also multilayer adsorption. The decrease of the temperature leads to a substantial increase of this adsorption ability, thus, considerable adsorption is seen at 20-50 K even at bulk gas phase concentrations that are comparable with that of the ISM. Further, methylamine molecules can also be dissolved in the bulk amorphous ice phase. Both the adsorption capacity of amorphous ice and the strength of the adsorption on it are found to be clearly larger than those corresponding to crystalline (Ih)
ice, due to the molecular scale roughness of the amorphous ice surface as well as to the lack of clear orientational preferences of the water molecules at this surface. Thus, the surface density of the saturated adsorption monolayer is estimated to be 12.6 ± 0.4 µmol/m2, 20% larger than the value of 10.35 µmol/m2, obtained earlier for Ih ice, and at low enough surface coverages the
adsorbed methylamine molecules are found to easily form up to three hydrogen bonds with the surface water molecules. The estimated heat of adsorption at infinitely low surface coverage is calculated to be -69 ± 5 kJ/mol, being rather close to the estimated heat of solvation in the bulk amorphous ice phase of -74 ± 7 kJ/mol, indicating that there are at least a few positions at the surface where the adsorbed methylamine molecules experience a bulk-like local environment. 3 4 5 6 7 8 9 10 11 12 13 14 15 16 17 18 19 20 21 22 23 24 25 26 27 28 29 30 31 32 33 34 35 36 37 38 39 40 41 42 43 44 45 46 47 48 49 50 51 52 53 54 55 56
1. Introduction
The origin and formation of amino acids are of particular interest in astrochemical research, because their presence in the interstellar medium (ISM) may provide clues to the delivery of prebiotic molecules to the early Earth, the possible origins of life on Earth,1-3 and the possibility of Earth-like life elsewhere in the Universe.4 Glycine and methylamine (CH3NH2) are not just simple structural analogs (related to each other by the presence or
absence of the carboxyl group), but methylamine is also proposed to be a precursor of glycine. In the interstellar medium, CH3NH2 can be formed either by CH4 and NH3, well known to be
abundant in the ISM, under cosmic ray irradiation,5,6 or by the hydrogenation reaction of HCN on icy dust surfaces. CH3NH2 molecules that are trapped at solid surfaces can then thermally
react with CO2 to form carbamate, which can be converted to a glycine salt under vacuum
ultraviolet irradiation.7 Alternative pathways of this reaction, occurring through the CH2NH2
radical8,9 or acetic acid10 were also proposed in the literature.
Both glycine and methylamine compounds are common in the terrestrial biosphere,1 and both have also been detected in comet-exposed material from the Stardust sample return mission to comet Wild 2,11 by the Cometary Sampling and Composition (COSAC) instrument onboard the Rosetta Philae mission,12 as well as in multiple extraterrestrial samples, including carbonaceous chondrites.13-15 Carbonaceous chondrites, notably the CI (e.g. Orgueil) and CM (e.g. Murchinson) groups, contain high percentages (3% to 22%) of water,16 and also methylamine in the concentration of 331 nmol/g (Orgueil) and 85 nmol/g (Murchison).17 Generally, interstellar18 and cometary19 dust grains are frequently covered by amorphous solid water, this mantle also traps volatile reactants, and the water molecule can act both as a catalyst and as a chemical reactant.20 In order to characterize methylamine astrochemistry, Vinogradoff et al. reported a laboratory experiment, in which methylamine and formaldehyde were found to quickly react at interstellar or cometary ice analogues at astronomically relevant temperatures with a measured activation energy of 1.1 ± 0.05 kJ/mol.21 However, in the absence of relevant experiments, desorption behavior of methylamine from the ice surface was estimated to be identical with that of ammonia (with a value of 3×10¹² s as the pre-exponential factor, and 25 kJ/mol as the activation energy).21 As this example also shows, a major stumbling-block in our understanding of prebiotic chemistry in the ISM is the lack of a standardized and comprehensive approach to simulate grain-surface chemistry.22 Furthermore, improved gas-3 4 5 6 7 8 9 10 11 12 13 14 15 16 17 18 19 20 21 22 23 24 25 26 27 28 29 30 31 32 33 34 35 36 37 38 39 40 41 42 43 44 45 46 47 48 49 50 51 52 53 54 55 56 57
grain astrochemical models need to be developed in order to interpret the high-resolution data provided by Atacama Large Millimeter Array (ALMA).
Besides laboratory experiments, molecular details of the adsorption of methylamine at icy surfaces can also be investigated by computer simulation methods, in order to improve the current adsorption models used in astrochemistry. Such methods can well complement experiments, as they can provide a full, three-dimensional insight of atomistic resolution into the system of interest.23 Among the various computer simulation techniques, the grand canonical Monte Carlo (GCMC) method23,24 is particularly suitable for studying adsorption, since here the chemical potential rather than the number of the adsorbate molecules in the basic box is fixed, and thus, by systematically varying the chemical potential and determining the number of adsorbate molecules in a set of simulations, the adsorption isotherm can be determined, and simulation results can be analyzed in detail at surface coverage values that are relevant for the given adsorption process. The GCMC method has been successfully applied in the past two decades for a set of systems, such as for the adsorption of various small molecules at carbonaceous surfaces,25-31 metal oxides,32-35 covalent organic frameworks,36-38 crystalline ice,39-48 water clathrates,49 kaolinite,50,51 zeolites,52-58 self-assembled monolayers,59,60 and protein crystals.61
Since icy surfaces in the interstellar medium are predominantly covered by low density amorphous ice (LDA),18,19 here we study the adsorption of methylamine at the surface of LDA ice by GCMC simulations at temperatures that are relevant to the interstellar medium (i.e., a few tens of K). Besides its potential role in prebiotic evolution, methylamine, released primarily by decaying bodies,62 is also an abundant atmospheric pollutant, being involved in the catalytic ozone destruction process occurring at the polar stratospheres63 as well as increasing aerosol nucleation rates in the lower troposphere.64 For this purpose, recently we performed a detailed GCMC analysis of the adsorption of methylamine at the surface of crystalline, Ih ice at the tropospheric temperature of 200 K. Thus, the present study provides
also an excellent opportunity to investigate in detail the role of the state of the adsorbing phase (i.e., crystalline vs. amorphous ice) as well as that of the temperature in the details of the adsorption process. For this purpose, here we determine the adsorption isotherm of methylamine at the surface of LDA ice, and analyze in detail the properties of the adsorption layer at the temperatures of 200 K, 150 K, 100 K, 50 K, and 20 K, corresponding to the adsorption in the colder parts of the interstellar medium. Further, the comparison of the results 3 4 5 6 7 8 9 10 11 12 13 14 15 16 17 18 19 20 21 22 23 24 25 26 27 28 29 30 31 32 33 34 35 36 37 38 39 40 41 42 43 44 45 46 47 48 49 50 51 52 53 54 55 56
obtained at 200 K with our earlier data obtained at the surface of Ih ice47 provides information
on how the properties of the adsorption layer depends on the structure of the adsorbing phase, whereas the comparison of the results obtained at different temperatures can shed light on the temperature dependence of the adsorption process, and even allows us to extrapolate to lower temperatures, at which computer simulation studies cannot be done within reasonable time.
The paper is organized as follows. In sec. 2 details of the performed calculations, including GCMC simulations and ITIM analysis, are given. The results concerning the adsorption isotherm, the building up of the subsequent molecular layers of the adsorbate as well as the orientation and energetics of the adsorbed methylamine molecules that are in direct contact with the ice phase are discussed in detail in sec. 3. Finally, in sec. 4 the main conclusions of this study are summarized.
2. Computational Details
2.1. Grand Canonical Monte Carlo Simulations. The adsorption of methylamine at
the surface of low density amorphous ice has been simulated, using the Monte Carlo method, on the grand canonical (
µ
,V,T) ensemble at the temperatures (T) of 200 K, 150 K, 100 K, 50 K, and 20 K. The X, Y, and Z edges of the rectangular basic simulation box have been 100 Å, 35.926 Å, and 38.891 Å, respectively, X being the axis perpendicular to the ice surface. The basic box has consisted of 2880 water molecules. At each temperature, simulations have been performed at several chemical potentials of methylamine, ranging from values corresponding to practically no methylamine molecules in the basic box to those corresponding to the condensed phase of methylamine. The chemical potential values at which the simulations have been performed at the various temperatures, as well as the mean number of the methylamine molecules present in the basic box, resulted from these simulations, are summarized in Tables S1-S5 of the supporting information.To be consistent with our previous study concerning Ih ice,47 water and methylamine
molecules have been described by the TIP5P model65 and the potential model proposed by Impey et al.,66 respectively. TIP5P is known to be one of the best water models in describing low temperature aqueous phases,67 as it reproduce very well, among others, the temperature of maximum density65,67 as well as the melting point67 of water. Further, TIP5P reproduces the LDA/HDA liquid-liquid phase transition of water in the temperature range considered here.68 3 4 5 6 7 8 9 10 11 12 13 14 15 16 17 18 19 20 21 22 23 24 25 26 27 28 29 30 31 32 33 34 35 36 37 38 39 40 41 42 43 44 45 46 47 48 49 50 51 52 53 54 55 56 57
Both of these models used are rigid and pairwise additive, i.e., the total potential energy of the system is assumed to be the sum of the contributions of all molecule pairs. The interaction energy of a molecule pair consists of the Lennard-Jones and charge-charge Coulomb contributions of all the respective pairs of interaction sites. The CH3 group of the methylamine
molecule is treated as a single interaction site (united atom), whereas the water model has two non-atomic interaction sites, marked by L, located at the positions of the two lone pairs of the O atom. The interaction of a molecule pair is truncated to zero beyond the center-center cut-off distance of 12.5 Å. The interaction and geometry parameters of the potential models used are collected in Tables 2 and 3 of Ref. 47, respectively.
The simulations have been performed using the program MMC69 in the same way as described in our earlier paper.47 Thus, in every Monte Carlo step either, by 50% probability, a randomly chosen molecule has been randomly translated by no more than 0.25 Å and randomly rotated by no more than 15o, or by 50% probability, the number of the methylamine molecules in the basic box has been attempted to be changed by inserting or removing a molecule. Water and methylamine molecules have been selected for particle displacement steps with equal probabilities, and methylamine insertions and deletions have also been performed with 50%-50% probabilities. The insertion/deletion attempts have been made using the cavity biased scheme of Mezei,70,71 thus, insertions have only been attempted into centers of empty cavities of the radius of at least 2.6 Å. Suitable cavities have been searched for along a 100×100×100 grid, which has been regenerated after every 106 Monte Carlo steps. Particle displacement and insertion/deletion attempts have been accepted or rejected according to the standard Metropolis algorithm,23,72 and according to the acceptance criterion of the cavity biased scheme,70,71 respectively.
To create the LDA ice phase and surface, we started from the crystalline Ih ice phase
used in our previous work. This phase was melted by thermalizing it, on the canonical (N,V,T) ensemble, at 350 K by performing 3×10⁸ Monte Carlo steps, followed by another 108 Monte Carlo steps at 300 K. The melted system was then quenched by setting the temperature to 200 K, and performing another 108 Monte Carlo steps. Then two methylamine molecules were added to the vapor phase of the system, and this configuration has been used as the starting point of all grand canonical ensemble simulations. The system has then been equilibrated at every temperature and chemical potential by performing 109 – 3×10⁹ Monte Carlo steps, until neither the average total energy of the system nor the mean number of methylamine molecules 3 4 5 6 7 8 9 10 11 12 13 14 15 16 17 18 19 20 21 22 23 24 25 26 27 28 29 30 31 32 33 34 35 36 37 38 39 40 41 42 43 44 45 46 47 48 49 50 51 52 53 54 55 56
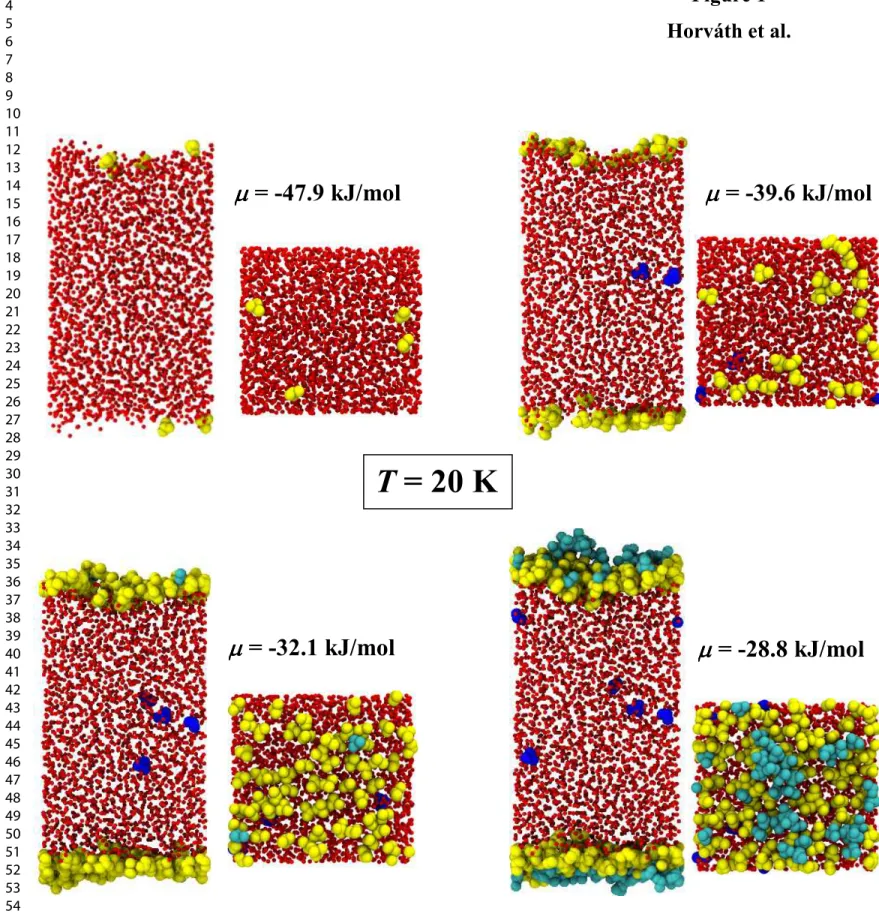
have shown even traces of a systematic drift. The mean number of the methylamine molecules has then been determined in every case by generating a 2×10⁸ Monte Carlo steps long equilibrium trajectory. Equilibrium snapshots of the 20 K system are shown in Figure 1, both in top and side views, as obtained at four different chemical potential values of methylamine.
To investigate the properties of the adsorption layer in detail, at selected chemical potential values, 5000 equilibrium sample configurations, separated by 4×10⁵ Monte Carlo steps long runs each, have been saved from the 2×10⁹ Monte Carlo steps long production runs for further evaluation. At each temperature four such chemical potential values have been chosen. The first of these values always corresponds to the presence of only very few, isolated methylamine molecules at the ice surface, the second one to a partly unsaturated monolayer, in which the methylamine molecules are no longer isolated from each other, the third one to a more or less saturated monolayer, while the fourth one to multilayer adsorption. For comparison with our earlier results, at 200 K dumping of configurations has also been done at two more chemical potential values, at which detailed analysis of the adsorption layer on Ih ice
was earlier performed.47 Finally, for reference purposes, configurations have also been saved for analyses at a
µ
value corresponding to the condensed phase of methylamine at 200 K. Theseµ
values, together with the mean number of methylamine molecules resulted from the corresponding simulations, are collected in Table 1, and are also indicated in Tables S1-S5 of the supporting information.2.2. Identification of the Dissolved and First Layer Methylamine Molecules. It has
turned out from the simulations that, unlike in the case of crystalline Ih ice, methylamine
molecules are not only adsorbed at the surface of the amorphous LDA ice, but they are also incorporated in the bulk ice phase, as seen also in some of the snapshots of Fig. 1. This finding is in a clear accordance with the results of the experiments of Vinogradoff et al., performed on methylamine/water mixtures under astrochemical conditions.21 Further, the surface of the amorphous ice phase, unlike that of the crystalline ice phase used in our previous simulation, 47 is corrugated on the molecular length scale. Therefore, the first molecular layer of the adsorbed phase of methylamine (i.e., the methylamine molecules that are in a direct contact with the ice phase) cannot simply be identified in the conventional way, with the first peak of the methylamine density profile. Instead, first layer methylamine molecules have to be identified 3 4 5 6 7 8 9 10 11 12 13 14 15 16 17 18 19 20 21 22 23 24 25 26 27 28 29 30 31 32 33 34 35 36 37 38 39 40 41 42 43 44 45 46 47 48 49 50 51 52 53 54 55 56 57
with an intrinsic surface analyzing method.73 Further, the methylamine molecules forming the first layer are needed to be distinguished not only from those belonging to one of the subsequent molecular layers in the adsorbed phase, but also from the ones that are dissolved into the bulk amorphous ice phase.
To perform the identification of the methylamine molecules forming the first adsorbed molecular layer as well as those inserted into the amorphous ice phase, we have applied a modified version of the Identification of Truly Interfacial Molecules (ITIM) method, developed originally to identify the instantaneous surface of fluid phases in computer simulations.74 This complex goal has been achieved in two major steps. In the first one, the ITIM algorithm has been performed solely on the ice phase, to identify the molecularly corrugated boundaries of the adsorbent. As a result, every methylamine molecule residing between these boundaries can be considered as being dissolved in the ice phase, and hence can be excluded from further analyses. This first round of the ITIM analysis has been followed by a second one, this time performed “inside-out” on the remaining methylamine molecules, to identify the innermost adsorbates in the immediate vicinity of the ice surface. This set of interface methylamine molecules has been considered as the first adsorbed layer in all subsequent analyses. In the ITIM procedure, probe spheres of a radius of 2 Å have been moved perpendicular to the plane of the macroscopic interface until they “touched” the outmost atom of the phase to be analyzed. Probes were “launched” from a grid set up above the surface. The spacing of the grid was set to 0.5 Å. The choice of these parameters was previously found to ensure an optimal sampling for molecularly corrugated surfaces.73,74 This method is illustrated in Fig. 1, where methylamine molecules belonging to the first molecular layer of the adsorbed phase are shown by yellow, those being in the outer part of the adsorption layer by cyan, while those inserted into the ice phase by dark blue color.
3. Results and Discussion
3.1. Adsorption Isotherm and Density Profiles. The average number of methylamine
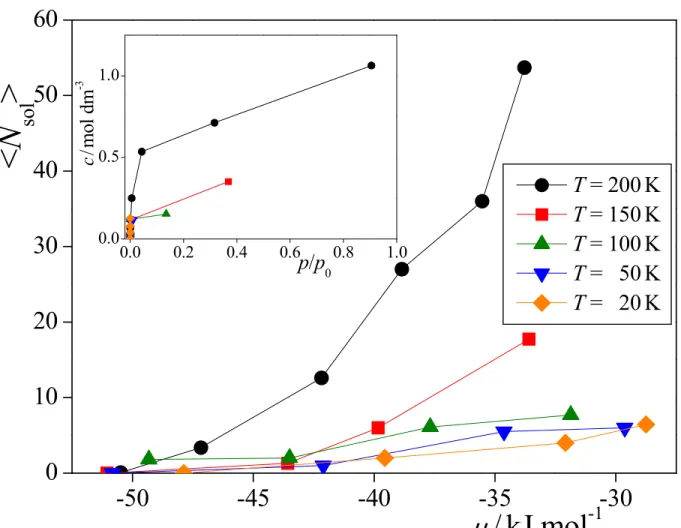
molecules present in the basic simulation box, <N>, is shown as a function of the chemical potential in Figure 2 as obtained from our GCMC simulations at the five temperatures considered. The chemical potential values at which sample configurations have been saved for detailed analyses are also indicated in the figure. It should be noted that the value of <N> has 3 4 5 6 7 8 9 10 11 12 13 14 15 16 17 18 19 20 21 22 23 24 25 26 27 28 29 30 31 32 33 34 35 36 37 38 39 40 41 42 43 44 45 46 47 48 49 50 51 52 53 54 55 56
been calculated on-the-fly, whereas, due to its computational cost, the ITIM procedure described in sec. 2 can only be performed, and hence also the distinction between the adsorbed and dissolved methylamine molecules can only be made on saved sample configurations. Therefore, the isotherms shown in Fig. 2 include both the adsorbed and dissolved methylamine molecules. The isotherms corresponding to different temperatures are rather similar to each other in shape: they all rise sharply and continuously up to the sudden jump corresponding to the point of condensation, without exhibiting any marked plateau. The very steep rise of the isotherms, occurring immediately before condensation, suggests that the adsorption of methylamine is not limited to one single molecular layer. As expected, the isotherms are shifted to higher chemical potential values with decreasing temperature. The
µ
values corresponding to the point of condensation, denoted here asµ
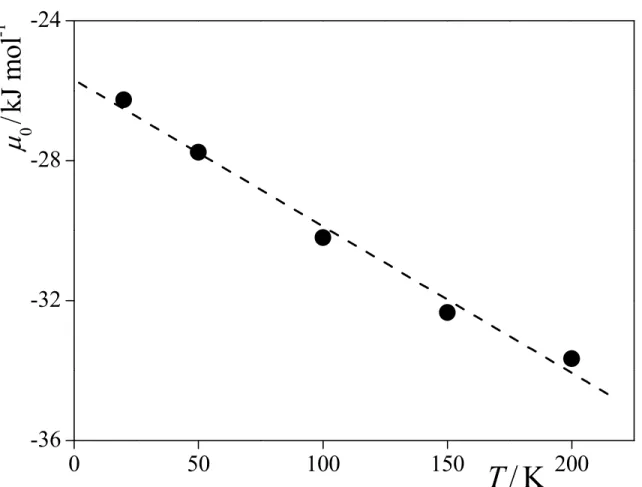
0, are estimated from the positionof the steepest rising part of the isotherms to be -26.26, -27.76, -30.20, -32.34, and -33.66 kJ/mol at 20, 50, 100, 150, and 200 K, respectively. As is seen from Figure 3, the value of
µ
0 increases practically linearly with decreasing temperature. Considering that, for onecomponent,
µ
is simply the molar free energy, and hence the molar entropy, Sm, is related to its temperature derivative as Sm = -(∂µ
/∂T), the observed linear temperature dependence ofµ
0implies that the corresponding molar entropy is constant (i.e., 41.9 ± 2.7 J/molK).
The comparison of the isotherms obtained at 200 K at the surfaces of crystalline, Ih47
and amorphous ice is shown in the inset of Fig. 2. As is seen, there are several important differences between the two isotherms. First, at low
µ
values, i.e., below about -40 kJ/mol, the isotherm corresponding to amorphous ice goes consistently above that of the Ih ice. Since inthis chemical potential range even the first molecular layer of methylamine is far from being saturated, this difference indicates stronger interaction of the methylamine molecules with the corrugated surface of amorphous ice, containing several troughs on the molecular length scale within which an adsorbed molecule can have more contact with the surrounding waters, than with the flat surface of Ih ice. Second, the clear plateau of the isotherm corresponding to Ih ice
in the
µ
range between about -40 and -35 kJ/mol, corresponding to the saturated monolayer, is completely missing in the case of amorphous ice. Instead, this latter isotherm rises continuously even in thisµ
range, indicating the building up of outer molecular layers of methylamine here. The lack of particular stability of the saturated monolayer at the amorphous ice surface is probably due to the fact that the adsorbed monolayer reflects the corrugation of 3 4 5 6 7 8 9 10 11 12 13 14 15 16 17 18 19 20 21 22 23 24 25 26 27 28 29 30 31 32 33 34 35 36 37 38 39 40 41 42 43 44 45 46 47 48 49 50 51 52 53 54 55 56 57the ice surface, and hence it also has several pockets of negative local curvature, in which the building up of the second molecular layer can start earlier than on a relatively flat monolayer, present at the surface of Ih ice. Finally, above the point of condensation the isotherm
corresponding to amorphous ice goes again above that of Ih ice. However, in this
µ
range thisdifference simply reflects the higher density of the somewhat disordered amorphous ice than that of the Ih ice, which leaves more space for the methylamine molecules in the basic
simulation box.
It should be emphasized, however, that the isotherm obtained at amorphous ice contains also the methylamine molecules that are dissolved in the ice phase, while no such dissolved molecules were found in the case of Ih ice.47 Hence, all the observed differences of the two
isotherms in all the three above discussed ranges of
µ
can, at least partly, be accounted for simply by the methylamine molecules dissolved in the bulk amorphous phase.We have also converted the obtained <N> vs.
µ
isotherms to the more conventionalΓ
vs. prel form, where
Γ
is the surface density of methylamine, calculated simply asYZ N Γ 2 > < = , (1)
and prel is the relative pressure, i.e., the ratio of the pressure of the system, p, and the pressure
corresponding to the point of condensation of methylamine at the given temperature, p0. prel
can be calculated using the value of
µ
0 as34) / exp( ) / exp( B 0 B 0 rel T k T k p p p
µ
µ
= = , (2)where kB is the Boltzmann constant. It should be noted that since p0 is the pressure of the
saturated vapor of methylamine, isotherms can only be converted to the
Γ
(prel) form up to thepoint of condensation, i.e., when methylamine is still in its vapor phase.
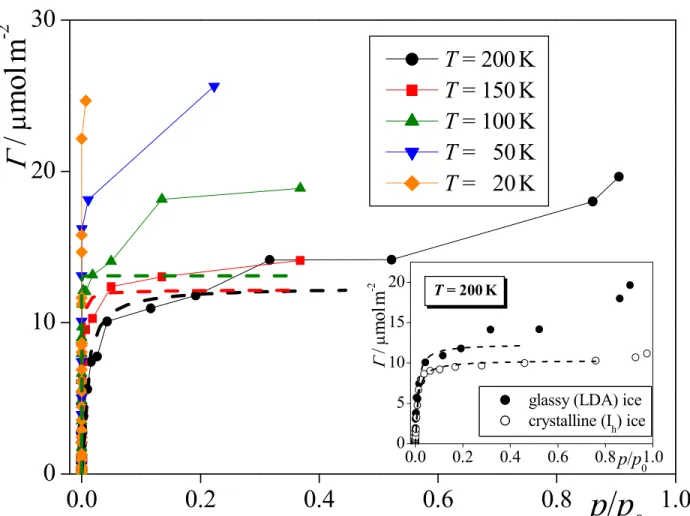
The obtained isotherms are shown in the
Γ
vs. prel form in Figure 4 as obtained at thefive temperatures considered; the corresponding values are also included in Tables S1-S5 of the supporting information. It should be emphasized again that these isotherms still contain the molecules that are dissolved in the bulk amorphous ice phase. As is seen, at a given prel value
the amount of adsorbed methylamine increases with decreasing temperature, and hence at
3 4 5 6 7 8 9 10 11 12 13 14 15 16 17 18 19 20 21 22 23 24 25 26 27 28 29 30 31 32 33 34 35 36 37 38 39 40 41 42 43 44 45 46 47 48 49 50 51 52 53 54 55 56
lower temperatures multilayer adsorption occurs at lower prel values. It is also evident that the
low pressure rising part of the isotherm becomes progressively steeper as the temperature decreases, due to the explicit dependence of prel on the temperature (see eq. 2). This steep rise
of the
Γ
(prel) isotherm at low temperatures results in considerable surface densities ofmethylamine already around the relative pressure value of 10-30 at 20 K and 10-20 at 50 K. To estimate the corresponding absolute pressure range, one needs the value of p0 at these
temperatures, the value of which is clearly inaccessible from the simulations. The temperature dependence of the experimental value of p0 is described by the Antoine equation:75
C T B A p + − = 0 ln , (3)
(p0 and T being in units of Pa and K, respectively), with the Antoine parameter values of
A = 21.92, B = 2383.1 K, and C = -37.574 K, at least in the temperature range between 190 and 267 K.76,77 On the other hand, upon going to lower temperatures, eq. 3 is expected to provide progressively worse estimate of p0, this estimate being 1.4×10³ Pa at 200 K, 2 Pa at 150 K, and
about 10-7 Pa at 100 K. Using the very conservative estimate of 1 Pa for p0 both at 20 K and
50 K, the gas phase concentration of methylamine corresponding to the above relative pressure values (i.e., 10-30 at 20 K and 10-20 at 50 K) can be estimated through c = p/RT as about 10-35 mol/dm3 (20 K) and 5 × 10-25 mol/dm3 (50 K), respectively. Considering that the typical molecular number density of methylamine in the ISM is about in the order of 10-2 molecule/dm3, i.e., 10-26 mol/dm3,78 our results reveal that considerable adsorption of methylamine at icy surfaces can be expected at the density and temperature characteristic of the cold part of the ISM.
The
Γ
(prel) isotherms obtained at 200 K at the surfaces of Ih and amorphous ice arecompared in the inset of Fig. 4. This comparison corroborates the conclusion drawn from the comparison of the <N> vs.
µ
isotherms that the saturated monolayer of methylamine consists of more molecules at the surface of amorphous than at Ih ice.To better understand the nature of the adsorption, we have fitted the Langmuir isotherm:79,80 K p K p Γ Γ rel rel max 1 + = (4) 3 4 5 6 7 8 9 10 11 12 13 14 15 16 17 18 19 20 21 22 23 24 25 26 27 28 29 30 31 32 33 34 35 36 37 38 39 40 41 42 43 44 45 46 47 48 49 50 51 52 53 54 55 56 57
to the obtained
Γ
vs. prel data at 200 K, 150 K, and 100 K. In eq. 4, the Langmuir parametersΓ
max and K are the surface density of the saturated monolayer, and the Langmuir partitioncoefficient, measuring the affinity of the adsorbate to the surface, respectively.79,80 The Langmuir curves fitted to the simulated data points are indicated by dashed lines in Fig. 4. As is seen, the obtained data can be reasonably well fitted up to a certain relative pressure value. This fit is never perfect, since the relatively strong lateral interaction acting between the adsorbed methylamine molecules introduces some slight deviation of the adsorption isotherms from the Langmuir form, as it was already noted in our previous study concerning Ih ice.47
Nevertheless, the fitted curve does not deviate strongly from the data points up to the prel value
of about 0.2, 0.05, and 0.02 at 200 K, 150 K, and 100 K, respectively, and this agreement also involves the beginning of the plateau part in every case. It should be emphasized, however, that, apart from the two points above prel = 0.8 at 200 K, all data points have always been
involved in the fitting procedure, not only the ones being in the prel range of reasonably good
fit. Clearly, at 200 K and 150 K the last two, while at 100 K the last three points that are used in the fitting procedure correspond to much larger
Γ
values than what is predicted from the fit, in spite of the fact that these points at intermediate prel values seemingly form a plateau of theisotherm. This plateau clearly could not be fitted in any case. Instead, the fitted functions, and thus also the values of the
Γ
max parameter are determined predominantly by the low prel datapoints, where the assumptions underlying the Langmuir isotherm are well satisfied. This fact suggests that the difference between the plateau value of the data points and that of the fitted Langmuir isotherm reflects primarily the effect of the methylamine molecules dissolved in the bulk amorphous ice phase (and, possibly, also partly the effect of the molecules that are located at the negative local curvature troughs of the saturated first molecular layer, forming already traces of the second molecular layer). The
Γ
max values obtained from the Langmuir fit resultedin 12.4, 12.2, and 13.0 µmol/m2 at 200 K, 150 K, and 100 K, respectively, suggesting that the surface density of the saturated monolayer of methylamine at the surface of amorphous ice is 12.6 ± 0.4 µmol/m2. This value is considerably higher than that corresponding to the surface of Ih ice of 10.35 µmol/m2,47 reflecting the fact that the corrugated surface of amorphous ice can
host more adsorbed molecules in the first monolayer than the flat surface of Ih ice (This
difference is also seen from the Langmuir functions fitted to the two 200 K data sets in the inset of Fig. 4.). 3 4 5 6 7 8 9 10 11 12 13 14 15 16 17 18 19 20 21 22 23 24 25 26 27 28 29 30 31 32 33 34 35 36 37 38 39 40 41 42 43 44 45 46 47 48 49 50 51 52 53 54 55 56
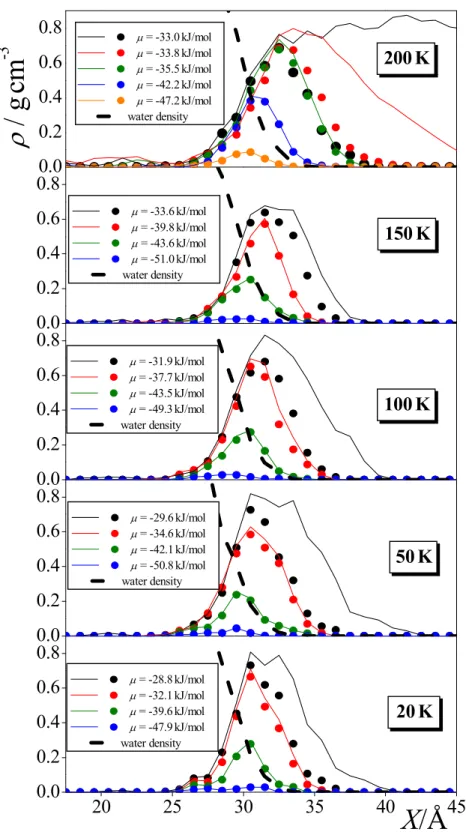
To check whether our above approach is correct, we have calculated the mass density profile of all methylamine molecules as well as of only those forming the first molecular layer at selected chemical potential values, using the saved sample configurations, at the five temperatures considered. The obtained profiles are shown in Figure 5. As is seen, at least at the highest chemical potential value considered at every temperature, the two profiles are markedly different from each other, indicating that at these state points the adsorption extends well beyond the first molecular layer. Assuming that the first molecular layer is already saturated in these cases, the number of molecules forming this layer can be estimated. Further, this assumption can be confirmed considering the case of condensed methylamine at 200 K (see the upper panel of Fig. 5), where this layer must be saturated. The number of methylamine molecules belonging to this saturated first molecular layer turns out to be 210 ± 20 in every case, which corresponds to the
Γ
value of 12.5 ± 1 µmol/m2, being in excellent agreement with the value estimated from the Langmuir fit of 12.6 ± 0.4 µmol/m2. TheΓ
values corresponding to the first molecular layer of methylamine at the selected chemical potential values,Γ
first, along with the corresponding prel values, are also included in Table 1.Having the adsorbed and dissolved methylamine molecules distinguished from each other, at least at the chemical potential values at which sample configurations have been collected, the dissolution (solubility) isotherms can also be, at least, estimated. The average number of the dissolved methylamine molecules, <Nsol>, is shown as a function of the
chemical potential at the five temperatures considered in Figure 6, while the inset of the figure shows these data in the c vs. prel form, where c is the bulk ice phase concentration of
methylamine: YZ X N c ice sol > < = , (5)
where the value of Xice, i.e., the X range of extension of the amorphous ice phase, has been
estimated to be 60 Å from the density profile of the water molecules (see Fig. 5). The c values obtained at different chemical potentials and temperatures are also included in Table 1. In interpreting the c(prel) solubility isotherms it should be recalled that, by performing particle
insertion and deletion steps, the GCMC method efficiently removes any barrier corresponding to the direct transport of the molecules between markedly different environments (e.g., the bulk
3 4 5 6 7 8 9 10 11 12 13 14 15 16 17 18 19 20 21 22 23 24 25 26 27 28 29 30 31 32 33 34 35 36 37 38 39 40 41 42 43 44 45 46 47 48 49 50 51 52 53 54 55 56 57
vapor phase, ice surface, and bulk ice phase), and simply results in configurations corresponding to the thermodynamic equilibrium. Therefore, our results show that in thermodynamic equilibrium a non-negligible amount of methylamine molecules are dissolved in the bulk LDA phase, but cannot say anything about the possible kinetic hindrance of reaching this equilibrium situation.
3.2. Orientation of the First Layer Methylamine Molecules. The full description of the relative orientation of a rigid body relative to an external direction requires the use of two independent orientational variables, such as the two polar angles of the external vector in a suitably chosen coordinate frame fixed to the rigid body. Therefore, the orientational statistics of such rigid bodies, such as rigid molecules in a computer simulation, relative to an external direction can only be fully described by the bivariate joint distribution of these variables.81,82 In analyzing the orientational preferences of the first layer methylamine molecules relative to the ice surface (or, equivalently, to the surface normal), we have chosen these variables in the following way. The frame is fixed to the individual methylamine molecules; its origin is the N atom, axis z points along the N-CH3 bond from the N atom to the CH3 group, axis y is parallel
with the segment that joins the two hydrogen atoms of the NH2 group, while axis x is
perpendicular to the above two axes, and it is oriented in such a way that the x coordinates of the amine H atoms are positive. The orientational variables
ϑ
andφ
are then the polar angles of the surface normal axis, X, pointing, by our convention, away from the ice phase (see Figure 7). To analyze the orientation of the surface water molecules, we have defined the local frame, fixed to the individual water molecules, in such a way that its origin is the O atom, axis x is the molecule normal, axis y is parallel with the line connecting the two H atoms, and axis z points along the bisector of the H-O-H angle, whileϑ
andφ
are again the polar angles of X in this frame (see Fig. 7). Due to the symmetry of the methylamine and water molecules, the above frames are always chosen such that the inequalitiesφ
≤ 180o, andφ
≤ 90o, respectively are also satisfied. It should also be noted that whileϑ
is the angle between two spatial vectors,φ
is that of two planar ones (i.e., two vectors that both lay, by definition, in the xy plane of the local frame), and hence random surface orientation results in a uniform bivariate distribution only if cosϑ
andφ
are chosen to be the orientational variables.81,823 4 5 6 7 8 9 10 11 12 13 14 15 16 17 18 19 20 21 22 23 24 25 26 27 28 29 30 31 32 33 34 35 36 37 38 39 40 41 42 43 44 45 46 47 48 49 50 51 52 53 54 55 56
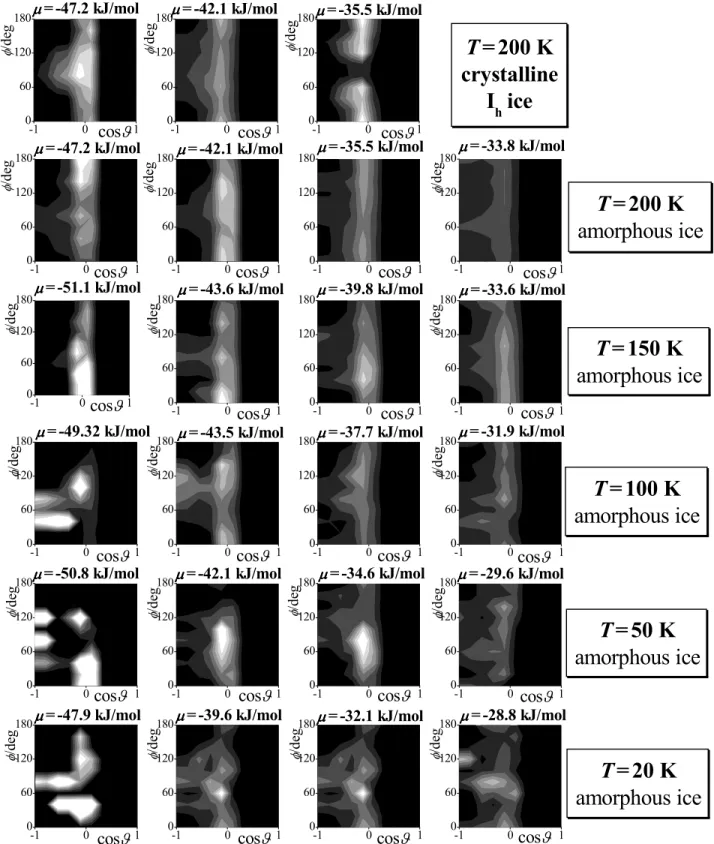
The P(cos
ϑ
,φ
) orientational maps of the first layer methylamine molecules are shown in Figure 8 as obtained at selected chemical potentials at the five temperatures considered. For comparisons, orientational maps, obtained previously on Ih ice at 200 K at the same chemicalpotential values that are also considered here, are also shown (top row). As is seen, the obtained maps are rather noisy, especially at low temperatures and low surface coverages, due to the extremely slow exploration of the configurational space at these very low temperatures. This fact limits the range of conclusions concerning the surface orientation of the adsorbed molecules that we can reliably draw from these orientational maps. Nevertheless, it is still clear that methylamine molecules prefer orientations corresponding to the cos
ϑ
value of 0, i.e., to the situation where the N-CH3 bond lays parallel with the macroscopic plane of the ice surface,YZ. This preference is stronger at lower surface coverages, and smoother distributions are obtained at higher temperatures, when the larger thermal motion of the molecules results in better statistics. Among the various orientations corresponding to cos
ϑ
= 0, no alignment is found to be clearly preferred at every temperature and surface coverage; the maps corresponding to various state points often exhibit preferences around theφ
values of 0o, 60o, 90o, 120o, and 180o. The alignments of the methylamine molecules corresponding to cosϑ
= 0 and these particularφ
values are illustrated in Fig. 7. In these orientations, the methylamine molecule always turns one or two of its three hydrogen bonding directions (i.e., the two N-H bonds and the lone pair direction of the N atom) towards the ice surface. However, due to the molecular scale roughness of the surface of amorphous ice, and to the corresponding presence of pockets of locally negative curvature at the surface, the adsorbed methylamine molecules located in such pockets can easily form even three hydrogen bonds with the surface waters, especially at low surface coverages. The extensive H-bond formation between the first layer methylamine and surface water molecules is also facilitated by the fact that surface waters on amorphous ice have very weak orientational preferences, as compared to those at the surface of Ih ice, as demonstrated in Fig. 7. The orientational flexibility of the surface water moleculesenables them to adopt orientations by which they can maximize the number of methylamine-water hydrogen bonds. Further, as it was discussed in detail in our previous paper,47 the parallel alignment of the N-CH3 bond with the ice surface promotes various relative
alignments, corresponding to strong dipolar interaction, of the neighboring adsorbed methylamine molecules. 3 4 5 6 7 8 9 10 11 12 13 14 15 16 17 18 19 20 21 22 23 24 25 26 27 28 29 30 31 32 33 34 35 36 37 38 39 40 41 42 43 44 45 46 47 48 49 50 51 52 53 54 55 56 57
3.3. Energetics of the Adsorption. To further analyze the interaction of the adsorbed methylamine molecules both with each other and with the surface waters, and to characterize the energetic background of the adsorption, we have calculated the binding energy of the methylamine molecules belonging to the first molecular layer at the selected chemical potential values at all the five temperatures considered. The binding energy of an adsorbed molecule, Ub,
is defined as its interaction energy with the rest of the system (i.e., the energy cost of bringing this molecule to infinite distance). Besides Ub, its contributions coming from the interaction
with the ice phase, and with the other methylamine molecules present in the system, denoted
here as Ubice and Ublat, respectively, have also been calculated.
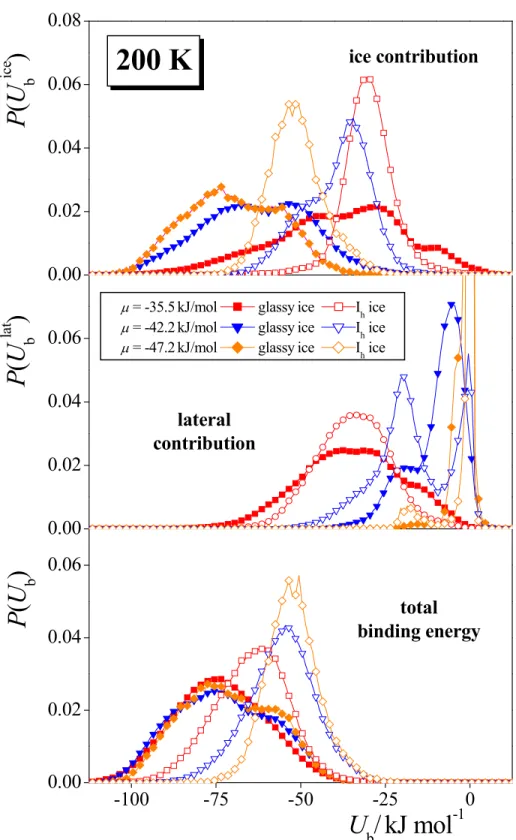
Some of the P(Ub), P(Ubice), and P(Ublat) distributions obtained at 200 K are shown
and compared with the corresponding results on Ih ice47 in Figure 9, while those obtained at
150 K, 100 K, and 50 K are shown in Figures 10.a, 10.b, and 10.c, respectively. (Similar, but considerably more noisy distributions have been obtained at 20 K.) As is expected, the lateral contribution to the total binding energy does not depend on the state of the ice phase. At low
surface coverages, the main peak of the P( lat
b
U ) distribution occurs at zero energy, reflecting
the large fraction of isolated methylamine molecules in the adsorption layer. Besides this trivial peak, another peak can be seen around -20 kJ/mol. This peak can be attributed to neighboring methylamine dimers interacting with each other by strong dipolar interaction.47 With increasing surface coverages, both of these peaks shift to lower energies due to the increasing background of the adsorbed methylamines, and also the relative weight of the latter, lower
energy peak gradually increases. The only difference seen between the P(Ublat) distributions obtained on amorphous and Ih ices is that the relative weight of the lower energy peak is
slightly larger in the former case. This difference can, however, simply be explained by the somewhat higher surface coverage observed on amorphous than on crystalline ice at every chemical potential (see Fig. 2).
On the other hand, the type of the ice phase has a great impact on the ice contribution of
the binding energy, Ubice. At the surface of Ih ice, the P(Ubice) distribution exhibits a peak
around -55 – -50 kJ/mol, and another one between -35 and -30 kJ/mol, attributed to the
3 4 5 6 7 8 9 10 11 12 13 14 15 16 17 18 19 20 21 22 23 24 25 26 27 28 29 30 31 32 33 34 35 36 37 38 39 40 41 42 43 44 45 46 47 48 49 50 51 52 53 54 55 56
methylamine molecules forming two and one hydrogen bonds with the ice phase, respectively, and with increasing surface coverage the relative weight of this latter peak increases gradually.47 At the surface of amorphous ice, this distribution is markedly shifted to lower energies. Further, besides the above two positions, another peak of the distribution emerges between -75 and -70 kJ/mol. This peak can be attributed to methylamine molecules forming three hydrogen bonds with the ice surface. In principle, a methylamine molecule can form up to three hydrogen bonds, and could orient in such a way (i.e., turning the CH3 group straight
away from the ice surface) that all the three of its potential H-bonding directions (i.e., the two N-H bonds and the lone pair of the N atom) points towards the ice phase. However, this orientation (corresponding to the cos
ϑ
= 1 line of the orientational maps of Fig. 8) was found not to be preferred at all both on crystalline,47 and on amorphous ice. The reason of the lack of preference for this orientation is probably that it hinders the formation of strong dipolar pairs by the neighboring adsorbed methylamine molecules (or, more precisely, the formation of such a dipolar pair in the first molecular layer would imply very weak interaction of the other methylamine molecule with the ice phase).47 On the other hand, the molecular level corrugation of the surface of amorphous ice offers certain positions of locally negative curvature (i.e., molecular size troughs), within which the adsorbed methylamine molecule can still maintain all of its three possible hydrogen bonds. It is also seen from Fig. 9 that theincrease of the surface density leads both to the slight shift of the position of the P(Ubice) peaks to higher energies, and to the increase of the relative weights of the peaks corresponding to smaller number of hydrogen bonds. Both effects can be explained by the increasing competition of the methylamine molecules at the surface.
The heat of the adsorption at infinitely low surface coverage, an experimentally
accessible quantity, can be estimated by the mean value of the P(Ubice) distribution at low enough surface coverages, where the lateral interaction is small enough with respect to the adsorbate-adsorbent interaction. Using the lowest sampled chemical potential in every case, this value turns out to be -72 kJ/mol at 200 K, and scatters between -65 and -75 kJ/mol at the other temperatures considered, showing no apparent temperature dependence; its temperature independent value is estimated here to be -69 ± 5 kJ/mol. By contrast, at the surface of Ih ice
this value was found to be only -51.3 kJ/mol,47 emphasizing again the higher affinity of methylamine to the surface of amorphous than to that of crystalline ice. Unfortunately, we are
3 4 5 6 7 8 9 10 11 12 13 14 15 16 17 18 19 20 21 22 23 24 25 26 27 28 29 30 31 32 33 34 35 36 37 38 39 40 41 42 43 44 45 46 47 48 49 50 51 52 53 54 55 56 57
not aware of any experiment in which this value is accessed at infinitely low surface coverage. The binding energy of methylamine on amorphous ice was, however, estimated in the very recent paper of Chaabouni et al.83 at higher surface coverages. In a clear accordance with our results, they obtained a trimodal distribution at the surface coverage corresponding to 32% of the saturated monolayer, with the mean values of the peaks corresponding roughly to -35, -45, and -61 kJ/mol (see Fig. 7 of Ref. 83). Similar, although somewhat lower values are obtained here when considering chemical potential values corresponding to similar surface coverages (e.g., -34, -52, and -71 kJ/mol at 100 K). At the lowest surface coverage considered, corresponding to 15% of the saturated monolayer, Chaabouni et al. estimated the binding energy to be -50 kJ/mol,83 which is considerably smaller in magnitude than our estimate of -69 ± 5 kJ/mol. However, our value is derived from configurations corresponding to the surface coverage values of 0.18-0.36 µmol/m2, which, considering our estimate of 12.6 µmol/m2 for the saturated monolayer (see sec. 3.1), corresponds to only 1.5-3% of the saturated monolayer. This one order of magnitude difference between the surface coverages can largely explain the above difference between our result and the value reported by Chaabouni et al. It should also be noted that Chaabouni et al. measured the surface desorption rate of methylamine, and derived the binding energy distribution using several model assumptions.83 Nevertheless, this comparison also leaves open the possibility that the potential model combination used in the present study somewhat overestimates the adhesion between the ice surface and the methylamine molecules. It should also be noted that the experimental value of the activation energy of the methylamine desorption reported by Chaabouni et al. as well as the heat of adsorption value estimated from our simulations, considering either amorphous or crystalline ice, are a factor of 2-3 larger than the speculative value of -25 kJ/mol, estimated by Vinogradoff et al., assuming that the desorption activation energy of methylamine is identical to that of ammonia.21
Due to the larger ice contribution, the total binding energy distribution, P(Ub), is also
shifted to lower energies when going from crystalline to amorphous ice. Interestingly, the distributions obtained at various surface coverages are rather similar to each other, indicating that the weakening of the adsorbate-ice interaction is fully compensated by the increase of the lateral interaction upon increasing the surface coverage. At lower temperatures, the obtained
3 4 5 6 7 8 9 10 11 12 13 14 15 16 17 18 19 20 21 22 23 24 25 26 27 28 29 30 31 32 33 34 35 36 37 38 39 40 41 42 43 44 45 46 47 48 49 50 51 52 53 54 55 56
P(Ub) curves exhibit two distinguishable peaks, still reflecting the presence of methylamine
molecules forming two and three hydrogen bonds with the surface waters.
The binding energy distributions obtained at lower temperatures show the same general picture, with no apparent temperature dependence of their features. The only clear effect of the temperature decrease is that the distributions become more structured, and their peaks get sharper. Although this effect can be explained by the decreasing weight of the entropy term of the free energy of the system, it is presumably also, at least partly, due to the worsening of the sampling due to the decreased mobility of the molecules at lower temperatures.
Besides that of the adsorption layer, we have also investigated the energetics of the methylamine molecules that are dissolved in the bulk ice phase. The bulk phase concentration of these molecules is always small enough that the lateral contribution to their binding energy
is nearly zero. Therefore, here we only discuss the distribution of the ice contribution, Ubice.
The P(Ubice) distribution of the dissolved molecules is shown in Figure 11 in all cases when it is not affected by too large statistical noise. The distributions do not show apparent dependence on the chemical potential (as the corresponding bulk ice concentration is always small enough); the observed differences can rather be attributed to the poor sampling due to the small number of the dissolved molecules.
At 200 K, the obtained P(Ubice) distributions are smooth and unimodal, having their peak between -80 and -85 kJ/mol. At lower temperatures, peaks corresponding to methylamines forming two and three hydrogen bonds with the surrounding water molecules can, in some cases, be distinguished. The overall picture is rather similar to what has been seen in the first adsorbed monolayer, with a shift of the entire distributions to about -10 kJ/mol
lower energies. The energy of solvation at infinite dilution, obtained considering the P(Ubice)
distribution in all cases when the P(Ublat) distribution (not shown) does not extend below -5 kJ/mol, has turned out to be -74 ± 7 kJ/mol. This value is only about 5 kJ/mol deeper than what is obtained in the surface monolayer, emphasizing again that at low enough surface coverages methylamine molecules can be accommodated in pockets of locally negative curvature of the surface, in which their local environment can be rather similar to that inside the bulk ice phase.
3 4 5 6 7 8 9 10 11 12 13 14 15 16 17 18 19 20 21 22 23 24 25 26 27 28 29 30 31 32 33 34 35 36 37 38 39 40 41 42 43 44 45 46 47 48 49 50 51 52 53 54 55 56 57
4. Summary and Conclusions
In this paper, we presented a detailed computer simulation analysis of the adsorption of methylamine at the surface of amorphous ice at low temperatures, some of which are relevant in studying processes occurring in the ISM. Our results clearly showed that methylamine has a strong ability of being adsorbed at such surfaces, which leads even to multilayer adsorption at high enough relative pressures. The adsorption was found to be strongly enhanced by the decrease of the temperature, thus, in the temperature range of 20-50 K, characteristic of a large part of the space, considerable surface densities can be reached even at as low bulk gas phase concentrations that occur in the ISM. It should be emphasized, however, that our simulations access only the state of thermodynamic equilibrium, but can say nothing about the kinetics of the adsorption. In other words, we found that at the low temperatures and concentrations characteristic to the ISM icy surfaces may well contain a considerable amount of adsorbed methylamine in equilibrium, but have no access to the time scale within which this equilibrium can be reached under the extreme conditions of the ISM.
When comparing our present results with those obtained earlier at the surface of crystalline (Ih) ice under similar conditions,47 we found a considerably higher adsorption
capacity of the amorphous ice surface than that of Ih ice, primarily due to the larger surface
area of the amorphous phase, resulted from the corrugation of its surface. This increase of the surface area is estimated to be as large as 20% from the surface densities of the saturated monolayer, being 10.35 µmol/m2 on crystalline,47 while about 12.5 µmol/m2 on amorphous ice. Further, besides its increased adsorption capacity, it is also found that amorphous ice, unlike Ih
ice,47 is able to dissolve a noticeable amount of methylamine. This finding is in a clear accordance with the experimental finding of Vinogradoff et al.21
When analyzing the orientation and energetics of the methylamine molecules forming the first molecular layer, we found that the aforementioned enhanced adsorption capacity of amorphous ice is coupled with its ability of binding methylamine molecules considerably stronger than Ih ice. Thus, due to the molecular size roughness of the surface of amorphous ice
(i.e., the presence of troughs), and to the almost negligible orientational preference of the surface water molecules, the first layer methylamine molecules can easily form even three
3 4 5 6 7 8 9 10 11 12 13 14 15 16 17 18 19 20 21 22 23 24 25 26 27 28 29 30 31 32 33 34 35 36 37 38 39 40 41 42 43 44 45 46 47 48 49 50 51 52 53 54 55 56
This behavior is in a clear contrast with our earlier finding on Ih ice, where the adsorbed
molecules do not form more than two such H-bonds. This difference is also reflected in the estimated heat of adsorption values at infinitely low surface coverage of -51.3 kJ/mol (on Ih
ice)47 and -69 ± 5 kJ/mol (on amorphous ice). This latter value is rather close to the estimated heat of solvation of -74 ± 7 kJ/mol in the bulk amorphous ice phase, confirming again that at the rough surface of amorphous ice, consisting of water molecules with no particular pre-defined orientational preferences, methylamine molecules at low surface coverages experience an almost bulk-like local environment. Finally, it has to be pointed out that the heat of adsorption, estimated at the surface of both Ih and amorphous ice, is considerably lower than
the speculative value of Vinogradoff et al. of -25 kJ/mol,21 revealing that the crude assumption of considering this value to be identical with that of NH3, made in this latter study,21 clearly
represents a serious oversimplification of the real situation.
Acknowledgements
The authors acknowledge financial support from the NKFIH Foundation, Hungary (project number 119732) from the Hungarian-French TéT (BALATON) program (project number TéT_15_FR-1-2016-0056), and from CNRS in the frame of the PICS program. M. Sz. is grateful for the financial support by the János Bolyai Research Scholarship of the Hungarian Academy of Sciences (BO/00113/15/7), the New National Excellence Program of the Ministry of Human Capacities (ÚNKP-17-4-III-ME/26), and also acknowledges the support provided by the European Union and the Hungarian State, co-financed by the European Regional Development Fund in the framework of the GINOP-2.3.4-15-2016-00004 project, aimed to promote the cooperation between the higher education and the industry. The authors are indebted to Dr. Céline Toubin (University of Lille) for discussions initiating this study.
Supporting Information. Numerical data of the calculated adsorption isotherms. This material is available free of charge via the Internet at http://pubs.acs.org.
3 4 5 6 7 8 9 10 11 12 13 14 15 16 17 18 19 20 21 22 23 24 25 26 27 28 29 30 31 32 33 34 35 36 37 38 39 40 41 42 43 44 45 46 47 48 49 50 51 52 53 54 55 56 57
References
(1) Oro, J. Comets and the Formation of Biochemical Compounds on the Primitive Earth. Nature 1961, 190, 389-390.
(2) Brack, A. Life in the Solar System. Adv. Space Res. 1999, 24, 417-433.
(3) Meierhenrich, U.; Thiemann, W. H. P.; Rosenbauer, H. Molecular Parity Violation via Comets? Chirality 1999, 11, 575–582.
(4) Newton, D. E. Chemistry of Space in Series New Chemistry; Facts on File Inc.: New York, 2007.
(5) Kim, Y. S.; Kaiser, R. I. On the Formation of Amines (RNH2) and the Cyanide Anion
(CN−) in Electron-Irradiated Ammonia–Hydrocarbon Interstellar Model Ices. Astrophys. J. 2011, 729, 68.
(6) Förstel, M.; Bergantini, A.; Maksyutenko, P.; Góbi, S.; Kaiser, R. I. Formation of Methylamine and Ethylamine in Extraterrestrial Ices and Their Role as Fundamental Building Blocks of Proteinogenic α-Amino Acids. Astrophys. J. 2017, 845, 83.
(7) Theule, P.; Borget, F.; Mispelaer, F.; Danger, G.; Duvernay, F.; Guillemin, J. C.; Chiavassa, T. Hydrogenation of Solid Hydrogen Cyanide HCN and Methanimine CH2NH at Low Temperature. Astron. Astrophys. 2011, 534, A64.
(8) Woon, D. E. Pathways to Glycine and Other Amino Acids in Ultraviolet-Irradiated Astrophysical Ices Determined via Quantum Chemical Modeling. Astrophys. J. Letters
2002, 571, L177-L180.
(9) Holtom, P. D.; Bennett, C. J.; Osamura, Y.; Mason, N. J.; Kaiser, R. I. A Combined Experimental and Theoretical Study on the Formation of the Amino Acid Glycine (NH2CH2COOH) and Its Isomer (CH3NHCOOH) in Extraterrestrial Ices. Astrophys. J. 2005, 626, 940-952.
(10) Kaiser, R. I.; Stockton, A. M.; Kim, Y. S.; Jensen, E. C.; Mathies, R. A. On the Formation of Dipeptides in Interstellar Model Ices. Astrophys. J. 2013, 765, 111.
(11) Glavin, D. P.; Dworkin, J. P.; Sandford, S. A. Detection of Cometary Amines in Samples Returned by Stardust Meteorit. Planet. Sci. 2008, 43, 399-413.
(12) Goesmann, F.; Rosenbauer, H.; Bredehöft, J. H.; Cabane, M.; Ehrenfreund, P.; Gautier, T.; Giri, C.; Krüger, H.; Le Roy, L.; MacDermott, A. J.; McKenna-Lawlor, S.;
3 4 5 6 7 8 9 10 11 12 13 14 15 16 17 18 19 20 21 22 23 24 25 26 27 28 29 30 31 32 33 34 35 36 37 38 39 40 41 42 43 44 45 46 47 48 49 50 51 52 53 54 55 56
Sternberg, R.; Szopa, C.; Thiemann, W.; Ulamec, S. Organic Compounds on Comet 67P/Churyumov-Gerasimenko Revealed by COSAC Mass Spectrometry. Science 2015,
349, aab0689.
(13) Aponte, J. C.; Elsila, J. E.; Glavin, D. P.; Milam, S. N.; Charnley, S. B.; Dworkin, J. P., Pathways to Meteoritic Glycine and Methylamine. ACS Earth Space Chem. 2017, 1, 3-13.
(14) Jungclaus, G. A.; Cronin, J. R.; Moore, C. B.; Yuen, G. U. Aliphatic Amines in the Murchison Meteorite. Nature 1976, 261, 126-128.
(15) Pizzarello, S.; Feng, X.; Epstein, S.; Cronin, J. R. Isotopic Analyses of Nitrogenous Compounds from the Murchison Meteorite: Ammonia, Amines, Amino Aacids, and Polar Hydrocarbons. Geochim. Cosmochim. Acta 1994, 58, 5579-5587.
(16) Pizzarello, S.; Holmes, W. Nitrogen-Containing Compounds in two CR2 Meteorites: 15N Composition, Molecular Distribution and Precursor Molecules. Geochim. Cosmochim. Acta 2009, 73, 2150−2162.
(17) Aponte, J. C.; Dworkin, J. P.; Elsila, J. E. Indigenous Aliphatic Amines in the Aqueously Altered Orgueil Meteorite. Meteorit. Planet. Sci. 2015, 50, 1733–1749. (18) Cottin, H.; Gazeau, M. C.; Raulin, F. Cometary Organic Chemistry: A Review from
Observations Numerical and Experimental Simulations. Planet. Space Sci. 1999, 47, 1141–1162.
(19) Mispelaer, F.; Theule, P.; Aouididi, H.; Noble, J.; Duvernay, F.; Danger, G.; Roubin, P.; Morata, O.; Hasegawa, T.; Chiavassa, T.; Diffusion Measurements of CO, HNCO, H2CO, and NH3 in Amorphous Water Ice. Astron. Astrophys. 2013, 555, A13.
(20) Danger, G.; Rimola, A.; Abou Mrad, N; Duvernay, F.; Roussin, G; Theule, P.; Chiavassa, T. Formation of Hydroxyacetonitrile (HOCH2CN) and Polyoxymethylene
(POM)-Derivatives in Comets from Formaldehyde (CH2O) and Hydrogen Cyanide
(HCN) Activated by Water. Phys. Chem. Chem. Phys. 2014, 16, 3360-3370.
(21) Vinogradoff, V.; Duvernay, F.; Danger, G.; Theulé, P.; Borget, F.; Chiavassa T. Formaldehyde and Methylamine Reactivity in Interstellar Ice Analogues As a Source of Molecular Complexity At Low Temperature. Astron. Astrophys. 2013, 549, A40.
(22) Cuppen, H. M.; Walsh, C.; Lamberts, T.; Semenov, D.; Garrod, R. T.; Penteado, E. M.; Ioppolo, S. Grain Surface Models and Data for Astrochemistry. Space Sci. Rev. 2017,
212, 1–58. 3 4 5 6 7 8 9 10 11 12 13 14 15 16 17 18 19 20 21 22 23 24 25 26 27 28 29 30 31 32 33 34 35 36 37 38 39 40 41 42 43 44 45 46 47 48 49 50 51 52 53 54 55 56 57
(23) Allen, M. P.; Tildesley, D. J. Computer Simulation of Liquids; Clarendon: Oxford, 1987.
(24) Adams, D. J. Grand Canonical Ensemble Monte Carlo for a Lennard-Jones Fluid. Mol. Phys. 1975, 29, 307-311.
(25) Samios, S.; Stubos, A. K.; Kanellopoulos, N. K.; Cracknell, R. F.; Papadopoulos, G. K.; Nicholson, D. Determination of Micropore Size Distribution from Grand Canonical Monte Carlo Simulations and Experimental CO2 Isotherm Data. Langmuir 1997, 13,
2795-2802.
(26) Muller, E. A.; Hung, F. R.; Gubbins, K. E. Adsorption of Water Vapor-Methane Mixtures on Activated Carbons. Langmuir 2000, 16, 5418-5424.
(27) Challa, S. R.; Sholl, D. S.; Johnson, J. K. Adsorption and Separation of Hydrogen Isotopes in Carbon Nanotubes: Multicomponent Grand Canonical Monte Carlo Simulations. J. Chem. Phys. 2002, 116, 814-824.
(28) Striolo, A.; Chialvo, A. A.; Gubbins, K. E.; Cummings, P. T. Water in Carbon Nanotubes: Adsorption Isotherms and Thermodynamic Properties from Molecular Simulation. J. Chem. Phys. 2005, 122, 234712.
(29) Moulin, F.; Picaud, S.; Hoang, P. N. M.; Jedlovszky, P. Grand Canonical Monte Carlo Simulation of the Adsorption Isotherms of Water Molecules on a Model Soot Particle J. Chem. Phys. 2007, 127, 164719.
(30) Hantal, Gy.; Picaud, S.; Hoang, P. N. M.; Voloshin, V. P.; Medvedev, N. N.; Jedlovszky, P. Water Adsorption Isotherms on Porous Onionlike Carbonaceous Particles. Simulations with the Grand Canonical Monte Carlo Method. J. Chem. Phys.
2010, 133, 144702.
(31) Firlej, L.; Kuchta, B.; Lazarewicz, A.; Pfeifer, P. Increased H2 Gravimetric Storage
Capacity in Truncated Carbon Slit Pores Modeled by Grand Canonical Monte Carlo. Carbon 2013, 53, 208-215.
(32) Puibasset, J.; Pellenq, R. J. M. Water Adsorption on Hydrophilic Mesoporous and Place Silica Substrates: a Grand Canonical Monte Carlo Simulation Study. J. Chem. Phys.
2003, 118, 5613-5622. 3 4 5 6 7 8 9 10 11 12 13 14 15 16 17 18 19 20 21 22 23 24 25 26 27 28 29 30 31 32 33 34 35 36 37 38 39 40 41 42 43 44 45 46 47 48 49 50 51 52 53 54 55 56
(33) Puibasset, J.; Pellenq, R. J. M. Water Adsorption in Disordered Mesoporous Silica (Vycor) at 300 K and 650 K : A Grand Canonical Monte Carlo Simulation Study of Hysteresis. J. Chem. Phys. 2005, 122, 094704.
(34) Daub, C. D.; Patey G. N.; Jack, D. B.; Sallabi A. K. Monte Carlo Simulations of the Adsorption of CO2 on the MgO(100) Surface. J. Chem. Phys. 2006, 124, 114706.
(35) Tombácz, E.; Hajdú, A.; Illés, E.; László, K.; Garberoglio, G.; Jedlovszky, P. Water in Contact with Magnetite Nanoparticles, as Seen from Experiments and Computer Simulations. Langmuir 2009, 25, 13007-13014.
(36) Jung, D. H.; Kim, D.; Lee, T. B.; Choi, S. B.; Yoon, J. H.; Kim, J.; Choi, K.; Choi, S. H. Grand Canonical Monte Carlo Simulation Study on the Catenation Effect on Hydrogen Adsorption onto the Interpenetrating Metal-Organic Frameworks. J. Phys. Chem. B 2006, 110, 22987-22990.
(37) Garberoglio, G. Computer Simulation of the Adsorption of Light Gases in Covalent Organic Frameworks. Langmuir 2007, 23, 12154-12158.
(38) Ramsahye, N. A.; Maurin, G.; Bourelly, S.; Llewellyn, P. L.; Devic, T.; Serre, C.; Loiseau, T.; Ferey, G. Adsorption of CO2 in Metal Organic Frameworks of Different
Metal Centres: Grand Canonical Monte Carlo Simulations Compared to Experiments. Adsorption 2007, 13, 461-467.
(39) Jedlovszky, P.; Partay, L.; Hoang, P. N. M.; Picaud, S.; von Hessberg, P.; Crowley, J. N. Determination of the Adsorption Isotherm of Methanol on the Surface of Ice. An Experimental and Grand Canonical Monte Carlo Simulation Study. J. Am. Chem. Soc.
2006, 128, 15300-15309.
(40) Hantal, G.; Jedlovszky, P.; Hoang, P.N.M.; Picaud, S. Investigation of the Adsorption Behavior of Acetone at the Surface of Ice. A Grand Canonical Monte Carlo Simulation Study. Phys. Chem. Chem. Phys. 2008, 10, 6369-6380.
(41) Jedlovszky, P.; Hantal, Gy.; Neuróhr, K.; Picaud, S.; Hoang, P. N. M.; von Hessberg, P.; Crowley, J. N. Adsorption Isotherm of Formic Acid on The Surface of Ice, as Seen from Experiments and Grand Canonical Monte Carlo Simulation. J. Phys. Chem. C
2008, 112, 8976-8987. 3 4 5 6 7 8 9 10 11 12 13 14 15 16 17 18 19 20 21 22 23 24 25 26 27 28 29 30 31 32 33 34 35 36 37 38 39 40 41 42 43 44 45 46 47 48 49 50 51 52 53 54 55 56 57