HAL Id: insu-02361226
https://hal-insu.archives-ouvertes.fr/insu-02361226
Submitted on 13 Nov 2019HAL is a multi-disciplinary open access archive for the deposit and dissemination of sci-entific research documents, whether they are pub-lished or not. The documents may come from teaching and research institutions in France or abroad, or from public or private research centers.
L’archive ouverte pluridisciplinaire HAL, est destinée au dépôt et à la diffusion de documents scientifiques de niveau recherche, publiés ou non, émanant des établissements d’enseignement et de recherche français ou étrangers, des laboratoires publics ou privés.
Seasonal variations in atmospheric composition as
measured in Gale Crater, Mars
Melissa G. Trainer, Michael H. Wong, Timothy H. Mcconnochie, Heather B.
Franz, Sushil K. Atreya, Pamela G. Conrad, Franck Lefèvre, Paul R. Mahaffy,
Charles A. Malespin, Heidi L. K. Manning, et al.
To cite this version:
Melissa G. Trainer, Michael H. Wong, Timothy H. Mcconnochie, Heather B. Franz, Sushil K. Atreya, et al.. Seasonal variations in atmospheric composition as measured in Gale Crater, Mars. Journal of Geo-physical Research. Planets, Wiley-Blackwell, 2019, 124 (11), pp.3000-3024. �10.1029/2019JE006175�. �insu-02361226�
Accected
Article
This article has been accepted for publication and undergone full peer review but has not been through the copyediting, typesetting, pagination and proofreading process which may lead to differences between this version and the Version of Record. Please cite this article as doi: 10.1002/jgre.21250
Trainer Melissa, G. (Orcid ID: 0000-0003-1106-8580) Wong Michael, H. (Orcid ID: 0000-0003-2804-5086) Mahaffy Paul, R. (Orcid ID: 0000-0003-1896-1726) McKay Christopher, P. (Orcid ID: 0000-0002-6243-1362) Navarro Gonzalez Rafael (Orcid ID: 0000-0002-6078-7621) Vicente-Retortillo Alvaro (Orcid ID: 0000-0002-4553-7624) Zorzano Maria-Paz (Orcid ID: 0000-0002-4492-9650)
Seasonal variations in atmospheric composition as measured in Gale Crater, Mars
Melissa G. Trainer1*, Michael H. Wong2, Timothy H. McConnochie3,Heather B. Franz1,
Sushil K. Atreya2, Pamela G. Conrad4, Franck Lefèvre5, Paul R. Mahaffy1, Charles A.
Malespin1, Heidi L. K. Manning6, Javier Martín-Torres7,8, Germán M. Martínez9,2,
Christopher P. McKay10, Rafael Navarro-González11, Álvaro Vicente-Retortillo2, Christopher R. Webster12, María-Paz Zorzano13, 7
Affiliations:
1NASA Goddard Space Flight Center, Greenbelt, MD 2University of Michigan, Ann Arbor, MI
3University of Maryland, College Park, MD 4
Geophysical Laboratory, Carnegie Institution of Washington, Washington, DC 20015
5
LATMOS, CNRS, Sorbonne Université, UVSQ, Paris, France
6
Misericordia University, Dallas PA
7Division of Space Technology, Department of Computer Science, Electrical and Space Engineering,
Luleå University of Technology, Luleå, Sweden
8Instituto Andaluz de Ciencias de la Tierra (CSIC-UGR), Granada, Spain
9Lunar and Planetary Institute, Universities Space Research Association, Houston, TX 10
NASA Ames Research Center, Moffett Field, CA
11
Instituto de Ciencias Nucleares. Universidad Nacional Autónoma de México, Ciudad de México, Mexico
12 NASA Jet Propulsion Laboratory, California Institute of Technology, Pasadena, CA 13 Centro de Astrobiología (INTA-CSIC), Torrejón de Ardoz, Madrid, Spain
*To whom correspondence should be addressed. E-mail: [email protected]
Revised manuscript submitted on 10/18/19 to: Journal of Geophysical Research: Planets
Key points
First multi-year in situ measurements of the major components of the Mars atmosphere have been obtained by the MSL/SAM investigation
Seasonal variation of CO2, N2, and Ar reveal differences in atmospheric transport and
mixing timescales.
Oxygen varies seasonally and interannually, independently from Ar and N2, on
Accected
Article
Abstract
The Sample Analysis at Mars (SAM) instrument onboard the Mars Science Laboratory Curiosity rover measures the chemical composition of major atmospheric species (CO2, N2, 40Ar, O
2, and CO) through a dedicated atmospheric inlet. We report here measurements of
volume mixing ratios in Gale Crater using the SAM quadrupole mass spectrometer, obtained over a period of nearly five years (three Mars years) from landing. The observation period spans the northern summer of MY 31, solar longitude (LS) of 175° through spring of MY 34,
LS = 12°. This work expands upon prior reports of the mixing ratios measured by SAM QMS
in the first 105 sols of the mission. The SAM QMS atmospheric measurements were taken periodically, with a cumulative coverage of 4 or 5 experiments per season on Mars. Major observations include the seasonal cycle of CO2, N2, and Ar, which lags approximately 20-40°
of LS behind the pressure cycle driven by CO2 condensation and sublimation from the winter
poles. This seasonal cycle indicates that transport occurs on faster timescales than mixing. The mixing ratio of O2 shows significant seasonal and interannual variability, suggesting an
unknown atmospheric or surface process at work. The O2 measurements are compared to
several parameters, including dust optical depth and trace CH4 measurements by Curiosity.
We derive annual mean volume mixing ratios for the atmosphere in Gale Crater: CO2 = 0.951
(± 0.003), N2 = 0.0259 (±0.0006), 40Ar = 0.0194 (±0.0004), O2 = 1.61 (±0.09) x 10-3, and
CO = 5.8 (± 0.8) x 10-4.
Index terms: 6225 Mars, 5445 Meteorology, 0368 Troposphere: constituent transport and
Accected
Article
Plain Language Summary
The atmosphere of Mars is made up of primarily carbon dioxide, and during the martian year the barometric pressure is known to cycle up and down substantially as this carbon dioxide freezes out and then is re-released from polar caps. The Mars Science Laboratory Curiosity rover has now acquired atmospheric composition measurements at the ground over multiple years, capturing the variations in the major gases over several seasonal cycles for the first time. With the Sample Analysis at Mars instrument, the annual average composition in Gale Crater was measured as 95.1% carbon dioxide, 2.59% nitrogen, 1.94% argon, 0.161% oxygen, and 0.058% carbon monoxide. However, the abundances of some of these gases were observed to vary up to 40% throughout the year due to the seasonal cycle. Nitrogen and argon follow the pressure changes, but with a delay, indicating that transport of the
atmosphere from pole to pole occurs on faster timescales than mixing of the components. Oxygen has been observed to show significant seasonal and year-to-year variability, suggesting an unknown atmospheric or surface process at work. These data can be used to better understand how the surface and atmosphere interact as we search for signs of habitability.
Accected
Article
1. Introduction
The present-day 25.2° axial tilt or obliquity of Mars is similar to the Earth’s 23.5°, resulting in seasonal changes as on Earth. However, each season on Mars is nearly twice as long as on Earth due to Mars’ longer orbital period of 687 days compared to the Earth 365 days, and the more elliptical orbit of Mars strongly affects the seasonal variation as compared to Earth. The seasonal change in Mars’ meteorological parameters has been monitored by a number of spacecraft, beginning with the Viking Landers (VL1 and VL2) in 1976 and continuing to this day on the Curiosity rover. As a result, a long time record of the surface pressure and
temperature has become available, largely from VL1 and VL2 from MY 12 to MY 15 at their respective landing sites of 22.4°Nand 47.9°N, MER-A (Spirit) and MER-B (Opportunity) from MY 26 to MY 33 at 14.6°S and 1.9°S, and now Curiosity at Gale Crater from MY 31 to present at 4.6°S. Other environmental properties, including aerosol opacity, UV flux, relative humidity and water vapor content, are also being measured on the Curiosity rover [Martínez
et al., 2017]. These parameters are valuable for interpreting the observations of seasonal,
temporal or sporadic changes in other atmospheric properties such as the abundances of atmospheric volatiles, which is the focus of this paper.
Prior to Curiosity, little information was available on long-term trends in the behavior of the atmospheric constituents. While the GCMS on the Viking Landers measured the bulk volume mixing ratios (VMR) of the main atmospheric constituents CO2, N2, and 40Ar (95.3%, 2.7%,
1.6%, respectively), O2 and CO had large uncertainties [Owen, 1992; Owen et al., 1977;
Oyama and Berdahl, 1977]. No useful information about their temporal or seasonal change
could be derived from those data, however. On the other hand, the seasonal change in surface pressure measured by Viking was instrumental in understanding the unique annual cycle of condensation and sublimation of atmospheric carbon dioxide to and from the poles of Mars [Hess et al., 1980; James et al., 1992]. As CO2 is the principal component of the atmosphere,
and the other two gases N2 and Ar are not condensable at martian temperatures and pressures,
the observed change in the surface pressure can be attributed to seasonal change in the atmospheric CO2 content. Those data also revealed a time lag between the onset of CO2
deposition/sublimation and the resulting surface pressure change, which is related to the dynamics of CO2 migration to and from the poles.
Seasonal variation of the second most abundant gas on Mars, N2, could not be studied in situ
or by remote sensing before Curiosity. However, the next most abundant constituent, radiogenic argon (40Ar, referred to generally as Ar) was measured over several years in situ
Accected
Article
by the APXS instrument on MER [VanBommel et al., 2018] and by remote sensing using the Gamma Subsystem of the Gamma Ray Spectrometer on Mars Odyssey orbiter [Sprague et
al., 2012]. The MER data correspond to the equatorial region, where the VMR of Ar was
found to have a relatively small seasonal variation of 10%. The Mars Odyssey data lacked the precision for such small changes in Ar in the equatorial region, but revealed a dramatic change in Ar over the poles. The Ar mixing ratio was found to increase by a factor of six over the southern pole in winter, and by a factor of 3 over the northern pole in winter. As argon is a non-condensable gas, its total atmospheric content remains unchanged through the martian seasons. The observed seasonal variation in its mixing ratio is therefore due to the dynamical processes induced by the deposition and sublimation of the principal atmospheric constituent, CO2, at the poles.
Like N2 and Ar, O2 and CO are long-lived constituents on Mars, with lifetimes greater than
the year on Mars [Atreya and Gu, 1995; Krasnopolsky, 1993; Wong et al., 2003]. Besides aforementioned Viking measurements, only a few sporadic ground-based measurements of O2 were available pre-Curiosity. However, an extensive set of data on CO has been collected
between MY 28 and MY 33 by CRISM on MRO [Smith et al., 2017]. The CO VMR’s from those orbital observations are found to be generally slightly larger than the values obtained from the Earth or from Mars Express observations for corresponding regions [e.g., Billebaud
et al., 2009; Encrenaz et al., 2006; Krasnopolsky, 2015].
The SAM results discussed in this paper provide the first simultaneous measurements in the equatorial region of all key constituents. Including CO2, N2, Ar, O2, and CO, these
measurements were made over nearly six years using the same mass spectrometer of the SAM instrument suite. Additionally, methane has been measured over the same period with the tunable laser spectrometer (TLS) of the SAM suite. Mars is found to have a persistent low background level of methane (CH4) with a mean value of 0.41 ± 0.16 ppbv, but it undergoes
an unexpected seasonal variation of a factor of ~3 from 0.24 to 0.65 ppbv. The observed variation is unrelated to any known environmental factors, which can account for only about ±20% seasonal change in CH4. The magnitude of the seasonal change in the CH4 background
is much greater than in other long-lived atmospheric volatiles (N2, Ar, O2, CO) discussed in
this paper. The TLS results on the methane background and occasional spikes have been published elsewhere [Webster et al., 2015; Webster et al., 2018].
Accected
Article
2. Methods
2.1 SAM QMS measurements
We report here on measurements of atmospheric volume mixing ratios on Mars using the SAM QMS onboard the Mars Science Laboratory Curiosity rover, taken in Gale Crater (4.5°S, 137°E) over a period of almost 3 Mars years (> 5 Earth years) from landing [Vasavada et al., 2014]. Although Gale Crater is located just south of the equator, in this paper the seasons will be referenced with respect to the northern hemisphere. The observation period spans the northern summer of MY 31, solar longitude (LS) of 175°, through northern
spring of MY 34, LS = 85°. During the measurement timeframe Curiosity traversed a distance
of over 16 km in Gale Crater, spanning elevations from -20 to +329 m relative to the landing site (-4501 m). The SAM QMS atmospheric measurements were taken periodically during this time, interspersed between solid sample measurements and other rover activities, with a cumulative coverage of 4 or 5 experiments per season (Fig. 1).
Atmospheric mixing ratios measured by the SAM QMS were reported for the first 105 sols of the mission [Mahaffy et al., 2013]. These were recently updated to account for newly
developed calibration factors following in situ calibration experiments using SAM’s onboard calibration cell [Franz et al., 2017]. Periodic sampling has continued throughout the mission to explore variations related to the seasonal CO2 cycle, as indicated by the annual pressure
curves (Fig. 1). The SAM atmospheric measurements taken through MY 34 LS 85° overlap
seasonally with the first reported measurements in MY 31, testing whether there is a
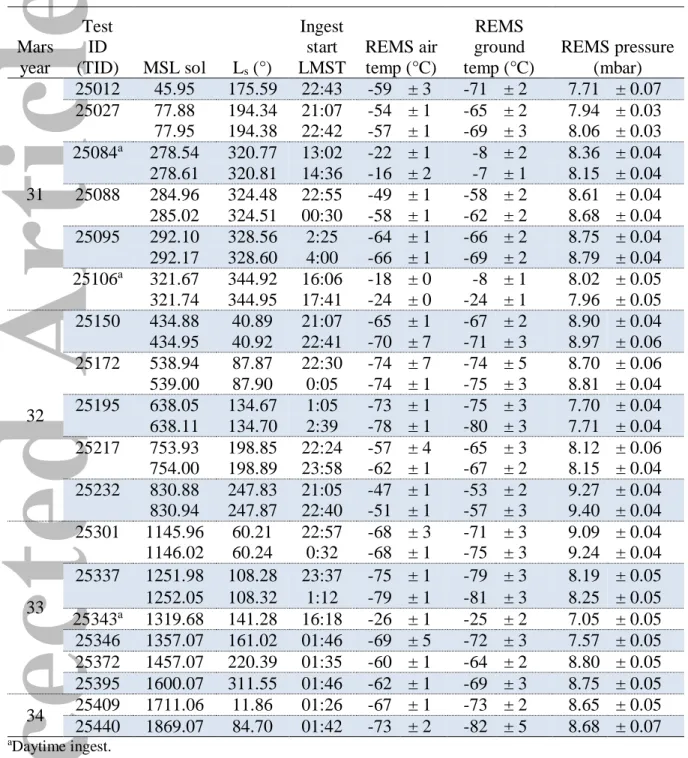
repeatable annual cycle in the atmospheric composition. With the exception of three daytime runs, atmospheric ingestions were taken near local midnight (Table 1).
Following the acquisition of the atmospheric dataset presented in this manuscript, the SAM instrument completed its first full derivatization experiment on the Ogunquit Beach (OG) dune sample [Malespin et al., 2018]. High signal levels in the wet chemistry experiment on sol 1909 (December, 2017) caused a shift in the sensitivity of the instrument detectors,
requiring a change in the QMS electron multiplier gain setting. The gain state change restored QMS count rates to their previous levels, but detailed analysis is ongoing to ensure that deadtime corrections and calibration constants for all species are adjusted. Thus, this report is restricted in scope to atmospheric measurements prior to sol 1909.
Accected
Article
2.1.1 Experimental details and calibration
The SAM instrument suite consists of three instruments supported by a gas separation and processing subsystem and a solid sample manipulation system [Mahaffy et al., 2012]. Results presented here were obtained with the QMS through a dedicated heated (50°C) atmospheric inlet. The QMS employs hyperbolic rods, redundant 70-eV electron beam energy ion sources, and redundant pulse counting Channeltron detectors. Separate miniaturized turbomolecular pumps (compression ratio ~5x10⁸) evacuate the small QMS sensor volume and the much larger inlet manifold volume prior to martian atmosphere ingestion.
Experiments include two background scans: one with the QMS sensor volume isolated from the manifold, and one with the QMS open to the evacuated manifold. The QMS is operated in a dynamic sampling mode with continuous pumping by one of the turbomolecular pumps. An atmospheric sample is acquired by opening a valve on the sample inlet tube for ~30 seconds to introduce gas to a portion of the manifold. A small fraction of this gas is then leaked into the QMS and scanned over a specified mass range (1.5 - 149.9 Da) for several minutes. This process is repeated for most runs to provide two ingestions per experiment (Table 1).
Detailed descriptions of the experimental design and flight instrument calibration for the atmospheric investigation can be found in Franz et al. [2014].
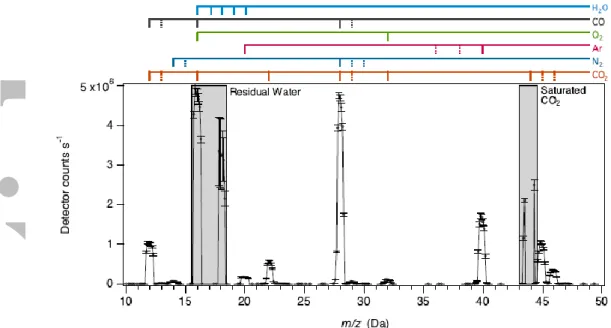
Direct atmospheric QMS data were acquired in both a fractional-scan mode with 0.1-Da step size and a unit scan mode with 1.0-Da step size. A typical fractional-scan spectrum acquired during an atmospheric experiment is shown in Figure 2. Fractional-scan mode reduces uncertainties related to the tuning and shape of spectral peaks, while unit-scan mode reduces uncertainties due to time variation in the signal (as both background and sample are pumped out). Repeated experiments have shown that sample and background signals are
well-characterized by exponential functions of time, so best results are determined through processing of data acquired in fractional-scan mode [Franz et al., 2015; Franz et al., 2014]. The method involves correcting mass spectra for detector dead time effects at high count rates and integrating peak areas (± 0.4 Da) for the m/z values of the major atmospheric components, CO2, Ar, N2, O2 and CO.
Data corrections are needed to account for isobaric interference (multiple species contributing to count rates at a single m/z value) and for pressure-related variation in CO2 splitting
fractions (ratios between yields of products such as CO2+, CO2++, and O2+ upon ionization of
atmospheric CO2 molecules). As described in Franz et al. [2015], calibration experiments on
Accected
Article
pressure in the ratio of doubly- to singly-ionized CO2. The high abundance of CO2 in
atmospheric samples leads to saturation at m/z 44 (Fig. 2), so we rely on the CO2++ signal at
m/z 22 as the reference marker for mixing ratio measurements. We adjust for the pressure
dependence of the CO2++/CO2+ splitting fraction using empirical corrections from Franz et al.
[2015]:
m22corr = F22 m22obs, (1)
where the correction factor is a linear function of the uncorrected count ratio at m/z 22:
F22 = a m22obs + b, (2)
with coefficients a = –2.321 (± 0.1094) x 10-7 cps-1 and b = 1.000 ± 0.003. To isolate the
signal at m/z 32 due to atmospheric O2 (m32corr) from the observed signal at m/z 32 (m32obs),
we apply an assumption that the O2+/CO2+ splitting fraction is pressure-invariant. For the
atmospheric data in which the m44 peak is saturated, the correction is applied as follows:
m32corr = m32obs – c (m44/m22)CO2 m22corr, (3)
where c = 4.558 (± 0.07104) x 10-4 and (m44/m22)CO2 = 145.88 ± 1.17 as in Tables 1 and 2,
respectively, in Franz et al. [2015].
Overall sources of error in the mixing ratio calculation include (i) measurement noise (detector noise following Poisson counting statistics), (ii) errors in the data corrections
(detector dead time, background subtractions, isobaric interferences), and (iii) uncertainties in the calibration constants. Some of these errors can be reduced by averaging data points within individual experiments and by averaging multiple experiments (i.e., measurement noise and background subtractions), while other sources are systematic and are not reduced by
averaging multiple experiments together (i.e., calibration constants and corrections for
deadtime and isobaric interference). Discussions of these sources of error and their estimation are included in Franz et al. [2014] and in the supplemental material of Wong et al. [2013a]. For the major atmospheric gases with multiple ion fragments measured by the QMS, the m/z values used for calculation of mixing ratios were selected to have large enough count rates to minimize detector noise, but low enough count rates to minimize saturation and deadtime effects. Although contributions of residual gas molecules to the background are minimal for most species, the background signal for the primary peak for O2 (m/z 32) is high and thus a
large proportion of the total signal. This is due to O2 permeation from the high conductance
Accected
Article
and manifold are actively evacuated. This background correction is therefore challenging and is a major source of uncertainty in the O2 mixing ratios measured by the SAM QMS (see §S3
of the Supporting Information).
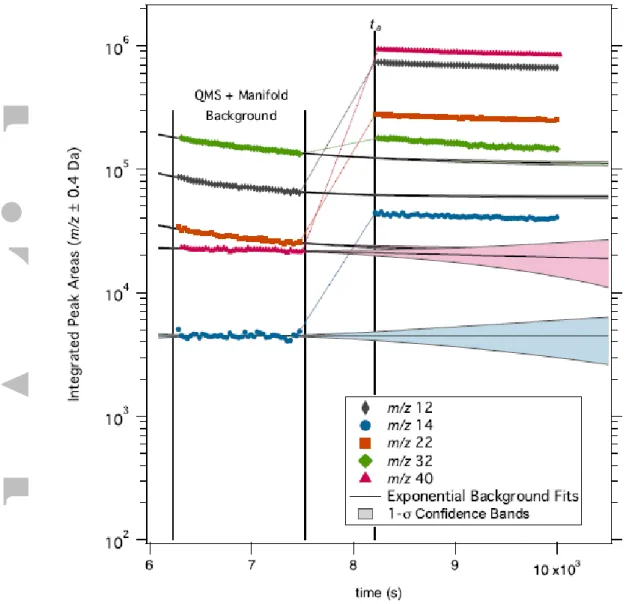
Figure 3 shows a typical experiment timeline with backgrounds and atmospheric samples for the primary atmospheric species of interest. The approach used for the background correction is to fit an exponential signal as a function of time to the data within the background interval (specifically, the background scan with the QMS exposed to the evacuated manifold), and extrapolating to the sample interval to determine the time-dependent background signal. This correction is small percentage of the total signal for four of the species under study, and thus introduces a minor uncertainty to the final mixing ratio. For the O2 peak at m/z 32 the
correction is a large proportion of the signal (≥ 50%), and varies between different
experiments and different ingested samples within each experiment. To accurately capture the inherent uncertainty in this correction in the O2 mixing ratio, the 1-σ confidence intervals
for the exponential fit at ta are included as part of the error estimation. Our uncertainty estimates include variations in the functional form of the background fit, in specific cases where the form of the fit significantly influenced the results.
As seen in Figure 3, the magnitude of the QMS signal for the atmospheric sample is also time-variable, as the sample trapped in the manifold is gradually pumped through the QMS. Ratios for the major ions of each gas are taken at each time point (i.e. from each mass spectrum) and then averaged to remove the time variability from the mixing ratio
determinations. Resulting ratios are constant across a sampling interval. Mixing ratios are then computed at each time point and averaged for each ingestion. For experiments with two atmospheric ingests, the resulting mixing ratios from each ingestion are combined into a weighted mean for the sol, reducing systematic errors due to the background corrections. The values reported in Table S1 are these weighted means.
Finally, for CO2, the calculated uncertainties in the reported mixing ratios in this manuscript
differ from those in the previous publications [Franz et al., 2017; Franz et al., 2015; Franz et
al., 2014; Mahaffy et al., 2013]. For this work, we are most interested in identifying seasonal
trends and therefore relative behavior of the measured mixing ratios throughout the mission. For CO2 in particular, the errors previously reported are largely introduced by the uncertainty
in the calibration constant derived during the pre-launch calibration. This constant introduces an uncertainty on the CO2 VMR on the order of 3%. This uncertainty would apply to the
Accected
Article
optimal for characterizing the VMR. The uncertainty on the relative abundance of CO2 is best
modeled by assuming that the total atmospheric composition must be equal to 1, and thus the uncertainty on the CO2 is equal to the total uncertainties on the trace gases (Ar, N2, O2, and
CO, added in quadrature) that comprise the balance of the atmosphere.
2.2 Supporting Curiosity Measurements
2.2.1 Rover Environmental Monitoring Station
Throughout the mission, meteorological conditions along the traverse in Gale crater have been measured by the Rover Environmental Monitoring Station (REMS) sensor suite [Gómez-Elvira et al., 2012]. The REMS suite performs measurements of atmospheric
pressure, ground and atmospheric temperatures, atmospheric relative humidity, UV radiation fluxes, and horizontal wind speeds [e.g., Martínez et al., 2017]. To provide context for the SAM VMR measurements and the seasonal behavior of the major gases, we focus primarily on the analysis of REMS pressure (P) and atmospheric temperature (T) measurements. Comparisons to other environmental conditions, including those measured by REMS, are discussed below in §4.2, with more detail in the Supporting Information (§S7).
The pressure and temperature conditions at the time of sample ingestion for each QMS experiment are provided in Table 1. Conditions were calculated as described in Wong et al. [2013b]. Uncertainties include estimated extrapolation uncertainties at times when
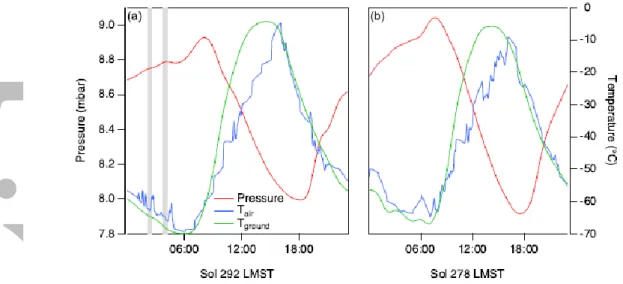
simultaneous REMS measurements are not available, variation over the duration of the ingest event, and instrumental uncertainties. Updated instrumental uncertainty values correspond to the 9th PDS data release. Ingest start times are rounded to the nearest minute, in local mean solar time (LMST). As indicated in the table, the majority of the atmospheric samples were acquired near midnight (LMST). Three experiments were conducted in the mid- to late-afternoon, two of these in close proximity to nighttime experiments (within 10 sols). Figure 4 shows the daily temperature and pressure curves for two of the sols in which the QMS
sampled, 292 and 278, acquired during northern winter/southern summer. The vertical gray bars indicate the times of the QMS sample ingestions, showing a typical nighttime
experiment and one of the daytime experiments. The search for possible diurnal trends was of interest in part because of the large diurnal pressure variations observed in Gale Crater, driven by a combination of thermal tides and topographical effects. Haberle et al. [2014] discussed this in their interpretation of the pressure cycles over the first 100 sols on Mars, concluding that in addition to the global thermal tides in the atmosphere from solar heating,
Accected
Article
the diurnal cycle of upslope/downslope flows driving crater circulation likely have a significant effect on the pressure amplitudes, with implications for the mixing of air in the bottom of the crater with air on the surrounding plateau [see also Rafkin et al., 2014; Tyler
and Barnes, 2013]. The planetary boundary layer (PBL) in Gale Crater may be particularly
suppressed in comparison with other locations on Mars, with significant impact on the observations of trace gases made by MSL/SAM [Moores et al., 2019; Newman et al., 2017;
Rafkin et al., 2016].
2.2.2 ChemCam Passive Sky Observations
Although the MSL ChemCam Spectrometer was designed primarily for laser-induced
breakdown spectroscopy (LIBS) of Martian surface materials [Maurice et al., 2012; Wiens et
al., 2012], it can also operate in “passive” mode to observe solar radiation scattered by the
surface and atmosphere. The ChemCam passive mode was initially used only for reflectance spectroscopy of surface materials [Johnson et al., 2015]. However, routine ChemCam passive sky spectroscopy started on sol 230 and McConnochie et al. [2017a] have used these
observations to derive aerosol properties and water vapor column abundances using the instrument’s visible and near-infrared (VNIR) spectral band. ChemCam also observes O2
absorption near 762 nm [McConnochie et al., 2017a], and preliminary results [McConnochie
et al., 2017b] indicate that this can be used to derive quantitative O2 column abundances,
pending further work to better characterize measurement uncertainties. Because the ChemCam passive sky data are taken at a higher frequency and lower precision than the SAM QMS mixing ratios, they may be able to provide a complementary measurement to track the seasonal behavior of molecular oxygen in and above Gale Crater. Future reports from the ChemCam passive sky measurements may prove valuable for the interpretation of the SAM O2 mixing ratios.
3. Results: In situ Volume Mixing Ratios
3.1 Carbon dioxide (CO2)
Carbon dioxide is the primary component of the martian atmosphere, with large seasonal variations in the global surface density due to the condensation and sublimation of CO2 in the
polar regions during winter and spring, respectively. This was first observed by the Viking landers through global fluctuations of about 30% in surface pressure [e.g., Tillman et al., 1993]. Curiosity pressure measurements to date have shown this cycle as well [Haberle et al., 2014; Harri et al., 2014]. The Curiosity landing and science investigations commenced
Accected
Article
shortly after the annual pressure minimum, which corresponds with the formation of the larger southern polar cap (Fig. 1). During the first 200 sols of the mission, the average surface pressure rose steadily to the annual maximum during northern fall, shortly after perihelion. The pressure then decreased to a local minimum near MSL sol 470 during the formation of the north polar cap, which begins to sublime again during northern spring. The pressure was observed to decrease again as the southern seasonal polar cap was formed, repeating the annual cycle as observed in Gale Crater. SAM QMS measurements after MSL sol 680 have been timed to check for interannual repeatability and to achieve reasonable coverage over the pressure curve.
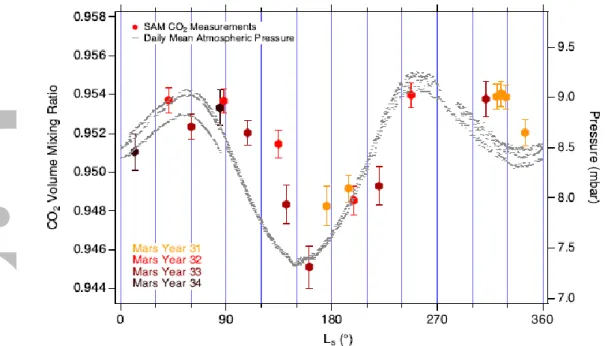
The SAM measurements are the first comprehensive compositional measurements of the atmosphere taken at intervals throughout Mars’ CO2 cycle. Figure 5 shows the local VMR
values determined through MSL sol 1869 (MY 34, LS 85°) as a function of solar longitude,
with the daily average pressure included for comparison to the global cycle. Tabulated data are given in the Supporting Information, Table S1 and are publicly available [Trainer, 2019a; b]. Although there are large fluctuations in CO2 VMR driven by seasonal and diurnal cycles,
CO2 is so dominant that the volume mixing ratio only varies by 1% about a computed
average mixing ratio of 0.951 ± 0.003.
The small seasonal perturbation (~ 1%) in the measured VMR is related to, but does not strictly follow, the surface pressure cycle. The decrease of the relative amount of CO2 in the
atmosphere shows a lag behind the decrease of the average surface pressure by roughly 20-40° of LS during the northern summer as the pressure approaches the annual minimum. The
data are sparser during the northern winter, but a similar lag is also indicated as the pressure approaches the seasonal minimum. The hemisphere-to-hemisphere redistribution of mass that occurs during these periods of cap sublimation and condensation pulls atmospheric
components toward the winter pole. Transport acts very rapidly to maintain pressure equilibrium, but changes in VMRs lag behind because physical mixing of airmasses is a slower process.
To better characterize the mixing process, we introduce an annual-mean VMR (VMR') that differs from the instantaneously measured VMR by a simple correction factor. The simplest scenario (although inaccurate because the mixing timescale is not as fast as the transport timescale) is that composition and total pressure at a specific location on Mars adjust
Accected
Article
gas phase. If this simple scenario held, then composition and total pressure could be related by the equation
Patm(t) = ∑Pi + PCO2(t) = ∑Pi + PCO2(avg) + dPCO2(t), (4)
where Patm(t) is the total atmospheric pressure as a function of time of year; Pi are the partial pressures of the long-lived, non-condensable species; PCO2(avg) is the average annual partial
pressure of CO2; and dPCO2(t) is the variation in the partial pressure of CO2 as a function of
the time of year. The total average annual pressure of the atmosphere (Patm(avg)) is then the
sum of the partial pressures of the total non-condensable species and PCO2(avg). The value of
Patm(avg) for Gale Crater was determined by fitting multi-year daily mean pressure
measurements from the REMS data, binned by integer LS values to provide a
seasonally-averaged pressure. The average pressure computed in this way is 8.46 mbar. The average CO2 VMR is used to determine the values for PCO2(avg) = 8.05 mbar and ∑Pi = 0.41 mbar. The Patm(t) term was fit to a polynomial and a correction factor (FP) developed to allow the measured VMR values for the non-condensable species to be adjusted to the annual average volume mixing ratio, VMR':
VMR' = FP •VMR (5).
The details of the pressure fit, this calculation, and the derived Fp values are provided in Supporting Information, §S2.
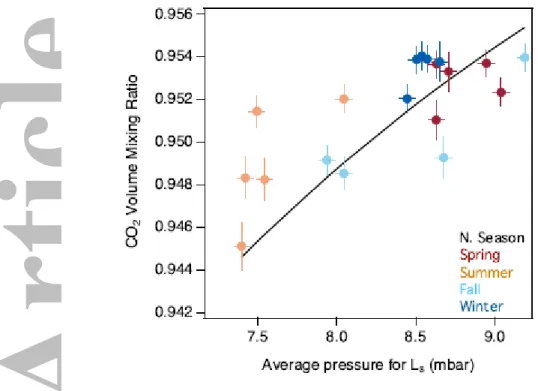
Similarly, in the (unrealistic) fast-mixing case, PCO2(t) and Patm(t) should be linearly related.
This scenario is plotted as VMR vs. Patm in Figure 6, where the expected relationship is
represented by the black curve, and measured values are shown with symbols. The expected value for the CO2 mixing ratio was calculated by subtracting ∑Pi = 0.41 mbar from the daily mean pressure at the same LS of the measurement, and dividing by the Patm(t) to get the
mixing ratio (Eq. 4).The SAM CO2 VMR data show a deviation from this relation, in
particular the seasons containing the pressure minima (N. summer and winter) show consistent enhancements above the fast-mixing relation. In the periods during which the seasonal caps are subliming, the measured CO2 mixing ratio is more likely to match or run
below the fast-mixing relation, as can also be seen in Figure 5. By comparing the actual data with the fast-mixing relation in Figure 6, we calculate a correlation coefficient of R2 = 0.36. This poor correlation indicates that the fast-mixing model does not adequately match the observations.
Accected
Article
The seasonal fluctuations of the atmospheric pressure, and the influences of dynamics on the atmospheric composition at this location on Mars, are more easily identified and understood by studying the behavior of the trace, non-condensable components, which are more sensitive to the changes in global pressure. These are discussed in the next section.
3.2 Non-condensable atmospheric components
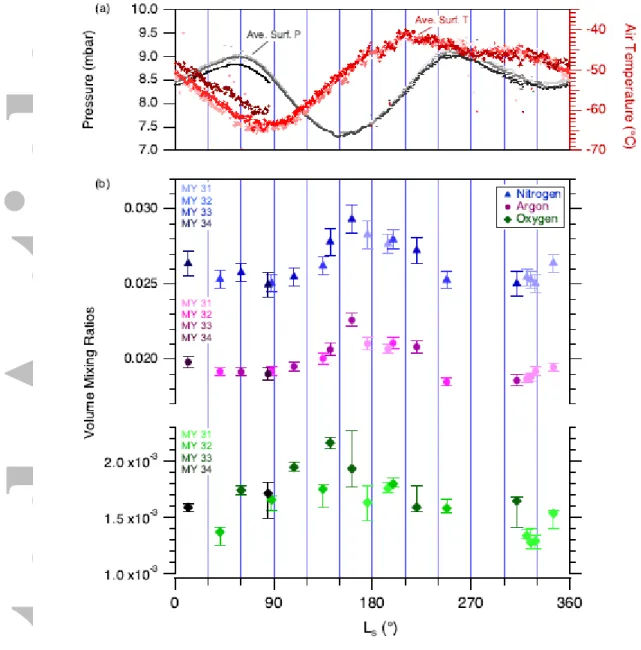
The mixing ratios of argon (40Ar), nitrogen (N2), and oxygen (O2) are shown in Figure 7, and
carbon monoxide (CO) is shown in Figure 8. These next four most abundant species are not condensable at Mars surface and atmospheric temperatures and pressures, and thus are not expected to deposit or sublime from the polar caps as does CO2. However, there are seasonal
trends in the VMR of these molecules that are a response to mixing of airmasses during the seasonal CO2 cycle, and unexplained additional processes affecting O2 and CO.
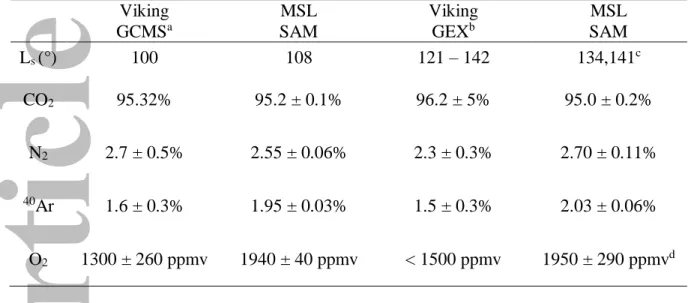
For reference, Table 2 provides instantaneous volume mixing ratios for these gases measured by MSL/SAM at approximately the same time of the Mars year as the Viking landers. The previous in situ measurements were not operational for the full Mars seasonal cycle.
3.2.1 Argon and Nitrogen
Argon and nitrogen serve as excellent tracers of global transport, since they are chemically inert in addition to remaining solely in the gas phase. Figure 7b shows that, as expected, these two species track each other consistently through the Mars year, with good year-to-year repeatability. Instantaneous composition is plotted (i.e., VMR as opposed to VMR'). Pressure maxima occur near LS 60° and 250°, after the seasonal northern and southern polar caps
(respectively) have sublimated. Minima in Ar and N2 VMRs lag behind these pressure
maxima by ~30° LS, suggesting a slower mixing timescale (although the timing of the
northern winter minima in Ar and N2 VMRs are poorly constrained by the SAM QMS data;
we assume the minimum is at LS 280°). The lag between pressure minima and VMR maxima
(~15° LS) is much smaller than the lag between pressure maxima and VMR minima (~30°
LS), but note that VMR' is better suited to compare global transport and mixing timescales.
The VMR’ data are provided in Figure 11 with a detailed discussion in §4.1.
The four right-most points in Figure 7b for both Ar and N2 show the time period in MY 31
during which daytime and nighttime measurements were taken within close proximity. From left to right, this group of points represents: day – night – night – day (Table 1). Although there appears to be a change in the mixing ratio among these points, there does not appear an obvious correlation with time of day.
Accected
Article
N2 and 40Ar have mean mixing ratios of approximately 2.6% and 1.9%, respectively, with a
seasonal variation of ± 10% of these values throughout the year (Table 3). Note that the temporal average reported here is affected by limited number of samples (Fig. 1); we use a strict numerical average without regard to temporal coverage. The nitrogen mixing ratio has been increased substantially [Franz et al., 2017] from the originally published value in
Mahaffy et al. [2013], and is now consistent with the Viking values within the uncertainty of
those previous measurements. A detailed discussion of the updated calibration constants for the SAM QMS and the adjusted mixing ratios for the first sols of the SAM QMS
measurements is given in Franz et al. [2017], which included corrections based on a calibration cell experiment on Mars.
The 40Ar/14N ratio of the Mars atmosphere, in combination with 14N/15N, has been used as a
diagnostic tool for verifying the inclusion of trapped atmosphere in martian meteorites, as it has a unique signature as compared to Earth [Becker and Pepin, 1984]. This has been discussed previously in the context of the SAM 14N/15N measurements [Wong et al., 2013a], but the value has been updated with the new SAM calibration [Franz et al., 2017]. The
40Ar/14N ratio also serves as a useful metric by which to evaluate the robustness of the mixing
ratio measurements of these trace gases over time. The relative abundance of these two gases should remain constant, since neither is expected to react or condense, and their similar abundances ensure near-identical transport during the seasonal cycle on Mars. The 40Ar/14N measured by SAM throughout the mission is shown in Figure 9 as a function of MSL sol, and indeed shows multi-year consistency within measurement uncertainty, with an average value of 0.376 ± 0.008.
3.2.2 Oxygen
The measured mixing ratio of O2 has varied from approximately 1300 to 2200 ppmv during
MSL's first 1900 sols at Gale Crater (Fig. 7b). Two unexpected features of the seasonal behavior of O2 are immediately apparent when comparing to the other major inert species
(Fig. 7b). First, O2 does not follow the same general pattern as the Ar and N2, particularly
through the beginning of the year. Second, the O2 mixing ratio shows substantial interannual
variability. Both of these features are surprising, because the chemical lifetime of Martian atmospheric O2 is estimated to be ≥10 Earth years [Krasnopolsky, 2017]. Like Ar and N2, O2
does not condense under Mars atmospheric conditions, so the O2/40Ar ratio is expected to be
constant, as for the Ar and N2. Despite the larger uncertainties on the derived O2 mixing
Accected
Article
and the O2/40Ar ratio (Fig. 10): there is a gradual northern spring/summer increase in O2,
followed by a potentially rapid reset to a constant level over much of northern summer and fall (LS 160°–315°).
The spring/summer increase in O2 can only be characterized in a broad sense, due to the large
error bars and coarse sampling of the time series. If we make the simplest assumption, a linear change in VMR as a function of LS in the LS 0°–150° period, there is almost a factor of
three variation in rate of change in MY 32, MY 33, and MY 34 (from about 1.3 to 3.6 ppm/°LS; Fig. 7b). The VMR values plotted in the figure include the effects of both seasonal
CO2 condensation/sublimation and global mixing. By instead considering the O2/40Ar ratio
(Fig. 10), we can eliminate all changes due to condensation/sublimation and global mixing, and it becomes more reasonable to apply a constant rate of change to all three years of O2
observations. Any remaining changes in the O2/40Ar ratio indicate other factors controlling
the local mixing ratio of oxygen in Gale Crater besides the large scale global dynamics controlling transport during the seasonal cycle. We will discuss this result in more detail below in §4.2. A significant change is clear over the LS 0°–150° period, with a consistent rate
of 0.012–0.015% /° LS. The exact onset and end of the O2-increase season are not well
defined, and the data are not finely sampled enough to determine whether the increase is truly linear (or whether there is variation year to year).
The second O2 seasonal feature is that O2/40Ar mixing ratios (Fig. 10) are more or less
constant and identical in all Mars years, over the period of LS 160°–315°. During this part of
northern summer and fall, the O2/40Ar mixing ratio is identical to the annual mean of 0.083
(within uncertainties). It is important to note that the sparse temporal sampling of the data is not sufficient to precisely characterize the bounds of this constant period. However, MY 33 data on LS 141° and 161° show a rapid decrease of 20–25% in O2/40Ar. This is a remarkably
rapid change, potentially giving insight into the processes modifying atmospheric O2
abundances, though we note that the rapid decrease was only observed during MY 33. Finally, interannual variation is clearly apparent from offsets between measurements in the spring/summer season of increasing O2/40Ar mixing ratio. Full characterization of the
interannual variation is not possible given the sparse temporal sampling, but the onset of the variable period seems to be sometime later than LS 270°, and sometime earlier than LS 30°.
We investigated the possibility of instrument effects or other measurement artifacts affecting the retrieval of the O2 mixing ratio and thus contributing to the apparent variability. As noted
Accected
Article
in §2.1.1, the O2 mixing ratio is computed based on the signal at m/z 32, which has both a
high background signal and a contribution from the fragmentation of CO2+. The backgrounds
and corrections have been tracked through the course of the mission and we have found no correlation with the increases in both absolute and relative O2 mixing ratios. Further, the O2
measurements were checked against the solid sample analyses to determine whether there could be contamination from a pyrolysis experiment. There was no unique correspondence between solid samples with O2 release and large increases in the atmospheric O2 mixing ratio
or background measurement (Fig. S4).
3.2.3 Carbon Monoxide
Carbon monoxide (CO) has been detected and is quantified as reported in Franz et al. [2017; 2015]. As discussed in those publications and in Mahaffy et al. [2013], the quantification of CO relies on a marginal detection above the dominant CO2 component, which generates CO+
and other interfering fragments in the QMS. Even when the CO abundance was measured at a relatively high value (i.e., near LS 180°, TID 25012), the signal at m/z 12 is estimated to be
comprised of 15% directly ionized CO and 85% from CO2 fragmenting into CO+. The
derived CO mixing ratios for the first part of the mission are given in Figure 8. It can be seen that this species approximately tracks the seasonal trend in argon, behaving much like a passive tracer species through the atmosphere. This is generally what is assumed in photochemical models, although there has been some observational variability that has challenged this assumption [see discussion in Krasnopolsky, 2015]. Smith et al. [2017] recently published CRISM column observations of CO for MY 28 through MY 33, therefore overlapping in the time period of the reported MSL measurements. The CO derived from CRISM data for the latitude band at 0 - 20° S shows a similar trend, with a minimum at LS
90° and a subsequent rise to a peak value just before LS 180°. The absolute value of the
mixing ratio measured by SAM ranges from 400 ppm to 800 ppm during this period, which is slightly lower than the 700 – 1000 ppm reported by CRISM for this region on Mars. Other orbital and ground-based measurements also report greater CO mixing ratios than the in situ values [Billebaud et al., 2009; Encrenaz et al., 2006; Hartogh et al., 2010a; Krasnopolsky, 2003; 2015; Sindoni et al., 2011; Smith et al., 2009]. There are several possible explanations for any discrepancy between the surface and the orbital and ground-based observations, including the difference in spatial sampling, the effect of any local depletions in Gale Crater, errors in the SAM CO measurement, and the distinction between a point and
Accected
Article
Although we have measured the CO in each atmospheric experiment through MSL sol 1711, measurements after sol 1000 show significantly elevated signal at m/z 12 and therefore very high CO mixing ratios. The VMR for CO obtained on in MY 32, near LS 250° (MSL sol 830,
TID 25232, Tables 1 and S1) shows the onset of this trend, in which the CO begins to diverge from the repeated seasonal trend in Ar (Fig. 8). In addition to the derived CO mixing ratio more than doubling from MY 32 to MY 33, the elevated measurements have not decreased or shown any seasonal modulation in MY 33 and 34, in contrast to the O2 measurement. This
behavior is suspect, and at this time a possible contamination or instrument effect cannot be ruled out. Especially because we know the m/z 12 signal to be highly sensitive to such effects [Franz et al., 2015], we are cautiously omitting the questionable observations from this paper. Those CO measurements thus require further investigation and will be reported at a later time.
4. Discussion
4.1 Seasonal Transport
Argon and nitrogen in the Mars atmosphere have extremely long lifetimes (~Gyr) against losses from photochemistry, sputtering and escape, and they do not condense under any of the conditions reached during the current seasonal cycle. Condensation points at Mars ambient pressures are ~ 63K and 53K for Ar and N2, respectively. Thus, these gases serve as excellent
tracers of the complicated dynamics induced by the cycling of CO2 into and out of the polar
caps on yearly timescales. Measurements of Ar from orbit using Gamma Subsystem (GS) of the Gamma Ray Spectrometer (GRS) on the Mars Odyssey spacecraft first identified a “freeze-distillation” effect, in which Ar (and other non-condensables) are carried to the polar regions by advection of the bulk atmosphere during autumn and winter when CO2 freezes out
on the polar cap [Sprague et al., 2007]. The GRS measurements provide a column-averaged mean mixing ratio (mmr) of Ar relative to the total atmospheric gas, and show an enrichment of up to 6x at the southern winter pole and 3x at the northern winter pole [Lian et al., 2012;
Sprague et al., 2012]. However, the orbital measurements of Ar at the lower latitudes have
too much scatter to detect what could be seasonal variations of a smaller magnitude [Sprague
et al., 2012].
Recently published work from the Alpha Particle X-ray Spectrometer (APXS) on the Mars Exploration Rover Opportunity (MER-B) has reported on relative atmospheric argon density over six years of observation from ~2°S, a similar latitude as MSL [VanBommel et al., 2018]. The MER-B measurements, from Mars years 28 – 33, provide normalized argon mixing
Accected
Article
ratios that show a seasonal variation of up to 15% from LS 0°, which is comparable in
magnitude to the observed variation in absolute mixing ratios measured by SAM, with broadly similar seasonal trends. More detailed analysis, beyond the scope of this paper, will be needed to assess the statistical and physical significance of the modest differences between SAM vs. APXS. Note however that the spatial separation of MER-B and MSL and the much larger volume of atmosphere sampled by the APXS detection method could contribute to such differences due to the significance of atmospheric dynamics in mixing ratio trends. With SAM QMS measurements, we have the first data set of compositional measurements near the equator of all the major species, thus painting a more complete picture of the
behavior of Mars’ atmosphere throughout the seasonal cycle. The instantaneous mixing ratio data presented in Figure 7 and Table S1 were subsequently adjusted for the annual global pressure cycle, using the method described in §3.1. We used Equation 5 to correct the in situ values to produce global mean annual mixing ratios (VMR’, Fig. S5). If the atmospheric gases were perfectly globally mixed and transport effects on trace species were negligible at this low latitude, the amount of Ar and N2 would show a constant value once the pressure
variation was removed. In other words, the Ar and N2 VMR' values in Gale Crater would
remain constant with time, if atmospheric transport and mixing timescales were identical. The corrected mixing values (Fig. 11) show where there are clear deviations to such behavior, because the transport (traced by adjustment of atmospheric pressure due to polar CO2
condensation/sublimation) is faster than mixing (traced by adjustment of composition). Global mean values were calculated from the Ar and N2 VMR’ (0.0194 and 0.0259,
respectively), about which the individual mixing ratios are plotted. In this manner, the two atmospheric components can be plotted on the same axis, highlighting deviations from the average value as a function of LS. The data indicate that the minimum in Ar and N2 VMR’ in
N. spring/summer lags behind the pressure maximum by approximately 78 of LS, and
similarly the maximum in Ar and N2 in N. summer/fall follows the pressure minimum by 67
of LS, due to delay in mixing.
The corrected mixing ratios indicate mixing of airmasses of distinct composition, moving through the equator during the seasonal cycle. At the south pole, maximum enrichment of Ar observed at the southern pole by the GRS [Sprague et al., 2012] occurs near LS 120°, an
effect of “freeze distillation” of trace gases occurring at the pole during the local winter [Lian
et al., 2012]. Although pressure at all latitudes adjusts relatively rapidly to polar
Accected
Article
southern polar vortex until it mixes with higher latitude air in southern spring, pushed by the large amounts of CO2 subliming off the cap. Repeating cycles of enrichment and depletion of
Ar and N2 are observed at Gale Crater as the composition mixes between low-latitude
airmasses and seasonally-varying polar airmasses. It should be noted that the orbital GRS measurements of Ar at low latitudes (where both Opportunity and Curiosity sit), and even in north polar regions, are dominated by scatter and the variations described here are not resolvable.
Differences in the timescales for atmospheric transport and mixing are emphasized by plotting global mean values (VMR'; Fig. 11) using the pressure correction described above, since VMR' should not change if transport and mixing timescales are identical. We use pressure corrected VMR' data to compute mean annual mixing ratios (Table 3), but as indicated by the residuals plotted in Fig. S5, uncertainties in the global average are affected more by seasonal variation than by instrumental uncertainties. In Figure 12 we plot the instantaneous VMR of Ar and N2 on top of a modeled Ar mixing ratio in Gale Crater as
predicted by the Laboratoire de Météorologie Dynamique (LMD) Mars GCM (MGCM) with coupled photochemistry [Lefevre et al., 2004]. All are normalized to LS 345°, selected as one
of the SAM measurement points closest to LS 0° (360°). The MGCM prediction shows
generally good agreement with the measured mixing ratios for Ar and N2, with some
discrepancy between LS 90 – 180° when a lower mixing ratio is observed by SAM. The
discrepancy between the model and the data may reflect an inaccurate estimation of the local isolation in Gale Crater that limits mixing between the MSL measurement sites and the surrounding atmosphere [Pla-Garcia et al., 2016; Rafkin et al., 2016]. Thus, the SAM dataset provides unprecedented ground truth measurements of these tracers to aid in improving the representation of various processes within the martian climate system in global circulation models. This has significant implications for proper understanding of the water cycle, CH4
abundance and distribution [Webster et al., 2018], and possibly also the dust cycle on Mars [Lian et al., 2012].
MER-B used APXS data to measure seasonal trends in Ar mixing ratio at Meridiani Planum. General trends are very consistent with SAM results at Gale Crater (Fig. 7), but the cadence of the SAM data preclude a definitive observation of the argon “pulse” near LS 150° observed
in the APXS data [see Fig. 9 in VanBommel et al., 2018]. The SAM data are not inconsistent with a pulse, qualitatively; in particular in the pressure-corrected data (Fig. 11) there does appear to be a small increase in Ar around LS 150° that deviates from an apparent seasonal
Accected
Article
curve. Interestingly, LS 150° also corresponds to the timing of the transition between seasonal
periods of increasing O2 and constant O2 in the SAM dataset (§3.2.2).
4.1.1 Nitrogen cycle
Recent detections of nitrate in martian sediments have indicated the presence of nitrogen fixation cycles on Mars at least at one time in its history [Navarro-Gonzalez et al., 2019;
Stern et al., 2015; Stern et al., 2017]. Because nitrogen is an essential element for life,
nitrogen fixation is a critical process required to support habitable environments as we know them. If currently active, a large nitrogen flux into the regolith could potentially affect the abundance of atmospheric N2 over seasonal or long-term time scales. We explored whether
the available SAM atmospheric dataset could shed any light on whether there is a currently active nitrogen cycle. As on Earth, the primary reservoir of nitrogen is in the form of N2 in
the atmosphere. On Earth, nitrogen fixation proceeds abiotically and biologically, with the biological rate (1014 g N yr-1) occurring about 100 times higher than the abiotic rate triggered by lightning [Menge et al., 2013; Schumann and Huntrieser, 2007; Zehr et al., 2001].
Nitrogen-containing end products of biological processes are rapidly recycled back into the atmosphere at a rate such that the nitrogen budget on Earth appears to be in an approximate equilibrium. On Mars, nitrogen fixation could potentially occur both biologically [Klingler et
al., 1989] and abiotically [Navarro-Gonzalez et al., 2001; Navarro-Gonzalez et al., 1998; Segura and Navarro-Gonzalez, 2005]. Currently there exist no data capable of providing
evidence of biological activity on Mars. If reported CH4 detections [Formisano et al., 2004;
Mumma et al., 2009; Webster et al., 2013; Webster et al., 2015; Webster et al., 2018], were
assumed to be solely a result of active biological activity, an estimated biomass of ~109 g yr-1 would be required to maintain a CH4 concentration of 10 ppbv [Krasnopolsky et al., 2004]. A
methanogenic population of this size would be capable of a hypothetical biological nitrogen fixation rate of ~108 g N yr-1 [Frigstad et al., 2011; Leigh, 2000]. Conversely, photochemical
models predict an abiotic nitrogen fixation rate of ~109 g N yr-1 in the form of nitrates [Yung
et al., 1977]. Therefore, the abiotic rate in the current atmosphere would be expected to
exceed the hypothetical biological rate by at least an order of magnitude. The current annual flow of nitrogen from the atmosphere to the surface is negligible considering a repository in the atmosphere on the order of 1018 g N2.
Further, the abiotic denitrification of nitrates is a viable mechanism to recycle back surface nitrogen to the atmosphere, but the rate of this process is currently unknown. Therefore, it is
Accected
Article
concluded that current nitrogen cycle on Mars has no measurable impact on the atmospheric N2 mixing ratio and consequently implies nitrogen seasonal stability.
4.2 Oxygen
4.2.1 Interannual Variability
The 1300 – 2200 ppmv abundances of oxygen measured by SAM are generally in the same range as prior measurements that span different sets of in situ and remote sensing
observations of O2 in the upper atmosphere and at the surface of Mars. The repeated
measurements of SAM provide the most robust measurements to date, as the previously reported values have been made with substantial uncertainty and limited frequency, besides being in different regions of the atmosphere and the surface. From five sets of mass spectral measurements obtained within days of landing of Viking Lander 1 (VL1) on 20 July 1976,
Owen and Biemann [1976] reported an O2 mixing ratio in the 1000 – 4000 ppmv range.
Owen et al. [1977] subsequently concluded that the oxygen measurements had considerable
scatter of a factor of 2, which they attributed to instrumental causes. It seems likely, as
England and Hrubes [2004] suggest, that Owen et al. [1977] based the 1300 ppmv value for
O2 mixing ratio given in their Table 1 on measurements reported by Barker [1972] and
Carleton and Traub [1972], which were obtained with high-resolution 762 nm O2-band
spectroscopy from terrestrial observatories. (See also Trauger and Lunine [1983] who report a slightly lower value from ground-based spectroscopy: ~1200 ppm when scaled to 6 mbar surface pressure.) The Viking GEx experiment reported an upper limit of 1500 ppmv [Oyama
and Berdahl, 1977]. England and Hrubes [2004] calculated a seasonal variation in O2
between 2500 and 3300 ppmv, by inverse scaling of O2 to atmospheric pressure measured by
Viking. It is important to note that the reference O2 value they used in their scaling
calculation (3000 ppmv) is the value VL1 measured at 125 – 300 km, in the upper
atmosphere above the homopause [Nier and McElroy, 1977], which is not representative of O2 at the surface. Mars Express SPICAM observed 4000 ppmv O2 averaged over 90 – 130
km and six observations [Montmessin et al., 2017; Sandel et al., 2015]. Any seasonal or temporal variations in O2 at the surface are not expected to propagate to the upper
atmosphere. Recent measurements made through disk-averaged observations of Mars with the Herschel Space Observatory’s HIFI instrument retrieved a value of 1400 ± 120 ppmv, though they caution the reader the value may not be vertically uniform [Hartogh et al., 2010b]. This measurement was taken during MY 30, LS 77°. SAM measurements from
Accected
Article
surface from similar times of year are slightly higher, but with overlapping uncertainty (Table S1).
The SAM measurements of O2 in Gale crater do not show the annual stability or seasonal
patterns that would be predicted based on the known sources and sinks in the atmosphere. As mentioned in §3.2.2, based on known sources and sinks O2 should show the same seasonal
patterns and annual repeatability as Ar. Given the known chemical cycles, the formation of atmospheric O2 is controlled primarily by photochemistry of H2O and CO2 [e.g., Atreya and
Gu, 1994]:
CO2 + h CO + O R1
H2O + h H + OH R2
OH + O H + O2 R3
and, O + O + M O2 +M R4
where M is the background gas (CO2). The abundance is then controlled by the balance
between formation and loss through photolysis and formation of H2O2, HO2, and NO2
[Krasnopolsky, 1993].
To quantify the enrichment of observed O2 compared to what would be predicted, we account
for the changes in total number density, which are mainly due to pressure changes (Fig. 7a) caused by the global-scale CO2 condensation-sublimation cycle, as well as the expected
changes in the mixing ratios of all non-condensable gases, which are caused by the
interaction of the global circulation with that condensation-sublimation cycle and are readily visible to us via Ar our results. After accounting for both of these, it can be estimated that approximately 1014 O2 molecules cm-3 must be added to the atmosphere sampled by Curiosity
in order to explain the observed 1700 to 2200 ppmv increase in O2 between LS 60°and LS
140° in MY 33. In other words the number density of O2 molecules at LS 140° in MY 33 is ~
1014 molecules cm-3 larger than it would have been had the ratio of O
2 to Ar remained
constant as expected. For reference, given the 1700 ppm starting value at LS 60° the O2
mixing ratio would have been ~1830 ppm at LS 140° had the O2 to Ar ratio remained constant
over that time span.
Using the O2/40Ar ratio as an indicator for O2 variability outside of the known and observed
seasonal dynamics, a simple linear model can be used to fit a single slope to all the data (Fig. 10). This model highlights a consistent seasonal increase in O2/40Ar ratio of 0.014/100° LS
Accected
Article
during the LS 0–150° period, with an interannual variation in the mean O2/40Ar ratio in this
period. For LS > 150°, O2/40Ar seems to be more or less constant, with no significant
interannual variation. The low values at LS > 310° in MY 31 suggest a possibility of
additional interannual variation late in the Mars year, and potentially the onset of the
increases that are observed through the spring of the following years, but future observations would be needed to confirm this possibility.
To within the uncertainties caused by limited sampling and measurement error, this
magnitude appears typical of the unexpected seasonal increase, and so going forward we will adopt ~400 ppm and ~ 1014 molecules cm-3 as the amount that needs to be resolved.
Assuming that the unexpected O2 is uniformly mixed in the lower atmosphere, as seems
likely for perturbations of this timescale given current assumptions about the eddy diffusion coefficient, the 1014 molecules cm-3 becomes 1020 molecules cm-2 in the atmospheric column. (See, for example, Krasnopolsky [2010] who adopts 107 cm2 s-1 for the eddy diffusion
coefficient, which gives a ~ 2-day characteristic time scale for the bottom scale height of the atmosphere.)
Given photochemical schemes above, this 400 ppm of extra O2 would require a
corresponding destruction of CO2 and H2O molecules in approximately 170 sol. Considering
H2O alone, ~800 ppm of H2O would need to be destroyed, which is more than five times
larger than the maximum abundance of H2O measured in and around Gale Crater by REMS
[Martínez et al., 2016] and ChemCam [Fig. 11 in McConnochie et al., 2018]. Thus, it appears unlikely that the needed O2 could be produced from the available atmospheric water for any
plausible H2O photolysis or dissociation mechanism. Furthermore, H2O abundance shows an
increase during this time period, and no strong correlation with O2 (Supporting Information,
§S6). Estimates for the production of O from CO2, using CO2 photolysis rates for the lower
atmosphere of Mars [Table 1 in Wong et al., 2003], indicate that this process is much too slow to generate the observed rise over the short (~1/2 yr) time period. For completeness, note that photolysis or other dissociation of CO is negligible and in any case a seasonal removal of ~800 ppm of CO is clearly ruled out by observations [e.g., Smith et al., 2009]. The primary destruction pathways for O2 are through direct photolysis in the upper
atmosphere and reaction with photolysis products of H2O, HO2, and CO2 deeper [Atreya et
al., 2006; Lefèvre and Krasnopolsky, 2017; Wong et al., 2003]. Even factoring in the effects
of dust devils and large dust storms (though no major dust events occurred during the measurement period) [Atreya et al., 2006], the lifetime of O2 against photochemical
Accected
Article
destruction in the Mars atmosphere is expected to be at least 10 years, possibly longer [Krasnopolsky, 2010; Lefèvre and Krasnopolsky, 2017]. Again using the O2/40Ar ratio as an
indicator for O2 variability (Fig. 10), the SAM measurements in MY 33 show a relative
decrease of 23% in a period of 39 days (38 sol). (This is a ~500 ppm absolute O2 decrease
from what would be expected from a constant O2/40Ar ratio given the starting O2 abundance
at LS 140°.) There is a similar decrease observed from fall to winter of MY 31, although the
measurement frequency is such that the period of change appears longer (-20% in 201 sol). In particular the rapid drop in MY 33 corresponds to a lifetime of 150 days, several orders of magnitude less than the photochemical equilibrium lifetime of 10 years. The drop in MY 31 corresponds to a lifetime of ~1000 days, which is still relatively short.
The lack of a known atmospheric source or sink that could explain the apparent behavior of the O2 in Gale Crater suggests the possibility of a temporary surface reservoir. Previously,
Herschel WIFI observations found that the O2 vertical profile above the surface is not
constant with altitude [Hartogh et al., 2010b] and preliminary analysis of the data show that a surface flux of O2 may be required to explain the observations (Paul Hartogh, personal
communication, 2016). A surface sink has been previously invoked to balance the current redox budget [Zahnle et al., 2008], and the surface is known to harbor a variety of oxidant species [e.g., Lasne et al., 2016 review]. In fact the Viking Gas Exchange experiments found that a significant quantity of O2 was released whenever soil samples were humidified [Klein,
1978; Oyama and Berdahl, 1977] although these experiments were all done at ~ 10°C rather than Mars-ambient temperatures.
Deposition of oxygen could occur in the form of more reactive oxidized species, superoxides, hydrogen peroxide (H2O2), ozone (O3), or perchlorates, all of which are assumed to have a
higher surface reaction probability () with surface materials than molecular oxygen. It is possible to conceive of an oxygen cycle with the appropriate seasonal and interannual variability if oxygen were effectively converted to these species, deposited into the regolith, and then re-released due to thermal, chemical, or radiation perturbations.
Perchlorates, found to be prevalent in the surface materials in Gale Crater at 0.03-1 wt% level [Sutter et al., 2017], are very stable. They have also been detected at 0.4-0.6 wt% level in the polar landing site of the Phoenix Lander [Hecht et al., 2009]. To put perchlorates in context, a 1-cm depth of soil containing 1% by weight of calcium perchlorate has slightly more than enough oxygen to contribute the apparent ~ 1020 molecules cm-2 of unexpected column O2
Accected
Article
perchlorate salts [Quinn et al., 2013]. However these results point to a long-term
accumulation of O2 in the martian soil; the production rate of O2 from perchlorate radiolysis
is insufficient to produce the observed recurring unexplained signal. More specifically, based on the Quinn et al. [2013] experimental radiation dose and yield, and on their estimated Martian dose rates and estimated 2 m cosmic ray penetration depth, it would take on order of 1 Myr to accumulate enough trapped O2 for one season worth of 1020 molecules cm-2 of
column O2 variation. Similarly, proposed ‘superoxide’ O2- ions, suggested to explain the
results of the Viking soil reactivity experiments, could form from ultraviolet radiation on surface minerals and lead to the observed release of O2 with humidification [Yen et al., 2000],
but the reported rate of superoxide generation is too small to be consistent with the inferred column O2 signal, yet again by a factor of ~106.
The Viking Gas Exchange experiments released up to 770 nanomoles O2 from a 1 cm3
sample over a period of less than 11 days upon “humidification” at ~10 C [Klein, 1978;
Oyama and Berdahl, 1977]. If the same abundance of rapidly releasable O2 was present
across 2 meters of depth (i.e., 200 cm3), this would yield the 1020 molecules cm-2 that would explain the atmospheric measurements. This indicates that sufficient rapidly releasable O2 is
present in the Martain soil, although it is not clear that such a rapid release of O2 could have
occurred at Mars-ambient temperatures. More importantly, this serves to illustrate that
explaining a one-time release of O2 is not the main problem. The primary difficulty is that the
slow rates of accumulation in the processes considered so far cannot explain the seasonal recurrence of excess O2.
Hydrogen peroxide is worth considering as a solution to this problem, because it is less stable than perchlorates, and is therefore more likely to provide a rapidly exchangeable reservoir of O2. H2O2 has been detected in the atmosphere [Clancy et al., 2004; Encrenaz et al., 2004],
exhibits seasonal and interannual variability [Encrenaz et al., 2019], and it has been suggested that diffusion of atmospheric H2O2 into the regolith and/or mineral/water
interactions could supply H2O2 in the near-subsurface [Bullock et al., 1994; Lasne et al.,
2016].
Current knowledge of H2O2 physics and chemistry in Martian soil is very limited, but based
on a coupled soil-atmosphere model by Bullock et al. [1994] it appears that the magnitude and thermal sensitivity of H2O2 soil adsorption is potentially close to the right order of
magnitude to supply the unexpected 1020 molecules cm-2 of O2. However this conclusion only