HAL Id: hal-01453344
https://hal.archives-ouvertes.fr/hal-01453344
Submitted on 13 Feb 2017HAL is a multi-disciplinary open access archive for the deposit and dissemination of sci-entific research documents, whether they are pub-lished or not. The documents may come from teaching and research institutions in France or abroad, or from public or private research centers.
L’archive ouverte pluridisciplinaire HAL, est destinée au dépôt et à la diffusion de documents scientifiques de niveau recherche, publiés ou non, émanant des établissements d’enseignement et de recherche français ou étrangers, des laboratoires publics ou privés.
Lamri Naidja, Hocine Ali-Khodja, Salah Khardi
To cite this version:
Lamri Naidja, Hocine Ali-Khodja, Salah Khardi. Particulate matter from road traffic in Africa. Journal of Earth Sciences and Geotechnical Engineering, Scienpress LTD, 2017, 7 (1), pp.389-304. �hal-01453344�
Scienpress Ltd, 2017
Particulate matter from road traffic in Africa
Lamri Naidja12, Hocine Ali-Khodja1 and Salah Khardi3
Abstract
In general, much of the air pollution that has adverse impacts on human health and the environment today is the result of anthropogenic activities. Road traffic has led to increase in many air pollutants to levels around the world. It is considered as one of an important source of particulate matter in Africa. Information on PM concentrations and impacts on human health in most African countries are poorly documented, lack of air monitoring network and insufficient number of air quality related researchers may be the reason for the lack of such studies.
A few studies realized in African cities indicate an increasing number of exceedances of WHO guidelines for health related to road traffic. The transport sector has been expanding rapidly. Generally, car fleets are older and poorly maintained, high number of diesel-powered vehicles and all vehicles use low-quality fuels with high lead and Sulphur, which add to traffic-related air pollution. The objective of this overview aims at describing the atmospheric pollution recorded in many African cities and identifies the contribution of particulate matter from road traffic to the deterioration of the air quality in Africa.
1 Introduction
In 2008, the World Health Organization (2008) reported that 1.3 million annual deaths worldwide are attributable to air pollution, which 82,000 in sub-Saharan Africa. Also has recorded between 2004 and 2008 an increase of 16% in the total number of deaths due to air pollution. Among atmospheric pollutants, particulate
1
Laboratoire de Pollution et Traitement des Eaux, Université Mentouri, Route de Aïn El Bey, Constantine 25017, Algeria.
2
Centre de Recherche Scientifique et Technique en Analyses Physico-Chimiques, BP 384, Siège ex-Pasna Zone Industrielle, Bou-Ismail CP 42004, Tipaza, Algérie.
3 Claude Bernard University- IFSTTAR LTE, 25, avenue François Mitterrand, Case 24 Cité des
matter (PM) plays an important role in air quality worsening in urban areas. PM is described in the literature as a mixture of metals, salts, organic compounds from combustion and elemental carbon (Harrison and Yin, 2000; Perrone et al., 2010). Epidemiological and toxicological research has shown the relationship between particulate matter exposure and human health effects such as cardiovascular diseases (Pope et al., 2009; Brook et al., 2010), mortality and morbidity (Lippmann et al., 2000; Dominici et al., 2004) and lung cancer (Pope et al., 2002; Turner et al., 2011). For regulatory purposes and for estimating health impacts, PM is measured and classified by their aerodynamic diameter into two major categories of particles, PM10 and PM2.5 (WHO, 2000). Fine particles smaller than
2.5 µm in diameter (PM2.5) are recognized through epidemiological studies, as
being associated with the aforementioned pathologies as well as with asthma especially in children and Chronic Obstructive Pulmonary Disease (COPD) that affects both children and adults (Ebelt et al., 2000, Michael et al., 2013). PM2.5
was considered more toxic than the coarse particles (Senlin et al., 2008) with a diameter of less than 10 μm (PM10), which known for their cytotoxic and
proinflammatory properties (Jimenez et al., 2002, Bengalli et al., 2013).
As developed countries, protection and regulatory plans were implemented very quickly with the specific objective to reduce emissions of various air pollutants. Most developing countries have long established laws that regulate air emissions to reduce levels of pollution and other impacts on the environment, but few have been successful to improve local air quality (Bell and Russell, 2002). According to WHO (2011) data between 2008 and 2009, populations in countries such as China (150 µg/m3
, Lanzhou), South Korea (64 µg/m3, Seoul), Nigeria (122 µg/m3, Lagos), Ghana (98 µg/m3, Accra), Madagascar (68 µg/m3, Antananarivo), South Africa (66 µg/m3, Johannesburg) suffer from high PM10 concentration in ambient air (WHO, 2011).
Van Donkelaar et al. (2015) revealed that 80% of the world's population lives in areas where average annual concentrations of PM2.5 exceed highly the WHO
guideline’s (10 µg/m3). In Africa, the regions most exposed to fine particles (PM2.5) are found in Senegal (38 μg/m3, Dakar), Ghana (50 μg/m3, Accra) and
Madagascar (59 μg/m3, Antananarivo) (WHO, 2011).
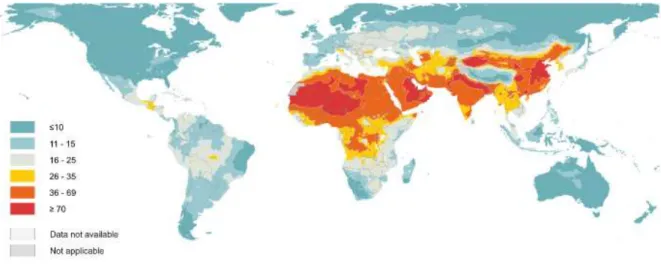
Figure 1 highlights the high concentrations of PM2.5 that extend from North Africa
to East Asia. These concentrations of PM2.5 recorded in sub-Saharan Africa and
Asian continent are much higher than those of Europe, the eastern United States and the West of South America. These high concentrations of fine particles originate mainly from automobile combustion and biomass burning also under the influence of the Sahara desert.
Figure 1: Global annual median concentration of PM2.5 in µg/m3 (WHO, 2016).
2 Overview of transport sector in Africa
The use of automobiles has considerably increased with urbanization throughout the world, urban transport plays a critical role in the development of urban areas and overall economic growth but it also results in negative factors such as air pollution (Mieszkowski and Mills, 1993). Over the last few decades the demographic and urban growth and industrial development have accelerated the use of motorized vehicles namely in developing countries (Sharma et al., 2011; OECD, 2010).
Although the number of road motor vehicles per 1000 inhabitants is the least in Africa compared to other regions (Davis et al., 2013). Outdoor PM levels from road traffic in Africa are generally much higher than in developed countries. One of the possible explanations is the large numbers of engine vehicles powered by diesel (Brunekreef, 2005), which generate ten times more particles than gasoline vehicle per kilometer driven (Rallis, 1988; Krupnick, 1991). Car fleets are older and poorly maintained, which adds to traffic-related air pollution (Panyacosit, 2000).
Figure 2: Vehicles per thousand people in 2011 in the world (Davis et al., 2013)
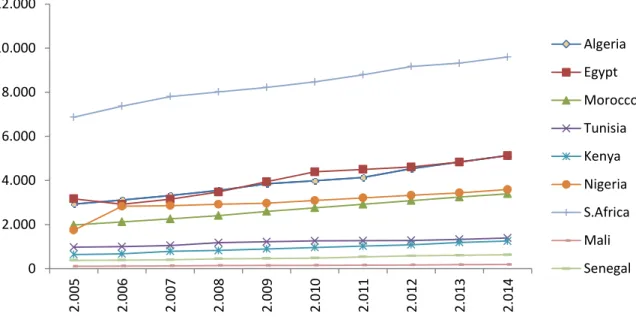
But, over the last decade, motor vehicles numbers have been doubling in Africa (see Fig. 3). The total number of motor vehicles increased from 25.996 million in 2005 to 42.511 million in 2014, with an average growth rate of 4 % per year in the continent, most of this growth in vehicle holdings comes from imports of used vehicles (OICA, 2014).
Figure 3: Increase in vehicle fleet in African countries between 2005 and 2014 (in thousand units) (OICA, 2014) 0 100 200 300 400 500 600 700 800 900
USA Canada Western
europe
Eastern Europe
Brazil Middle
East
China Africa India
0 2.000 4.000 6.000 8.000 10.000 12.000 2.0 05 2.0 06 2.0 07 2.0 08 2.0 09 2.0 10 2.0 11 2.0 12 2.0 13 2.0 14 Algeria Egypt Morocco Tunisia Kenya Nigeria S.Africa Mali Senegal
High rate of urbanization combined with low-income individual, has resulted in the rapid increase in the import of older used vehicles (Fourn and Fayomi, 2006). The Algerian vehicle fleet consists essentially of passenger vehicles (64%), trucks (almost 20%), motor coaches and buses (1.52%) and others. Most of the fleet is not equipped with catalytic converters (ONS, 2014). In 2013, the transport sector ranked first in energy consumption, 41% and 65 % of vehicle fleet run is diesel vehicles (UNEP, 2015a). Air pollution in Cairo has become an increasingly serious issue. Cairo is ranked in the 33rd on the list of the most polluted cities by PM10 (WHO, 2014); road traffic emissions accounted for 32% of particulate
matter (USAID, 2004). According to the Central Agency for Public Mobilization and Statistics of Egypt the total number of vehicles was around 7 million in 2013, and approximately half of them were in Cairo. Public transportation accounted for 68% of all vehicles while buses contributed to 82% of all public transportation. Almost all buses and taxis use diesel as a fuel and old generation diesel engines without catalytic converters or diesel particle filters, and about 90,000 taxis in Egypt are over 20 years old (CAPMAS, 2014). The Kenyan fleet vehicle in 2004 was composed of light-duty trucks (35%), passenger cars (29%), heavy-duty trucks (7%) and minibuses (7%). Most trucks and buses use sulphur-rich diesel (KNBS, 2007).
In Cotonou, the economic capital of Benin, poor air quality has recently been reported (Cachon et al., 2014). The increase in recorded air pollution is mainly due to urbanization (UN, 2010), the lack of public transport and the use of highly polluting mopeds (aged over 15 years) (Gounougbe, 1999; Avogbe et al., 2011). In 2002, it is estimated that more than 94,000 mopeds and 350,000 used vehicles are in circulation in Cotonou (MMEH, 2002).
Several studies have shown the clear relationship between automobile traffic density, the use of leaded gasoline and lead content in the air and soil in urban zones (Caprio et al., 1974; Heinze et al., 1998; Lanphear et al., 1998).
US EPA began to ban the use of leaded gasoline in the 70's (Harrington and McConnell, 2003). In 1996, World Bank is calling for the elimination of leaded gasoline. After that, the European Union adopted new laws progressively to ban petrol containing lead for the period 1998–2005 (O'Brien and Partner, 2011). Africa like the Middle East remains the exception, motorized vehicles still run exclusively on leaded gasoline. In 1993, lead emissions from vehicles in Africa were estimated over 13 million tons, which represent quarter of the global annual lead emissions (Bultynck and Reliquet, 2003). In most African countries, gasoline contains between 0.5 and 0.8 g/l lead, which is among the highest levels in the world (Tong et al., 2000)
Thus, in Senegal like in many African countries, a rapid uncontrolled growth of the automobile fleet can be seen and could be the origin of negative effects on
health particularly in cities (UNEP, 2015b). Studies carried out in Dakar show that lead content in the barks of trees bordering the highways is due to traffic intensity (Diouf et al., 1994). These results therefore show that the use of leaded gasoline is the main cause of air contamination and could be one of the principal sources of exposure to the public especially in children who constitute the most vulnerable group.
The greater increases in public transport demand for the major sub-Saharan Africa cities encourage the use of the two-wheels (Motorcycle-taxi) as a mean of transportation owing to cheaper but highly polluting fuels (Godard and Ngabmen, 2002; Diaz Olvera et al., 2007). It estimated to emit more than 10 times of fine particulate matter per kilometer travelled than a modern car, and only a little less than a light diesel truck (Weaver and Chan, 1996). Assamoi and Liousse (2010) indicated that these vehicles are strong emitters of particles, especially in Togo, Benin, Burkina Faso, Mali and Nigeria where fuel uses a mixture of gasoline and oil (Wane et al., 2001; Diallo, 2001). Non-motorized transport, including walking is also a transportation mode in sub-Saharan Africa cities which accounts for 50% of all trips, whereby citizens are exposed to highly polluted air throughout the day (Gwilliam, 2003).
African countries suffer from weak traffic planning and management and low funding for routine and periodic rehabilitation of roads (Riverson et al., 1991; Pedersen, 2001, Armah et al., 2010), which affect traffic flows and travel speeds. The traffic congestion has an important part to the deterioration of urban air quality by multiplying emissions per kilometer travelled (Chin, 1996; Smit et al., 2008; Armah et al., 2010).
According to Japanese International Cooperation Agency (2006) that estimated the increase in vehicle fleet by 148% in Nairobi between 2004 and 2025 which implies decrease of an average speed of trips from 35 km/h to 11 km/h as congestion increases, that if nothing is changed regarding road infrastructures. In Accra, the road congestion is a serious problem, 70% of major roads operating classified in poor conditions, speed traffic flow is considered of less than 20 km/h and about 1.34 million passenger trips per day by public transport (Armah et al., 2010). A similar situation exists in Zimbabwe, according to the World Bank (2008), by 2005, road network in poor condition exceeds 40 % and only 24% was in good condition due to increase in vehicle fleet and lack of road maintenance.
3 Levels of PM in African cities from road traffic
African cities are poorly equipped to absorb such a rapidly growing population. The lack of infrastructure has brought on severe problems. Vehicles are major
sources of air pollutant emissions especially in urban areas. These various pollutant emissions depend on the daily kilometers traveled (Beevers and Carslaw, 2005; Batterman et al., 2014), the fuel composition (Nelson et al., 2008; Johansson et al., 2009), the age of the vehicle fleet (Zachariadis et al., 2001), and also the composition of the fleet (Sternbeck et al., 2002).
In the framework of the Clean Air initiative project in sub-Saharan Africa, studies conducted in Dakar and Ouagadougou show that the emissions of NOX, SO2 and
PM10 in Dakar are higher than level found in Ouagadougou, due to the use of
public buses and an old vehicles fleet which motorized by diesel. On the other hand, in Ouagadougou, 86 % of motorized trips depend on mopeds fueled by gasoline, that don’t carry more than one passenger means high level emissions of carbon monoxide (CO) and hydrocarbons (HC) compared to Dakar and low emissions of NOX, SO2 and PM10 (Schwela, 2012).
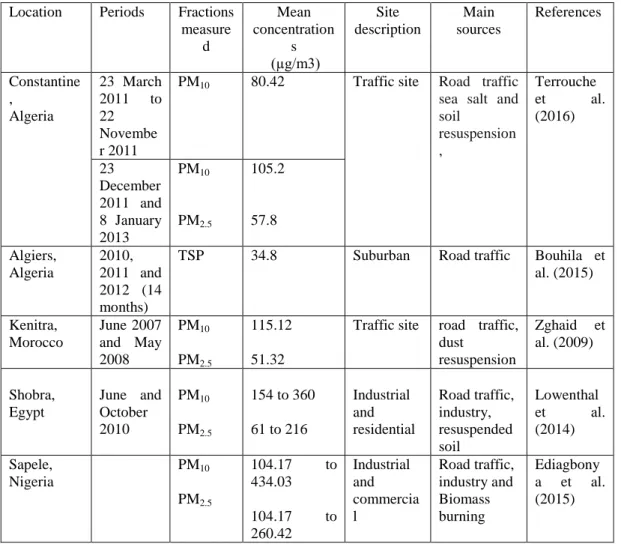
Table 1: shows the ranges of mean PM10, PM2.5 and TSP levels obtained for recent studies realized in African cities.
Location Periods Fractions
measure d Mean concentration s (µg/m3) Site description Main sources References Constantine , Algeria 23 March 2011 to 22 Novembe r 2011
PM10 80.42 Traffic site Road traffic
sea salt and soil resuspension , Terrouche et al. (2016) 23 December 2011 and 8 January 2013 PM10 PM2.5 105.2 57.8 Algiers, Algeria 2010, 2011 and 2012 (14 months)
TSP 34.8 Suburban Road traffic Bouhila et
al. (2015) Kenitra, Morocco June 2007 and May 2008 PM10 PM2.5 115.12 51.32
Traffic site road traffic, dust resuspension Zghaid et al. (2009) Shobra, Egypt June and October 2010 PM10 PM2.5 154 to 360 61 to 216 Industrial and residential Road traffic, industry, resuspended soil Lowenthal et al. (2014) Sapele, Nigeria PM10 PM2.5 104.17 to 434.03 104.17 to 260.42 Industrial and commercia l Road traffic, industry and Biomass burning Ediagbony a et al. (2015)
Bamako, Mali Dakar, Senegal PM PM 205.8 80.7 Residential and traffic site Road traffic, biomass burning Val et al. (2013) Harare, Zimbabwe July to December 2002 TSP PM10 PM2.5 106.11± 21.41 59.70± 13.48 40.55± 11.43 Industrial site Road traffic, industry Kuvarega and Taru (2008) Addis Ababa, Ethiopia 22 February 2008 to 15 April 2008 17 June 2008 to 23 July 2008 TSP PM10 195±141 80±61 Urban unpaved road, construction works Gebre et al. (2010)
The daily PM10 levels recorded in Constantine, Algeria, between March 2011 to
November 2011 were reported by Terrouche et al. (2016) at 80.42 µg/m3. In another sampling campaign during 23 December 2011 to 8 January 2013, average concentrations of PM10 (105.2 µg/m3) and PM2.5 (57.8 µg/m3) greatly exceeded
both the Algerian limit and the WHO guideline values. Traffic and industry were considered as the main source in the region.
During 2010, 2011 and 2012 (14 months), PM levels were measured in Draria city, a suburban site near Algiers, and the mean TSP concentration was 34.8 μg/m3, these excessive levels were attributed to intense traffic (Bouhila et al., 2015)
According to study carried out by Zghaid et al. (2009) during the period between June 2007 and May 2008, in Kenitra city which is located 50 km north of Rabat, the average PM10 and PM2.5 concentrations were 115.12 µg/m3 and 51.32 µg/m3
respectively. The major sources of pollution in this region were attributed to road traffic and dust resuspension.
Lowenthal et al. (2014) studied the data collected from the ambient air quality stations located at 5 Cairo different sites during June and October 2010. The concentrations of PM10 and PM2.5 were higher in October than June in the five
sites excepted at the residential site of Helwan. Shobra recorded high daily concentrations for PM10 and PM2.5 which ranged from 154 to 360 µg/m3 and 61 to
216 µg/m3 respectively, due to heavy traffic and industrial activities in the area. Lower concentrations for the two PM fractions were observed during summer at the residential area of El-Zamalek and the urban background site of Kaha, whereas Helwan was located nearby a cement plant and heavy traffic. The main source of
PM10 was resuspended soil, exhaust emissions from vehicle, and agricultural
waste open air incineration, while PM2.5 was mostly due to exhaust gases.
Ediagbonya et al. (2015) carried out a measurement campaign during the wet season at Sapele town located in Southern Nigeria which is characterized by a petrochemical plant and commercial activities. The samples collected by a high volume gravimetric sampler in ten different locations indicated high levels of PM10 and PM2.5 which ranged from 104.17 to 434.03 µg/m3 and 104.17 to 260.42
µg/m3 respectively, due mainly to traffic and burning wood used as a fuel.
Val et al. (2013) reported that daily PM mean levels at Bamako city and Dakar city reached 205.8 µg/m3 and 80.7 µg/m3 respectively; these high concentrations are mainly due to traffic emissions and biomass burning used for cooking and heating purposes.
Gebre et al. (2010) collected samples from seven sites in Addis Ababa, during the period extending from 22 February 2008 to 15 April 2008 and from 17 June 2008 to 23 July 2008. They reported that the mean TSP and PM10 concentrations were
195±141 µg/m3 and 80±61 µg/m3 respectively. The observed average TSP and PM10 concentrations during the dry season were 304±102 µg/m3 and 107±68
µg/m3 respectively whereas during the wet season, the average concentrations were 75±5 µg/m3 and 43±21 µg/m3 respectively. The high PM levels were attributed to unpaved road and construction works around all sites and the variance of concentrations for the two seasons can be explained by rainfall scavenging of aerosol during the wet season. In another study, Kuvarega and Taru (2008) conducted an atmospheric measurement campaign of particulates, from July to December 2002, near an industrial site in the city of Harare, Zimbabwe. The average concentrations of TSP, PM10 and PM2.5 were 106.11± 21.41, 59.70±
13.48 and 40.55± 11.43 µg/m3
respectively; elemental analysis showed high levels of Co and Ni originating from the thermal power station, whereas the presence of lead and cadmium was linked to heavy traffic in the area especially during rush hours in the morning and in the evening.
4 Conclusion
In the African countries, air pollution appears as a public health problem. The health consequences of this pollution are currently causing concern among the population and decision makers. There is little data available to raise public awareness and to convince the authorities of the urgent actions to be taken to curb the phenomenon.
Choice and use of fuels for motorized transportation still remains an issue to be solved in Africa, and particularly in countries where there is a high utilization of
two-wheeled motor vehicles. The first priority clearly is to phase-out the addition of lead to gasoline to reduce urban air pollution and improving the quality of life in African cities. The use of catalytic converters on vehicle exhaust systems reduces greatly the emissions of several airborne pollutants from vehicles, including lead.
The introduction of alternative fuels such as compressed natural gas (CNG) and liquefied petroleum gas (LPG) in taxi and buses, which are available in abundance in many African countries, is an efficient solution to improve urban air quality. Electric vehicles are already being used in many developed countries, which have obvious attractions such as urban vehicles also to be economically viable at the individual level; they may thus combine environmental and economic benefit. Technical control and maintenance of vehicles may also reduce emissions significantly.
Promotion of public transport by building metros in large cities and develop tram rails in suburban zones, these investments are high initially but become cost effective in the medium term especially in high density cities where one metro line can transport more people than ten 3-lane highways.
References
[1] Armah, F. A., Yawson, D. O., & Pappoe, A. A. (2010). A systems dynamics approach to explore traffic congestion and air pollution link in the city of Accra, Ghana. Sustainability, 2(1), 252-265.
[2] Assamoi, E.-M., & Liousse, C. (2010). A new inventory for two-wheel vehicle emissions in West Africa for 2002. Atmospheric Environment, 44(32), 3985-3996.
[3] Avogbe, P. H., Ayi-Fanou, L., Cachon, B., Chabi, N., Debende, A., Dewaele, D., Sanni, A. (2011). Hematological changes among Beninese motor-bike taxi drivers exposed to benzene by urban air pollution. African Journal of Environmental Science and Technology, 5(7), 464-472.
[4] Batterman, S., Burke, J., Isakov, V., Lewis, T., Mukherjee, B., & Robins, T. (2014). A comparison of exposure metrics for traffic-related air pollutants: Application to epidemiology studies in Detroit, Michigan. International journal of environmental research and public health, 11(9), 9553-9577. [5] Beevers, S. D., & Carslaw, D. C. (2005). The impact of congestion charging
on vehicle emissions in London. Atmospheric Environment, 39(1), 1-5. [6] Bell, R. G., & Russell, C. (2002). Environmental policy for developing
[7] Bengalli, R., Molteni, E., Longhin, E., Refsnes, M., Camatini, M., & Gualtieri, M. (2013). Release of IL-1β Triggered by Milan Summer PM10: Molecular Pathways Involved in the Cytokine Release. BioMed research international, 2013.
[8] Bouhila, Z., Mouzai, M., Azli, T., Nedjar, A., Mazouzi, C., Zergoug, Z., Boukhadra, D., Chegrouche, S., & Lounici, H. (2015). Investigation of aerosol trace element concentrations nearby Algiers for environmental monitoring using instrumental neutron activation analysis. Atmospheric Research, 166, 49-59.
[9] Brook, R. D., Rajagopalan, S., Pope, C. A., Brook, J. R., Bhatnagar, A., Diez-Roux, A. V., Mittleman, M. A. (2010). Particulate matter air pollution and cardiovascular disease an update to the scientific statement from the American Heart Association. Circulation, 121(21), 2331-2378.
[10] Brunekreef, B. (2005). Out of Africa. Occupational and environmental medicine, 62(6), 351-352.
[11] Bultynck, P., & Reliquet, C (2003). PROGRAM COORDINATION FOR THE WORLD BANK CLEAN AIR INITIATIVE IN SUB-SAHARAN AFRICAN CITIES. www. worldbank. org/cleanair.
[12] Cachon, B. F., Firmin, S., Verdin, A., Ayi-Fanou, L., Billet, S., Cazier, F., Sanni, A. (2014). Proinflammatory effects and oxidative stress within human bronchial epithelial cells exposed to atmospheric particulate matter (PM 2.5 and PM> 2.5) collected from Cotonou, Benin. Environmental pollution, 185, 340-351.
[13] CAMPAS (2014). Bulletin of licensed vehicles 2014, available at:
http://www.msrintranet.capmas.gov.eg/pepo/879_e.pdf
[14] Caprio, R. J., Margulis, H. L., & Joselow, M. M. (1974). Lead absorption in children and its relationship to urban traffic densities. Archives of Environmental Health: An International Journal, 28(4), 195-197.
[15] Chin, A. T. (1996). Containing air pollution and traffic congestion: transport policy and the environment in Singapore. Atmospheric Environment, 30(5), 787-801.
[16] Davis, S. C., Diegel, S. W., & Boundy, R. G (2013). Transportation Energy Data Book: Edition 32, from the Center for Transportation Analysis (CTA). [17] Diallo, M. (2001). Two-stroke engine two-wheel vehicles and the issue of the
leaded gasoline phase-out: the study case of Burkina Faso and of Western African countries as users of 2-wheel vehicles. Paper presented at the Clean Air Initiative. Regional conference on the suppression of lead in gasoline in Sub-saharan Africa.Dakar, Senegal, June.
[18] Diaz Olvera, L., Plat, D., & Pochet, P. (2007). Mobilité quotidienne en temps de crise. Belgeo. Revue Belge de géographie(2), 173-188.
[19] Diouf, A., Sarr, M., Niane, B., Ba, D., & Ciss, M. (1994). [Air pollution by lead emitted from vehichles in the Dakar region]. Dakar medical, 40(2), 117-121.
[20] Dominici, F., Zanobetti, A., Zeger, S. L., Schwartz, J., & Samet, J. M. (2004). Hierarchical bivariate time series models: a combined analysis of the effects of particulate matter on morbidity and mortality. Biostatistics, 5(3), 341-360.
[21] Ebelt, S. T., Petkau, A. J., Vedal, S., Fisher, T. V., & Brauer, M. (2000). Exposure of chronic obstructive pulmonary disease patients to particulate matter: relationships between personal and ambient air concentrations. Journal of the Air & waste Management association, 50(7), 1081-1094. [22] Ediagbonya, T., Ukpebor, E., & Okieimen, F. (2015). Source identification of
trace metal in total suspended particulate matter. International Journal of Chemical Sciences, 7, 37-45.
[23] Fourn, L., & Fayomi, E. (2006). Pollution atmosphérique en milieu urbain à Cotonou et à Lokossa, Bénin. Bull Soc Pathol Exot, 99(4), 264-268.
[24] Gebre, G., Feleke, Z., & Sahle-Demissie, E. (2010). Mass concentrations and elemental composition of urban atmospheric aerosols in Addis Ababa, Ethiopia. Bulletin of the Chemical Society of Ethiopia, 24(3).
[25] Godard, X., & Ngabmen, H. (2002). Comme Zémidjan ou le succès des taxi-motos. Les transports et la ville en Afrique au sud du Sahara: le temps de la débrouille et du désordre inventif, 397.
[26] Gounougbe, F. (1999). Pollution atmosphérique par les gaz d’échappement et état de santé des conducteurs de taxi-moto (Zemidjan) de Cotonou (Bénin). These de doctorat en Medecine(832).
[27] Gwilliam, K. (2003). Urban transport in developing countries. Transport Reviews, 23(2), 197-216.
[28] Harrington, W., & McConnell, V. D. (2003). Motor vehicles and the environment: Resources for the Future Washington, DC.
[29] Harrison, R. M., & Yin, J. (2000). Particulate matter in the atmosphere: which particle properties are important for its effects on health? Science of the total environment, 249(1), 85-101.
[30] Heinze, I., Gross, R., Stehle, P., & Dillon, D. (1998). Assessment of lead exposure in schoolchildren from Jakarta. Environmental Health Perspectives, 106(8), 499.
[31] Hicks, W. K., Kuylenstierna, J. C., Mathur, V., Mazzucchelli, S., Burijson, V., Shrestha, S., Van Tienhoven, A. M. (2001). Development of the regional policy process for air pollution in South Asia, Southern Africa and Latin America. Water, Air, and Soil Pollution, 130(1-4), 211-216.
[32] Japanese International Cooperation Agency (2006). The Study on a Master Plan for Urban Transport in the Nairobi Metropolitan Area in the Republic of Kenya, Final Report.
[33] Jimenez, L., Drost, E., Gilmour, P., Rahman, I., Antonicelli, F., Ritchie, H., Donaldson, K. (2002). PM10-exposed macrophages stimulate a proinflammatory response in lung epithelial cells via TNF-α. American Journal of Physiology-Lung Cellular and Molecular Physiology, 282(2), L237-L248.
[34] Johansson, C., Norman, M., & Burman, L. (2009). Road traffic emission factors for heavy metals. Atmospheric Environment, 43(31), 4681-4688. [35] Kenya National Bureau of Statistics (2007). Ministry of Planning. Republic
of Kenya Economic Survey 2007. www.cbs.go.ke.
[36] Krupnick, A. J. (1991). "Transportation and Urban Air Pollution Policies for Developed and Developing Countries", Energy and Environmental Issues 1991, Transportation Research Record No.1312, Transportation Research Board, National Research Council, Washington, D.C.
[37] Kuvarega, A., & Taru, P. (2008). Ambiental dust speciation and metal content variation in TSP, PM10 and PM2.5 in urban atmospheric air of Harare (Zimbabwe). Environmental Monitoring and Assessment, 144(3), 1-14.
[38] Lanphear, B. P., Burgoon, D. A., Rust, S. W., Eberly, S., & Galke, W. (1998). Environmental exposures to lead and urban children's blood lead levels. Environmental Research, 76(2), 120-130.
[39] Lippmann, M., Ito, K., Nadas, A., & Burnett, R. (2000). Association of particulate matter components with daily mortality and morbidity in urban populations. Research report (Health Effects Institute)(95), 5-72, discussion 73-82.
[40] Lowenthal, D., Gertler, A., & Labib, M. (2014). Particulate matter source apportionment in Cairo: recent measurements and comparison with previous studies. International Journal of Environmental Science and Technology, 11(3), 657-670.
[41] Michael, S., Montag, M., & Dott, W. (2013). Pro-inflammatory effects and oxidative stress in lung macrophages and epithelial cells induced by ambient particulate matter. Environmental pollution, 183, 19-29.
[42] Mieszkowski, P., & Mills, E. S. (1993). The causes of metropolitan suburbanization. The Journal of Economic Perspectives, 7(3), 135-147. [43] MMEH (Ministère des Mines de l'Energie et d’Hydraulique) (2002). Tableau
de bord de l'Energie 2002 au Bénin. Direction Générale de l'Energie.
[44] National Statistic Office ONS (2014): Parc national automobile, available at:
http://www.ons.dz/IMG/pdf/Parc_Auto31-12-2014.pdf
[45] Nelson, P. F., Tibbett, A. R., & Day, S. J. (2008). Effects of vehicle type and fuel quality on real world toxic emissions from diesel vehicles. Atmospheric Environment, 42(21), 5291-5303.
[46] O'Brien, E., & Partner, U. (2011). Chronology of Leaded Gasoline/Leaded Petrol History. Manager, Global Lead Advice & Support Service (GLASS) run by The LEAD Group Inc.
[47] OECD (2010). Trends in Urbanisation and Urban Policies in OECD Countries: What Lessons for China? Available at:
https://www.oecd.org/urban/roundtable/45159707.pdf
[48] OICA, Organisation Internationale des Constructeurs Automobiles (2014). World vehicles in use -all vehicles-Africa. Retrieved from :
[49] Organization, W. H. (2000). Air quality guidelines for Europe 2nd Edition. Chapter 7, particulate matter. Available from:
http://www.euro.who.int/__data/assets/pdf_file/0019/123085/AQG2ndEd_7_ 3Particulate-matter.pdf?ua=1
[50] Panyacosit, L. (2000). A review of particulate matter and health: focus on developing countries. International Institute for Applied Systems Analysis IR-00-005. Available at SSRN: https://ssrn.com/abstract=235099 or
http://dx.doi.org/10.2139/ssrn.235099
[51] Pedersen, P. O. (2001). Freight transport under globalisation and its impact on Africa. Journal of Transport Geography, 9(2), 85-99.
[52] Perrone, M. G., Gualtieri, M., Ferrero, L., Porto, C. L., Udisti, R., Bolzacchini, E., & Camatini, M. (2010). Seasonal variations in chemical composition and in vitro biological effects of fine PM from Milan. Chemosphere, 78(11), 1368-1377.
[53] Pope III, C. A., Burnett, R. T., Thun, M. J., Calle, E. E., Krewski, D., Ito, K., & Thurston, G. D. (2002). Lung cancer, cardiopulmonary mortality, and long-term exposure to fine particulate air pollution. Jama, 287(9), 1132-1141. [54] Pope, C. A., Burnett, R. T., Krewski, D., Jerrett, M., Shi, Y., Calle, E. E., & Thun, M. J. (2009). Cardiovascular mortality and exposure to airborne fine particulate matter and cigarette smoke shape of the exposure-response relationship. Circulation, 120(11), 941-948.
[55] Rallis, T. (1988). City transport in developed and developing countries (pp. 53-64): St Mrtin's Press, New York.
[56] Riverson, J., Gaviria, J., & Thriscutt, S. (1991). Rural Roads in Sub-Saharan Africa. World Bank Technical Paper, 141.
[57] Sharma, R. D., Jain, S., & Singh, K. (2011). Growth rate of motor vehicles in India-impact of demographic and economic development. Journal of economic and social studies, 1(2), 137.
[58] Schwela, D. (2012). Review of urban air quality in sub-Saharan Africa region–air quality profile of SSA countries. World Bank.
[59] Smit, R., Brown, A., & Chan, Y. (2008). Do air pollution emissions and fuel consumption models for roadways include the effects of congestion in the roadway traffic flow? Environmental Modelling & Software, 23(10), 1262-1270.
[60] Sternbeck, J., Sjödin, Å., & Andréasson, K. (2002). Metal emissions from road traffic and the influence of resuspension—results from two tunnel studies. Atmospheric Environment, 36(30), 4735-4744.
[61] Terrouche, A., Ali-Khodja, H., Kemmouche, A., Bouziane, M., Derradji, A., & Charron, A. (2016). Identification of sources of atmospheric particulate matter and trace metals in Constantine, Algeria. Air Quality, Atmosphere & Health, 9(1), 69-82.
[62] Tong, S., Schirnding, Y. E. v., & Prapamontol, T. (2000). Environmental lead exposure: a public health problem of global dimensions. Bulletin of the World Health Organization, 78(9), 1068-1077.
[63] Turner, M. C., Krewski, D., Pope III, C. A., Chen, Y., Gapstur, S. M., & Thun, M. J. (2011). Long-term ambient fine particulate matter air pollution and lung cancer in a large cohort of never-smokers. American journal of respiratory and critical care medicine, 184(12), 1374-1381.
[64] UNEP (2015a): CONSOMMATION ENERGETIQUE DU SECTEUR DES TRANSPORTS «BILAN ET PERSPECTIVES» : available at:
http://www.unep.org/Transport/new/PCFV/pdf/Algeria2015_Consommation Energetique%20.pdf
[65] UNEP (2015b). Senegal air quality policies. Retrieved from:
http://www.unep.org/transport/airquality/Senegal.pdf
[66] Val, S., Liousse, C., Galy-Lacaux, C., Cachier, H., Marchand, N., Badel, A., Baeza-Squiban, A. (2013). Physico-chemical characterization of African urban aerosols (Bamako in Mali and Dakar in Senegal) and their toxic effects in human bronchial epithelial cells: description of a worrying situation. Particle and fibre toxicology, 10(1), 1.
[67] Van Donkelaar, A., Martin, R. V., Brauer, M., Kahn, R., Levy, R., Verduzco, C., & Villeneuve, P. J. (2015). Global estimates of ambient fine particulate matter concentrations from satellite-based aerosol optical depth: development and application. University of British Columbia.
[68] United Nations (2010) - Department of Economic and Social Affairs. World Urbanization Prospects: The 2009 Revision. United Nations, New York; 2010.
[69] USAID (2004). The Cairo Air Improvement Project -Helping Millions Live Healthier Lives, Final Report, Prepared by Chemonics International Inc.
Available at:
http://www.chemonics.com/pv_obj_cache/pv_obj_id_3BD1282E054B3A028 6A182C521F1E35BC F651500/filename/Cairo%20Air%20Improvement.pdf [70] Wane, H. (2001). Urban mobility and emissions: towards accurate standards
for sub-saharan Africa. A research program and results on a Sahelian case: the district of Bamako.
[71] Weaver, C., & Chan, L. (1996). Bangkok Particulate Study. Report to the Thai Government and the World Bank. World Bank, Washington, DC.
[72] World Bank (2008): Zimbabwe Infrastructure Dialogue in Roads, Railways, Water, Energy, and Telecommunication Sub-Sectors. Report No. 43855-ZW. [73] World Health Organization (2000). Air quality guidelines for Europe, 2nd
edition. http://apps.who.int/iris/bitstream/10665/107335/1/E71922.pdf
[74] World Health Organization (2008). World Health Organization, Public Health and Environment, PHE - WHO Burden of disease associated with
urban outdoor air pollution.
http://www.who.int/phe/health_topics/outdoorair/databases/burden_disease/e n/index.html
[75] World Health Organization (2011). WHO, Urban outdoor air pollution database. http://apps.who.int/gho/data/node.main.154?lang=en
[76] World Health Organization (2014). 7 million premature deaths annually linked to air pollution. Media Centre news release. Geneva: World Health Organization (http://www.who.int/mediacentre/news/releases/2014/air-pollution/en/ , accessed 30 October 2014, accessed 2 April 2015).
[77] World Health Organization (2016). Ambient air pollution: A global assessment of exposure and burden of disease.
http://www.who.int/phe/publications/air-pollution-global-assessment/en/
[78] Zachariadis, T., Ntziachristos, L., & Samaras, Z. (2001). The effect of age and technological change on motor vehicle emissions. Transportation Research Part D: Transport and Environment, 6(3), 221-227.
[79] Zghaid, M., Noack, Y., Bounakla, M., & Benyaich, F. (2009). Pollution atmosphérique particulaire dans la ville de Kenitra (Maroc). 2268-3798.