Dynamic Trade Policy and Supply Chain Design Within the Oil and Gas Industry
byLiam Sharkey
M.P.S. Supply Chain Management, Pennsylvania State University, 2017 B.S. Mechanical Engineering, Clarkson University, 2014
SUBMITTED TO THE PROGRAM IN SUPPLY CHAIN MANAGEMENT IN PARTIAL FULFILLMENT OF THE REQUIREMENTS FOR THE DEGREE OF
MASTER OF APPLIED SCIENCE IN SUPPLY CHAIN MANAGEMENT AT THE
MASSACHUSETTS INSTITUTE OF TECHNOLOGY May 2020
© 2020 Liam Sharkey. All rights reserved.
The authors hereby grant to MIT permission to reproduce and to distribute publicly paper and electronic copies of this capstone document in whole or in part in any medium now known or hereafter created.
Signature of Author: _________________________________________________________________ Department of Supply Chain Management
May 1, 2020
Certified by: ________________________________________________________________________ James B. Rice, Jr. Deputy Director, Center for Transportation & Logistics Director, Supply Chain Exchange Program
Capstone Advisor
Accepted by: _______________________________________________________________________ Prof. Yossi Sheffi Director, Center for Transportation and Logistics Elisha Gray II Professor of Engineering Systems Professor, Civil and Environmental Engineering
Dynamic Trade Policy and Supply Chain Design by
Liam Sharkey
Submitted to the Program in Supply Chain Management on May 1, 2020 in Partial Fulfillment of the
Requirements for the Degree of Master of Applied Science in Supply Chain Management
ABSTRACT
Trade policies of the late 2010 decade are characterized by a unique combination of severity, shorter lifespan, and greater frequency. Supply chain leaders within the oil and gas industry may not recognize the full range of responses they might take when responding to this new dynamic. This report will do three things: first, understand how supply chains are currently reacting to this new dynamic; second, propose frameworks for outlining how supply chains could respond to this new challenge; and lastly, recommend a course of action given a certain supply chain design. This was accomplished using semi-structured interviews, case studies, reductionism, and supply chain resilience literature to develop, propose, consider, and validate potential frameworks. Two frameworks are presented in the report. The first framework has four distinct sub-approaches to tariff impact: tariff acceptance, tariff reduction, tariff avoidance, and tariff elimination. As a supply chain moves from tariff acceptance to tariff elimination, cost appears to increase and disruption risk appears to decrease. The data suggest that supply chains within the oil and gas industry tend to implement a solution that does not change the risk profile. The second framework focuses on three approaches a supply chain leader can adopt when allocating cost associated with trade policy: first, the firm can pass along the tariff’s financial impact to the customer; second, the firm can push back on the supplier and force them to take the financial impact of the tariff; and third, the firm assumes a portion of the tariff’s financial impact. The data suggests that most oil and gas supply chains assume some portion of the cost.
Capstone Advisor: James B. Rice, Jr.
Deputy Director, Center for Transportation & Logistics Director, Supply Chain Exchange Program
TABLE OF CONTENTS
LIST OF FIGURES _____________________________________________________________________ 5 LIST OF TABLES ______________________________________________________________________ 6 1 INTRODUCTION __________________________________________________________________ 7 1.1 Trade Policy and its Impact _____________________________________________________ 7 1.2 Approach ___________________________________________________________________ 8 1.3 Background on the oil and gas industry ___________________________________________ 9 1.3.1 Upstream______________________________________________________________ 10 1.3.2 Midstream _____________________________________________________________ 11 1.3.3 Downstream ___________________________________________________________ 11 1.4 Motivation _________________________________________________________________ 12 2 LITERATURE REVIEW _____________________________________________________________ 13 2.1 Overview __________________________________________________________________ 13 2.2 Trade Policy ________________________________________________________________ 13 2.3 Types of Supply Chains _______________________________________________________ 16 2.4 Disruption or Impacts to Supply Chains __________________________________________ 18 2.5 Reductionism and Case study Methodology ______________________________________ 19 2.6 Conclusion _________________________________________________________________ 20 3 METHODOLOGY ________________________________________________________________ 21 3.1 Overview __________________________________________________________________ 21 3.2 Designing the framework _____________________________________________________ 21 3.3 Validating the framework _____________________________________________________ 23 3.3.1 Introduction ___________________________________________________________ 23 3.3.2 Identifying Participants: __________________________________________________ 24 3.3.3 Constructing and Conducting the Interview ___________________________________ 24 3.3.4 Reviewing the Data ______________________________________________________ 25 4 RESULTS AND ANALYSIS __________________________________________________________ 26 4.1 Results ____________________________________________________________________ 26 4.1.1 Framework 1: Supply Chain Design__________________________________________ 26 4.1.2 Framework 2: Cost ______________________________________________________ 30 5 DISCUSSION ____________________________________________________________________ 33 5.1 To Analyze or not to analyze ___________________________________________________ 34 5.2 Cost versus risk _____________________________________________________________ 35
5.3 Size and its impact __________________________________________________________ 36 5.4 Shorter term _______________________________________________________________ 37 5.5 Mid-term __________________________________________________________________ 38 5.6 Complexity of the product ____________________________________________________ 39 5.7 Not passing on the cost _______________________________________________________ 40 5.8 Limitations_________________________________________________________________ 40 6 CONCLUSION ___________________________________________________________________ 41 REFERENCES _______________________________________________________________________ 42 Appendix A ________________________________________________________________________ 47 Appendix B ________________________________________________________________________ 48 Appendix C ________________________________________________________________________ 50
LIST OF FIGURES
Figure 1.1 Oil and Gas Industry Segmentation (Oil & Gas, 2015) _______________________________ 10 Figure 2.1 Supply Chain Operational Strategies (Naylor, 1999) ________________________________ 17 Figure 3.1 Risk Assessment Matrix Sample (Strauss,2019), (Owens, 2018) _______________________ 22 Figure 4.1 Framework 1: Supply Chain Design _____________________________________________ 27 Figure 4.2 Tariff Avoidance Strategy _____________________________________________________ 28 Figure 4.3 Tariff Reduction Strategy _____________________________________________________ 29 Figure 4.4 Allocating Cost _____________________________________________________________ 31 Figure 5.1 Interviews Plotted vs Framework 1: Supply Chain Design ____________________________ 34 Figure 5.2 Cost vs Risk ________________________________________________________________ 35
LIST OF TABLES
Table 1.1 Crude Oil Refinement Examples (Leffler, 2000) ____________________________________ 12 Table 2.1 Supply Chain Archetypes (Perez, 2013) __________________________________________ 17 Table 3.1 Grouping of Participants ______________________________________________________ 24 Table 4.1 Interviews Plotted vs Framework 2: Cost _________________________________________ 31
1 INTRODUCTION
1.1 Trade Policy and its Impact
The term ‘trade policy’ refers to the rules and regulations around the exchange of goods or services involved in international trade (Scheibe and Blackhurst, 2018). This can take many forms – for example, tariffs, local content requirements, or quotas. One nation’s trade policy with another nation, or nations, is usually focused on reducing trade barriers and promoting trade internally; this policy generally focuses on protectionism, resulting in benefits to domestic firms at the expense of external competitors.The North American Free Trade Agreement (NAFTA) is an example of an international trade policy group.
Trade policies have tremendous impacts on supply chains and their overall design. For example, foreign companies that would like to operate in China are required through trade policy to establish joint ventures with Chinese firms that have a minimum of 50 percent Chinese ownership (Gallagher, 2003). The Chinese automotive market is the largest in the world and represents a significant opportunity for automotive companies. As a result, the leading
automotive manufacturers across the world have established secondary supply chains through joint ventures within China to produce locally and avoid the restrictions imposed on foreign automotive companies. A secondary supply chain refers to a supply chain that has enough redundancies to the first that it could be considered standalone and could operate
independently of the first. This single statute forced a significant portion of the industry to build a brand-new supply chain in China. Similarly, Brazil has forced oil and gas companies through trade policy to assemble and test most of their finished goods in country.
A more drastic impact to supply chain design is the elimination or reduction of a country as a supplier option. A recent example of trade policy reducing a supply chain’s supplier base is India’s recent (September 2019) ban on the exportation of onions to raise domestic prices (Lee, 2019). India is the second largest producer of onions in the world and prior to the ban was the fourth largest exporter of onions (Workman, 2019). This trade policy has created a significant challenge for firms that were sourcing onions from India. It was announced in March 2020, as many suspected, that this trade policy, like many other trade polices India has implemented,
protect or stimulate domestic industries, meet employment targets, and spur technological development (Bown, 2018).
The design of supply chains is not the only thing impacted; trade policies can have major financial impacts as well. A current example at the time of writing this report in 2020 is the US-China trade war. As a result of this trade war, a tariff was applied to steel and aluminum imports to the US. Whirlpool, a home appliance manufacturer, utilizes a significant amount of those raw materials in its products. Whirlpool cited the increase in raw material costs resulting from this tariff as the primary driver for the 15% drop in the company’s share price in 2018. Additionally, Whirlpool’s net income was down $64M in the first quarter compared to 2017 (Olson, 2018).
As noted above, the effects of trade policies have a wide range of severity, from a minor increase in cost to a complete segment of the market being eliminated. One of the reasons for the change in impact to supply chains is the uncertainty surrounding trade policies. A challenge currently facing supply chains is that some trade policies are less permanent than others and have shorter lifespans. In addition to the shorter lifespans, trade policy occurrences have increased in frequency. For example, preferential trade agreements have doubled from 2005 to 2017 in number (Alessandro, 2018). These changes in application have increased the
uncertainty surrounding any given trade policy. This creates a problem for those managing supply chains because while they may be aware that a trade policy is impacting their network, they may not know how best to react.
1.2 Approach
While trade policies are not a novel concept, the combination of severity, shorter lifespan, and greater frequency are unique to the late 2010’s decade. This report will do three things: first, understand how supply chains are currently reacting to this new dynamic; second, propose a framework for outlining how supply chains could respond this new challenge; and lastly, recommend a course of action given a certain supply chain design. This report will utilize semi-structured interviews, case studies, reductionism analysis, and relevant literature on supply chain resilience to propose and validate a framework. This framework will be able to help supply chains make more educated decisions moving forward.
Section 3.1, in greater detail, will outline the general approach of this report and how and why it has evolved. This report originally looked across a multitude of industries to
construct the original framework. After construction of the framework, the scope narrowed to a single industry, as the degree of impact partially depends upon the industry. For example, HubSpot, a software company, does not move physical products across borders and as a result has not been significantly impacted by trade policy (Owens, 2018). Furthermore, the scope narrowed to a single industry for initial validation due to the report timeline and feasibility of research.
The oil and gas industry was selected for a number of reasons. First, the product complexity has variability that ranges from commodity-like to highly complex. This trait is not exclusive to this industry but is not found in every industry, allowing for this framework to be generalized to other similar industries. The product complexity trait will impact a supply chain’s ability to respond (Chae, Mena, Mikaella, Rogers, and Wiedmer, 2019). Second, it is an industry that has been impacted significantly by two current trade policy sources, Brexit and the China-US trade war (Alessandro, 2018; Whaley, 2019). Lastly, it is not uncommon for a small delay of several days to have million-dollar ramifications. The delay of only a few weeks may cost the end user millions of dollars in downtime and this expense is very often passed on to the
supplier in a heavy penalty. The following section will provide a general overview of the oil and gas industry.
1.3 Background on the Oil and Gas Industry
The oil and gas industry can be broken down into three segments – upstream, midstream, and downstream. The following three sections will provide an overview of these business segments. This is not meant to be all-inclusive but instead to provide a general overview of the oil and gas landscape. It is worth noting that some industry overviews may combine midstream with downstream; however, the two are increasingly being broken out due to increasing complexity and importance, especially after the success of recent United States oil and gas shale production (Stetzer, n.d.). In addition, most oil companies do not view midstream as having the same risk profile or asset complexity as the other two segments (Stetzer, 2015). It may be useful to refer to the following figure when reading Sections 1.2.1-1.2.3.
Figure 1.1 Oil and Gas Industry Segmentation (Oil & Gas, 2015) 1.3.1 Upstream
Businesses in the upstream segment fall into two sub-groups: exploration and production (E&P) or services. The main focus of E&P, as one might surmise, focuses on the discovery and extraction of reserves. In industry, reserves refer to the natural gas and crude oil trapped underground. Reserves are found in multiple environments and under a variety of conditions, and as a result, multiple extraction methods exist. For example, conventional vertical well, offshore, oil sands, and shale are all different types of oil fields. Depending on the oil field and several other factors, a firm may access the reserve through different methods, such as horizontal drilling, vertical drilling, or hydraulically fracturing (fracking). Some of these additional factors include the corrosiveness of the reserve, the current cost of crude, how far below the surface the reserve is located, and whether the well require a stimulant to produce. Some firms specialize in a particular style or field type, while others take a broader approach. Not only is the E&P sector very complex, but it is also highly regulated, impacted by multiple factors, and requires significant capital investment (EKT, n.d.).
The services portion of upstream focuses on supporting E&P. Seismic imaging,
exploratory drilling, and geological testing services help with the discovery portion of E&P. Once a source is identified, a service company may be utilized to determine the commercial viability or to consult on how to develop the reservoir. Another significant portion of the service business is the construction and operation of the onshore and offshore drilling rigs, where “onshore” and “offshore” refer to the location of the reserve being located beneath land or seabed. Several firms also specialize in well-completion services such as cementing newly drilled wells (DiLallo, 2019).
1.3.2 Midstream
The midstream segment of the industry focuses on connecting upstream and
downstream; in most cases the oil and gas reservoirs are not located in the same geographic location as the refineries and major consumption regions. Connecting the upstream and downstream segments is achieved through a transportation network utilizing pipelines, trucks, rail, ships, tankers, and barges. Midstream is comprised of field gathering, processing plants, and transmission pipelines (Stetzer, 2015). There is a difference between how the two main products from a reservoir, crude oil and natural gas, are transported. Crude oil is most often consolidated from a local region into a centralized tank. Once a sufficient volume is
accumulated, it is transported via rail, tank, or barge depending on the environment. Natural gas is most often transported via a complex network of pipelines called transmission lines. The midstream business may include items such as compression stations and pipeline
commissioning.
The midstream business is heavily influenced by both upstream and downstream sectors. It depends on a good supply from upstream as well as a strong demand from downstream. Without both a strong supply and demand, the midstream sector tends to struggle. Either not having enough supply to meet downstream needs or having too much product results in flooding the downstream market with cheap product.
1.3.3 Downstream
The downstream process consists of refining the crude oil into products and the
sector as an input and use fractional distillation in the form of heat and pressure to output a variety of useful products. These petroleum output products can be categorized based on the different temperature and pressures required to extract them from the crude oil. Based on Leffler’s work, several examples have been categorized into the light, medium, and heavy distillates and are shown in Table 1.1 (Leffler, 2000).
Table 1.1 Crude Oil Refinement Examples (Leffler, 2000)
The downstream sector is margin-driven – margin being the difference between the cost of buying the crude oil and the price at which the end petroleum product is sold. The price of the crude has significant impact on downstream business.
1.4 Motivation
As supply chains become more global, the dynamic of increasing frequency and
temporary application of trade policies will impact supply chains to a greater extent. As stated above in Section 1.1, the impact to companies that utilize global supply chains is significant from both a monetary and a design perspective. Even if an enterprise does not utilize suppliers or have customers in different countries, it is likely that their extended supply chain has a more global footprint and could be impacted (Millar, 2016).
The subsequent Literature Review suggests that this new phenomenon is increasing in frequency and is unlikely to disappear in the near future. As a result, there is a growing need to understand the options a company has when responding to trade policies. Based on semi-structured interviews of individuals from the oil and gas industry, it appears that firms are not taking a proactive approach and are only reacting to this new challenge. Additionally, no
framework exists for supply chains to evaluate and explore how they could respond to this new dynamic. When faced with this challenge, a company should understand the advantages and disadvantages of potential reactions. This will allow leaders of supply chains to make more
Light Medium Heavy
Gasoline Kerosene Lubricating oils Naptha Jetfuel Asphalt
informed decisions. This capstone supplies recommendations on various courses of action to a given supply chain within the oil and gas industry.
2 LITERATURE REVIEW
2.1 Overview
This capstone analyzed how the new trend of temporary trade policy impacted supply chains, using supply chain archetypes as a basis for building a framework. The Literature Review was required for several reasons. It confirmed the three assumptions made during preliminary research about trade policy in the late 2010’s: one, it was being applied in a temporary
application; two, the severity of impact to supply chains had increased; and three, the frequency of trade policy enactment had increased.
An objective of the Literature Review was to examine current studies on both trade policy and supply chain design to understand how the capstone contributed to the field in a meaningful way. The Literature Review confirmed the simultaneous occurrence of the three trade policy characteristics was unprecedented and a need existed for supply chain leaders to know the range of possible responses.
In addition, the Literature Review defined several terms such as “trade policy”, “supply chain”, and “supply chain archetype”. When defining archetypes, two widely accepted
archetype categorizations were highlighted and the inherent limitations in archetypes discussed. The Literature Review also defined and validated both reductionism and case studies, two methodologies, as reasonable choices for researching this topic.
2.2 Trade Policy
Trade policy is defined as the rules and regulations around the exchange of goods or services involved in international trade (Scheibe & Blackhurst, 2018). This can take many forms – for example, tariffs, local content requirements, or quotas. One nation’s trade policy with another nation, or nations, is usually focused on reducing trade barriers and promoting trade internally; this policy generally focuses on protectionism, resulting in benefits to domestic firms at the expensive of external competitors.The North American Free Trade Agreement (NAFTA) is an example of an international trade policy group.
The rate at which and precisely how trade policies are being applied is changing, and this change is different from historical shifts. To understand the change, it is useful to understand the current global stage and how it came to be. The Great Depression and the reliance on the gold standard can be attributed to the rise of protectionism in the 1930s (Irwin, 2011). This increase in protectionism would lead to the trade wars of the same decade. During this period, tariffs and counter tariffs were exchanged between countries. The commercial interests of the United States, along with several other countries, were threatened as a result of this trade war. The General Agreement on Tariffs and Trade (GATT), a legal agreement between several countries whose primary purpose was to eliminate trade barriers and promote trade, was signed in 1947 (Bown and Irwin, 2019). The negotiations that resulted in the GATT were led by the United States. Following the establishment of a governing body, it was observed that trade barriers gradually declined, and trade growth contributed to global economic prosperity (Bown and Irwin 2019). The 1970s, however, saw an increase in protectionism and a decrease in compliance with the rules laid out by GATT; as a result, the US lobbied for a more effective dispute-settlement system in the 1990s which resulted in the World Trade Organization (Bown and Irwin, 2019). The WTO is the current system used to settle trade disputes.
In the current era, we are, once again, seeing an increase in protectionism as well as the use of temporary trade barriers. For example, “Brazil, China, India, Mexico, and Turkey went from being Temporary Trade Barriers non-users in the late 1980’s to outcomes whereby a substantial share of their import product lines at some point over the next 20 years became covered by these additional forms of non-tariff protection” (Bown, Karacaovali, and Tovar 2014). Furthermore, we see an increase in countervailing duties, safeguards, and Temporary Trade Barriers (TTB) after the recession in 2008 in the world market (Bown, 2018). These protectionist policies resulted from the desire to help shelter or stimulate domestic industries, meet employment targets, and spur technological development.
The following paragraphs highlight how the use of trade policy is changing and why the uncertainty around trade policy is becoming more permanent. Bekkers (Bekkers, 2019) notes three significant contributing factors as to why trade policy events over the last two years indicate a shift in global trade relations. These shifts fundamentally change how trade policies
are being applied. The first item is the withdrawal of the US from the Trans-Pacific Partnership (TPP) and its imposed tariffs on steel and aluminum, which resulted in counter tariffs and increased trade tensions. Second is the uncertainty created around the reduction of judges and the blocking of new appointments for the Appellate Body (AP) of the World Trade Organization (WTO). Third, the United Kingdom is attempting to leave the European Union, the largest free trade area.
Both the manner and context around the steel tariffs are highly unusual and are explored further by Bown and Irwin (Bown and Irwin, 2019). The steel tariffs, enacted in 2018, were unusual because they were imposed using a Cold War era law claiming a threat to national security, thus avoiding an administrative review by independent agencies as per common practice. The national security case was mediocre at best, and surprisingly, significantly impacted an ally of the US. In addition to the uncertainty that the steel tariffs created, we see retaliation tariffs from Canada, China, Mexico, and the European Union, primarily targeting US agriculture exports (Bown and Irwin, 2019). The US is also currently threatening to impose tariffs on Chinese imports from the automotive industry. These actions, especially coupled with the US’s withdrawal from TPP in 2017, significantly increase global trade tension.
In addition to the aforementioned, the US is blocking the reappointment of judges on the AP, arguing that the court is overreaching (NEOnline, 2019). This vetoing of judges has reduced the WTO’s ability to resolve trade disputes between countries. The steel tariffs mentioned above and the current trade war between China and the US exemplify the WTO’s inability to efficiently resolve disputes. This trade war has already seen tariffs and counter tariffs on $360 billion of trade, an unprecedented number (Bown and Irwin, 2019). Without a
strong governing body to arbitrate trade policy between countries, aggressive retaliator trade policy tactics will become a trend.
Most of the existing research around trade polices demonstrates that trade policies are increasing and are being applied in a temporary manner, demonstrating a shift from historical practice(Bown and Crowley, 2014). Bekkers’s studies attempt to predict how trade policy will unfold based upon the development of policy scenarios (Bekkers, 2019). Curran and Eckhardt
explore how trade policy is influenced, and impacted by corporate political activity in the context of global value chains and regime complexity (Curran and Eckhardt, 2018). Bown estimates the impact of aggregate fluctuations on time-varying trade policies of thirteen major emerging economies over the period from 1989 to 2010. The closest study to this capstone proposal is Bown’s attempts in “Trade Policy Toward Supply Chains After the Great Recession” (Bown, 2018). Bown highlights the change in trade policy dynamic and the increase in
application, as well as the TTB and the impacts to intermediate inputs, final goods, and capital goods with a focus on China. There is little to no research on how supply chains are being impacted by this new trade dynamic or how they might mitigate some of the risk, and this is where this capstone aims to expand the domain.
2.3 Types of Supply Chains
In order to understand how trade policy impacts supply chains, it may be useful to define a supply chain. A supply chain is the network used to deliver products and services from raw material to end customer through an engineered flow of cash, information, and physical distribution (Chiu, 2011). Several attempts have been made to group supply chains by
archetypes for study and analysis. The two most common archetypes will be discussed in the following paragraphs.
The first archetype is based on the work of researcher Perez who describes a supply chain archetype as a pattern of the supply chain, which defines the key factors of the business framework, the relevant attributes of a unique value chain, and how the design factors of the supply chain ensure the alignment of the supply chain with the organization’s competitive strategy (Perez, 2013).Perez suggests that there are common supply chain types, which can be grouped by supply chains driven by efficiency and those driven by responsiveness, shown in Table 2.1.
Table 2.1 Supply Chain Archetypes (Perez, 2013)
The second archetype approach is less attributable to a single person and was defined after a cross-analysis of multiple experts, which argue that supply chains can be grouped into six different supply chain structures based on possible operational strategies (Lampel and Mintzberg, 1996; Naylor, Naim, and Berry, 1999; Olhager, 2003; Yang and Burns, 2003). These structures consist of Engineer to Order (ETO), Make to Order (MTO), Assemble to Order (ATO), Purchase to Order (PTO), Make to Stock (MTS), and Ship to Stock (STS). These archetypes are summarized visually in Figure 2.1. The difference between these supply chain types is
dependent on at what point in the process the customer is linked to an order. For example, in an Engineer to Order structure, the customer is involved much earlier in the process compared to a Make to Stock supply chain, and therefore affects the overall process much more heavily.
While both archetypes are certainly useful in studying supply chains, one limitation of these classifications is that not every supply chain will neatly fit into a single archetype. For example, an apparel company’s supply chain shows characteristics of both efficient and responsiveness archetypes as defined by Perez (Guemes-Castorena and Ruiz, 2017). Similarly, Lideöw and Uusitalo explored the use of multiple supply chain archetypes as it relates to the saw mill industry (2015). In addition to the idea that supply chains cannot be perfectly grouped, supply chains are not static and can change their design over time. Changes can further blur the lines between distinct archetypes. Because of this fluidity, it will be more productive to leverage archetype generalizations rather than to focus on how a specific supply chain should be
categorized.
The capstone will leverage the archetype generalizations to understand the trade policy impact of the geographic footprint of supply chains. As an example, a very customer-centric supply chain may have many distribution centers around the world; this supply chain, with its global footprint, will be impacted by trade policy differently than a supply chain with only a single distribution hub. Most research around supply chain design takes a network design perspective and does not often consider international borders. While both valuable, temporary trade policies heavily influence supply chain design and re-design and warrant addition to this research.
2.4 Disruption or Impacts to Supply Chains
Trade policies have tremendous impacts on supply chains and their overall design. For example, A.O. Smith manufactures water heaters, boilers, and storage tanks. A large portion of their business resides within the US. A steel tariff was implemented in 2018 that impacted A.O Smith significantly because steel is a primary component in many of their products. The tariff was cited as a primary driver for the company’s 5% drop in sales and 50% ($22M) reduction in operating cash flow (Power, 2019). Another example of a supply chain being impacted is the Nissan supply chain in 2019. To avoid recently imposed tariffs, the company altered its supply chain design by moving production of its engines from Japan to the US, a significant
Another example of supply chain design being impacted lies within the oil and gas industry. Norway, Tanzania, and Brazil all utilize local content requirements (LCRs) to force companies to invest in the local economies and build, to some extent, secondary supply chains locally (Kolstad and Kinyondo, 2017). Local content requirements are less obvious compared to quotas and tariffs because they are harder to quantify(Gourdon and Guilhoto, 2019). This is why we see an increase in LCR usage after the creation of the WTO, a stronger organization that regulates international trade, in an attempt to gain an economic advantage.
LCRs directly change how a supply chain is designed and operated. Under normal conditions, a company will freely decide between domestic and foreign suppliers in order to maximize profits, among other considerations. However, LCRs require firms to ignore cheaper alternatives on the international market and purchase less competitive and more expensive inputs domestically (Gourdon, J., Bastien, V., and Folliot-Lalliot, L., 2017).
Research concerning trade policy and the impact to supply chain are treated as longer term disruptions. Additionally, existing research attempts to quantify an impact, examine an industry, or study a specific event. The capstone will broadly examine how temporary trade policies impact the design of supply chains and is an emerging concept in the supply chain field.
2.5 Reductionism and Case Study Methodology
Reductionism is when a complex system is reduced to its individual components and the pieces are analyzed to provide a better understanding of how the complex system works. Reductionism has been used in many fields ranging from psychology to physics as a tool to help better understand complex systems (Hartmann, 2001; Heylighen, Cilliers, and Gershenson, 2006). Hartmann argues that this technique is flexible enough to cover a range of phenomena and concrete enough to provide insight into a complex system (Hartmann, 2001). Hartmann uses several case studies, such as nuclear and particle physics, to demonstrate this point. Furthermore, reductionism was used to develop models designed to aid supply chain managers when making complex decisions (Ponte et al., 2016). The prevalent use and specific application in analyzing supply chains lends credibility to the methodology of breaking down trade policy into its pieces and analyzing them individually. After breaking trade policy into its parts, the
public domain, case studies, and researching resilience strategies were used to generate an initial framework.
It has been argued that case study methodology is a valid method of research and often used for supply chain analysis (Kähkönen, 2011). Yin asserts that there is value in conducting qualitative analysis utilizing case studies if they clarify or extend understanding (Yin, 2017). In addition, utilizing case studies to analyze “real-world” examples has been particularly useful in gaining insight on how a system operates (Steven, 1993). Seuring contends that supply chains can be studied using case studies because they allow for direct observation of the field (Seuring, 2008). Voss, Tsikriktsis, and Frolich make a bolder claim that “case research has consistently been one of the most powerful research methods in operations management” (Voss, Tsikriktsis, and Frohlich, 2002). The complexity of trade policy and the multitude of real-world examples make the case study methodology a reasonable choice for researching trade policy impact on supply chains. In addition, this methodology has clarified and extended the understanding of how firms have reacted to trade policy.
2.6 Conclusion
In the above sections, trade policy has been defined and the increase in frequency of application and uncertainty highlighted. Additionally, the Literature Review supports the assertion that trade policy is being applied in a temporary fashion compared to the more permanent applications of the past. While the impact of trade policies on the design of supply chain is evident and has already been studied in a variety of ways, the impacts of this new, less permanent trade policy dynamic have yet to be studied. Most research concerning trade policy has been focused on the long-term trade effects on supply chains design. In the initial literary review, it is apparent that minimal research has explored this less permanent trade policy dynamic and its impact on supply chain design. The literature review provides validation for the need to understand the range of reactions to trade policy. Using reductionism and case studies in combination with supply chain archetypes will be an effective tactic in defining the potential responses.
3 METHODOLOGY
3.1 Overview
A goal of this capstone was to provide a framework for companies to understand the range of potential approaches it might employ to mitigate the effects of trade policy disruption. The methodology is broken into two parts: Section 3.2 Designing the framework and Section 3.3 Validating the framework. In designing the framework, the approach evolved as the capstone progressed. Initially, archetypes were used as the basis for the framework. However, these results were found to be too generic and did not provide enough specificity to be useful, so reductionism, based on data gathered from the literature review and case studies, was employed to expand and complete the initial framework. Limited results of these findings are included in the Methodology section to provide context for understanding the rationale behind the methodology’s expansion; these results will be discussed in greater detail in Section 4 Results and Analysis. In order to validate this framework, semi-structured interviews in combination with snowball sampling are the two main methods used.
3.2 Designing the Framework
Predefined archetypes, identified in the Literature Review, were utilized in the first attempt to develop a framework, as these archetypes would theoretically categorize supply chains and allow for the structuring of insight into how supply chains could potentially react to trade policy challenges. In order to be effective, the framework should be structured based upon these archetypes, as, for example, a supply chain characterized by responsiveness or shorter lead times may be less reactive to a tariff increase compared to a supply chain focused on cost (Guemes-Castorena and Ruiz, 2017). Archetypes have successfully been used as stand-alone solutions to derive insight for a variety of complex issues (Wolstenholme, 2004). For example, Wolstenholme successfully used archetypes to derive insight for labor recruitment (E. F. Wolstenholme and Coyle, 1983). However, they were found to be too general and therefore not as effective as initially perceived with respect to this framework. The generalization of the archetypes led to a multitude of factors within the framework appearing to influence the supply chain design decisions, making it impossible to effectively derive useful insight. For instance,
complexity of the product, end customer location, geographic location of the suppliers, and industry appear to influence the supply chain design
As a result, the capstone’s approach shifted toward the deconstruction of trade policy into its pieces: high uncertainty, high impact, and high frequency. The purpose was to study how each of these individual components impacted supply chains, in order to better
understand the complete picture. There are plenty of existing examples of how these trade policy pieces have impacted supply chains, but not when combined together; for instance, trade policy examples exist where the consequences were severe but unlikely to occur. The expectation, therefore, was that some insight could be gained by looking at the individual impacts. This concept of reductionism is based on the work of Descartes, who argued that to understand any complex phenomenon, you need to reduce it to its individual components and analyze the pieces (Descartes, 1635).
As previously emphasized in the Literature Review, the use of case studies to analyze the complexities of trade policy is a reasonable choice as a methodology. Additionally, the use of case studies allowed the report to study current supply chains’ reactions.
Multiple initial frameworks were constructed utilizing the above methodologies. These initial frameworks allowed supply chains to be viewed in varying lights with the potential for novel insights. Most notably, not all supply chains reacted or were impacted in the same ways. This specific insight triggered a focusing of the capstone. A risk assessment matrix was used to plot the current case studies, Figure 3.1.
Based on this risk assessment, the focus of the capstone was narrowed to analyze supply chains that are in the high frequency and high severity quadrant. Ultimately, a rough framework was constructed for potential responses to trade policy. The following section discusses the methodology used for validating and expanding on this framework.
3.3 Validating the Framework
3.3.1 IntroductionThis capstone is primarily qualitative in nature and leverages semi-structured interviews to understand how and why supply chains are currently reacting to trade policy. Glaser (Glaser and Strauss, 2009) calls for the use of interviews as a tool to analyze qualitative data. He
suggests that interview methodology should be an iterative process of interview and reflection. As observations and emerging theory develop from reflection, future interviews can be shaped to explore these ideas. Interview methodology has been successfully applied to develop models in supply chain. For example, Ross-Anderson created a supply chain model for analyzing
different modes of learning in Aerospace (Rose-Anderssen, Baldwin, Ridgway, Allen, and Varga, 2009).
A secondary reason interviews are a suitable methodology for this capstone is the ability to explore implied supply chain strategy. For instance, the concept of narrowing in on tacit strategy is well-demonstrated by a study exploring the perception and experiences in recruitment and retention of migrant donors among staff members within the blood supply chain (Klinkenberg et al., 2019). Researchers could only guess at the lack of migrant blood donors based on observations and statistics. It was only through interviews that the researchers understood the key motivators and rationale behind the donors’ choices. Similarly, this
capstone developed frameworks based on observational methodologies. Interviews can provide useful insight into why a supply chain reacted the way it did, as well as potentially validate the observations made using the methodologies described in Section 3.2. This explicit understanding is important to this capstone because the design could have the same outward appearance but internally could have different rational for its structure.
The following sections discuss selecting an appropriate interview pool for interviews, overall interview construction, and actual interview practices employed. Sections 3.3.2 and 3.3.3 are adapted from Perez-Franco’s Ph.D. dissertation (2010) entitled, “A methodology to capture, evaluate and reformulate a firm’s supply chain strategy as a conceptual system.”
3.3.2 Identifying Participants
People interviewed fell into the three categories or levels detailed below. This variety allowed for the coverage of the supply chain as it relates to supply chain strategy.
Table 3.1 Grouping of Participants
Level 1 individuals are comprised of vice presidents or other supply chain executives. Level 2 individuals are comprised of leaders within supply chain organizations, such as a sourcing leader or a materials manager. Level 3 individuals are those executing the supply strategy, generally the direct reports of Level 2 employees, a buyer or material planner for example.
It was important that the pool of interviewees was comprised of all three levels in this report. Often in practice, strategy and execution are not perfectly in sync, and this warranted the capture of both the objective as well as the actual execution. In addition to selecting individuals based on their perceived hierarchy within an organization, snowball sampling was employed. Snowball sampling consists of identifying initial individuals to interview and then asking those individuals for additional interview candidates. This non-probability sampling method allowed for the collection of a larger number of interviews within a smaller timeframe and also enabled meaningful interviews within the same or similar business unit.
3.3.3 Constructing and Conducting the Interview
Each interview was scheduled for thirty minutes, and questions were prepared to extend the interview to an hour if the interviewee extended the time. An outline of the interview can
Level 1:
Individuals crafting the supply chain strategy
Level 2:
Individuals providing input into the supply chain strategy
be found in Appendix B. Three types of questions where prepared: warm-up questions, an open-ended question, and semi-structured questions. Warm-up questions were designed to understand what role an interviewee held within their organization, as titles and responsibility vary from one company to the next. In addition to establishing what sub-group (Level 1, 2, or 3) the interviewee fell into, these questions helped establish a rapport between the interviewee and interviewer using “softball” questions. Five minutes were allocated to these questions.
The open-ended question was simply “how has trade policy impacted your supply chain?”. This question was intentionally left vague so as to allow the interviewee to focus on what was most prevalent in their situation. Most interviewees needed no prompting and spoke at length. If the interviewee struggled with or was unable to answer the question, the interview moved on to semi-structured questions. The open-ended section time target was ten minutes.
The semi-structured questions were used to “either revitalize a dying discussion or to explore a particular area of interest that may or not have been mentioned earlier” (Perez, 2010). As a result of utilizing the interview and reflect method mentioned in Section 3.3.1, the questions asked in this portion of the interview evolved after each interview. It was not unusual for questions to arise in the reflection phase of the methodology. This evolution allowed the report to explore different aspects of the supply chain and dive deeper into areas that
appeared potentially useful. When possible, the interviewee was asked follow-up questions to gain clarity. The warm-up questions and open-ended question, however, remained the same for all interviews.
3.3.4 Reviewing the Data
If the interviewee consented to the interview being recorded, a transcript and summary were constructed for faster future reference. If audio was unavailable, notes were used to summarize the interview. The sample of interview summaries are available in Appendix C. As stated in the email request to interview, no attribution towards specific individuals or
businesses would occur in the report, thus all identifying features have been removed from the summaries. In several instances, the interviewee consented to the recording but did not wish to have the summary present in the final report, and thus, his or her interview has not been included.
Multiple attempts were made to organize, identify key patterns, and highlight any
conflicting evidence in the data. In Section 4.1 Results, the framework deemed most useful is shown and discussed in greater detail. In addition to capturing the interview, it was important to investigate the key drivers behind a decision. Different approaches may lead to the same outward physical design, and it is not always possible to infer the reasoning from only
observation of the supply chain. For instance, did a supply chain choose not to change its design or did it choose to not review its supply chain?
4 RESULTS AND ANALYSIS
4.1 Results
The first objective of this capstone was to capture how supply chains within the oil and gas industry are currently reacting to the new trade policy dynamic. The secondary objective was to provide a framework to organizations within this industry that could help them make more informed decisions on potential alterations to existing supply chain designs. Since no current framework exists, a number of segmentations were developed in order to characterize supply chain organizations based on various differentiators, such as product complexity, size of the organization, and segment within the oil and gas industry. The frameworks shown in Sections 5.1.1 and 5.1.2 appear to be useful segmentations based on the perceived practicality for supply chain leaders and depth of insight derived. These frameworks are based on 22
interviews from individuals within the oil and gas industry. These interviews represent multiple companies and 40+ product lines, consisting of 20 upstream organizations, 15 midstream, and 6 downstream. All names and identifying features have been removed to maintain
confidentiality.
4.1.1 Framework 1: Supply Chain Design
Figure 4.1, Framework 1: Supply Chain Design, provides an overview of the decisions that a firm could take when faced with a new trade policy.
Figure 4.1 Framework 1: Supply Chain Design
The initial decision that leadership within a firm has to consider is whether this new tariff and its potential impact warrant further review. Four options are available to a firm that has chosen to review their supply chain: tariff acceptance, tariff reduction, tariff avoidance, and tariff elimination. While these options appear distinct, a firm is not limited to a single approach or a focused analysis when making these decisions; multiple approaches may be employed, and not all decisions need to be made upfront but could occur or change over time. For example, a firm could explore only Sourcing actions initially and later choose to expand and explore Manufacturing options. The following paragraphs will discuss the four options of the “Review Supply Chain” approach in greater detail.
4.1.1.1 Tariff Acceptance
A tariff acceptance approach is described as the firm not changing the design of it supply chain and accepting the cost increase resulting from the tariff. It should be noted that this approach is different than a firm not reviewing their supply chain. While the outward appearance of both options remains the same (no physical change), tariff acceptance indicates that analysis has been performed and a firm has deliberately chosen not to change their network design.
4.1.1.2 Tariff Avoidance
A tariff avoidance strategy attempts to evade the tariff completely, usually by changing to a manufacturer or supplier in a different country. This would mean that the original
manufacturer or supplier would no longer supply the firm with material. Consider the following example in Figure 4.2: a business located in Country A is sourcing parts from Supplier 1 in Country B. A tariff is applied in Country A that taxes all imports from Country B. As a result, the business located in Country A initiates a tariff avoidance strategy and begins sourcing from within Country C. As shown in the figure, items are no longer sourced from Supplier 1 post-tariff, and therefore, the business located in Country A has successfully avoided the tariff.
Figure 4.2 Tariff Avoidance Strategy 4.1.1.3 Tariff Reduction
As the name implies, a tariff reduction strategy is centered around reducing the overall impact of a trade policy. A tariff reduction approach contains a wider range of options
compared to the other three sub-groups under the Review Supply Chain category. For instance, the firm could diversify its supplier base, increase the efficiency of the current supply chain, or add a process to reduce the impact of a trade policy. Because of these three options and to provide more specificity, tariff reduction was broken down further into three segments: diversification of suppliers, diversification of manufacturing, and changing the efficiency of the supply chain.
Diversification of suppliers or manufacturing means the number of suppliers or
manufacturing sites increases in a way that reduces the impact of a trade policy. For example, in Figure 4.3, Country A initially sources from Supplier 1 in Country B. A tariff is applied in Country A that taxes all imports from Country B. As a result, the business located in Country A adopts a tariff reduction strategy and divides its order volume between suppliers in Country B and Country C. It is importance to note the difference between a tax avoidance and a tax reduction strategy: with reduction, the tariff is not completely avoided because the business located in Country A still sources some percentage of volume from Country B, where the tariff is being applied.
Figure 4.3 Tariff Reduction Strategy
Changing the efficiency of the supply chain is the third approach a firm can take to reduce the impact of a new trade policy. This approach does not directly target the tariff but rather focuses on reducing the net cost of the supply chain by, for example, holding Kaizen events or removing non-value-add processes to increase efficiency. One such improvement could be implementing a barcode system to reduce non-value-add time associated with
receiving items into a warehouse. The effectiveness of this strategy would be directly related to how efficient a supply chain was before the tariff was applied and the level of efficiency gained through these actions. Perhaps contrary to what one might expect, tariff impacts can also be
reduced by the addition of a process to the supply chain. Adding a duty drawback process, for example, in which certain taxes are refunded to the organization, would reduce the net impact of a tariff.
4.1.1.4 Tariff Elimination
The last distinct group defined in Framework 1 is a tariff elimination strategy. In this approach, a firm attempts to eliminate the potential tariff impact for a product or sub-component. There are a variety of ways in which this elimination can be achieved. One possibility would be engineering around or engineering out a sub-component, or another option could be regionalizing the supply chain. Engineering around refers to when a component has significantly changed to alter its or harmonization code upon import. The ability to engineer around or out a sub-component is dependent upon the sub-component and will range from simple to impossible. For example, building a car without a frame would be quite challenging compared to building a car without the wood interior styling components, which likely have a viable substitute. In addition to these strategies, a management team may take a more drastic approach and decide to no longer serve a particular region or customer because it no longer wishes to manage imposed trade restrictions or costs. For example, within the oil and gas industry, it is not unusual for countries to incorporate local-content requirements in their trade policies. As a result, a firm may choose not to do business with a particular country if they do not desire to navigate these requirements.
4.1.2 Framework 2: Cost
In addition to potentially changing the design of a supply chain, leadership will have to decide how to allocate the additional cost of a tariff. The way cost is handled potentially impacts supplier relationships, customer relationships, and influences the design of the future supply chain. For this reason, Figure 4.4 was constructed which shows how leadership could potentially allocate cost.
Figure 4.4 Allocating Cost
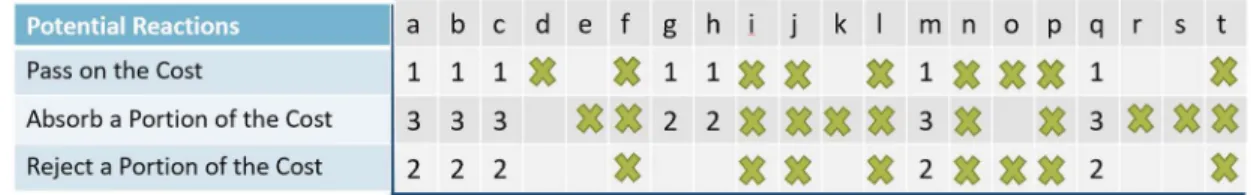
This figure may seem trivial but was not immediately obvious to several of those interviewed. Figure 4.4 simplifies and clarifies what options leadership within a firm can adopt when determining the cost impacts of a tariff. Essentially there are three approaches to the increase in cost: first, the firm can increase their product’s sale price to cover the tariff’s financial impact, essentially passing on the tariff to the customer; second, the firm can push back on the suppliers and force them to absorb the financial impact of the tariff; and third, the firm can assume some or all of the tariff’s financial impact. Table 4.1 plots the interviewees responses with Framework 2: Cost.
Table 4.1 Interviews Plotted vs Framework 2: Cost
The letters ‘a’ through ‘t’ represent the 22 different interviews. The different approaches of Framework 2: Cost are listed on the left-hand side of the table. A green “X” denotes that a given supply chain attempted or reviewed a given approach. As a result of reflecting on each interview, seven of the interviewees were asked to elaborate on the order in which their supply chain attempted to manage the cost allocation. This is denoted by the use of numbers within the table, ‘1’being the first response the firm attempted. Table 5.1 will be referred to throughout Section 5 because it provides a useful summary of the interview data.
4.1.2.1 Pass on the Cost
A pass on the cost approach attempts to transfer the tariffs impact to the customer. This can be achieved several ways. The price of the end product can be raised, or a tariff fee can be added as an expense line item on the sales order. As can be seen in Figure 4.1, 16 of the interviewees’ supply chains attempted to take this approach. When asked why, interviewees stated that it was the easiest approach and the increase in price to the customer would not be a surprise given the recent publicity around trade wars.
4.1.2.2 Reject the Cost
This approach attempts to decrease the cost increase from a supplier or push the
additional burden of the tariff upstream to the supplier. The supplier may own the goods during transportation to the firm and consequently is responsible for the tariffs. In this case, suppliers usually attempt to pass this cost on to their customers by either increasing the price of the goods or adding a separate expense line to the purchase order. This attempt was used by several of the supply chains but not all. Based on the data, it appears that the size of the firm and supplier played a role in a firm’s ability to negotiate. Smaller firms seem to be less likely to engage and win against larger suppliers. Large and small firms where defined using Statista’s ‘Top 100 Oil & Gas’ list which uses a firm’s revenue, number of employees, and end of fiscal year numbers to compile their list (Top 100 Companies, 2018). If a firm was included on the list, it was considered large and if omitted, the firm was considered small.
4.1.2.3 Absorb a Portion of the Cost
This approach occurs when the firms does not pass on the full financial cost or declines to accept the full cost from the supplier. This approach is usually the last of the three
approaches explored because the organization assumes some financial burden. It is necessary to note that the firm may not assume the full portion of the trade impact. For example, the firm may succeed in passing on 50% of the cost to the end customer but may be unsuccessful in declining the increase from their supplier. This necessitates the firm being responsible for the
absorbed at least a portion of the cost. However, in one particular case, a firm chose to increase the end product’s sale price by more than the cost of the tariff – an interesting strategy which will be discussed in Section 6.7.
5 DISCUSSION
In the Discussion Section of the report, the insights gained from segmenting the data in different ways will be explored. This section’s objective is to provide a more comprehensive explanation of how different variables impact a firm’s choices when using Framework 1: Supply Chain Design. For example, the firm’s size or product complexity may make a particular reaction more appropriate than an alternative. In addition, the limitations of the methodologies
employed for this report will be analyzed, as well as alternative methodologies that could be used to discover other insights for responding to trade policy. Furthermore, the pros and cons of various framework decisions will be explored in this section.
As stated in Section 3, the interview data was anonymized to maintain confidentiality. This data was combined with Framework 1: Supply Chain Design to produce Figure 5.1. The letters ‘a’ through ‘t’ represent the 22 different interviews. Framework 1: Supply Chain Design’s different approaches are listed on the left-hand side of the table. A green “X” means that a given supply chain attempted or reviewed a given approach. When segmented differently, it appears that several trends emerge. Figure 5.1 will be referred to throughout the following sections because it provides a useful summary of the interview data.
Figure 5.1 Interviews Plotted vs Framework 1: Supply Chain Design
5.1 Should You Review the Supply Chain?
Why wouldn’t leadership within a firm review their supply chain if a trade policy
impacted their supply chain? First, someone within the supply chain must be aware that a trade policy has been implemented and that it impacts their supply chain in order to then advocate for the review. It is challenging for a person or organization to stay up to date on all the trade policies being implemented. Thus, an organization may not know about a trade policy
impacting them immediately.
Several reasons exist for why a preliminary review may occur – a firm often learns about a trade policy when importing or exporting products. Other times, the trade policy is widely publicized – the US-China trade war, for example. In one example given by an interviewee, the overall cost increased, and leadership was not sure why, indicating that the leadership team was not aware of the trade policy and its impact upon their organization.
A firm may also recognize that a trade policy is impacting them to some degree but may choose not to review it further. There are several reasons why a firm may choose not to
proceed with a more formal and in-depth review. For example, there may be something taking precedence over the perceived tariff impact. In two interviews, product lines chose not to review their supply chain because the organization was focused on meeting a new industry
standard. This makes sense given that not meeting industry regulations would prohibit the sale of its products regardless of the trade policy impact. In a different interview, the focus was on delivering a project to a customer on time. In a third example provided, it was simply too time consuming and complicated to accurately capture the cost of the impact.
5.2 Cost versus Risk
It appears, based on the data collected, that in general as a firm moves from tariff acceptance to tariff elimination, the cost increases and the risk decreases to the firm. This concept is summarized in Figure 5.2. The interviewees highlighted the cost differences between starting a new manufacturing plant, switching suppliers, and accepting the tariffs when asked to elaborate on the cost analysis they had done in reviewing their supply chain.
Figure 5.2 Cost vs Risk
Cost, in this particular case, can mean time, money, or resources. Assuming that the data is representative of the industry, if a firm wanted to reduce the risk of a tariff’s impact to its operation, the amount of risk reduction would be inversely related to the cost spent by the firm. For example, a larger cost is generally associated with engineering out a component part compared to accepting the cost. However, it is not always possible or feasible to achieve tariff elimination or find an alternative supplier in another country. For instance, China produces 90% of the world supply of rare earth metals (Vincent, 2018), or in the early 1900’s, rubber
production was controlled almost entirely controlled by the British empire (Finer, 1926). One might assume that if an inverse relationship exists between cost and risk, a firm that has more resources would be better suited to take on the challenges presented by trade policies. In the subsequent section, a firm’s size and its impact on its response to trade policy will be explored.
5.3 Size and its Impact
Based on the interviews and observed evidence, the size of the organization played a role in how a firm responded. A smaller firm would likely have less capital and fewer resources compared to a larger firm and would likely, therefore, be more challenged to exercise all of the possible options laid out in Framework 1. As a result, one might conclude that larger firms are better equipped to take on the challenges of a new tariff, yet as several interviewees pointed out, even though tariffs are applied universally, the impact is not shared evenly between large and small firms. In fact, two interviewees even stated that smaller firms are actually better equipped to take on trade policy impacts. The interviewees highlighted two points: first, smaller firms were more regionalized, and second, smaller firms were leaner.
Based on sourcing data from several product lines and interviewees, almost all the small firms sourced their raw materials locally, supporting the interviewees’ regionalization assertion. When asked why this was, one interviewee offered the inability to take advantage of
economies of scale with the purchase of casting or forgings, for example. For the two small firms that did not source all their material regionally, both had negotiated a longer-term agreement with a supplier in another country. However, these firms did have local backup vendors that could supply the same parts if necessary.
In addition to highlighting that smaller firms tend to be regionalized, an interviewee also highlighted that smaller firms tend to be “leaner” and quicker to respond to change when compared to larger organizations. The interviewee felt that this “leanness” was driven by the need to compete with the bigger firms’ ability to leverage economies of scale. What was implied by the use of the word “leaner” was that smaller firms have already taken more non-value add cost out of the supply chain and operate much closer to optimal when compared to a larger firm. As a result, it is unlikely that small firms will be able to effectively take advantage of all the options laid out in Framework 2. For example, a small firm will have considerably less leverage compared to a large firm when trying to pass on the increase in cost to a customer or will struggle with raising capital to build a new manufacturing site.
5.4 Short Term
One of the benefits of interviews was the ability to understand how and why supply chains developed in the face of trade policy impacts over time. The general trend that appears to emerge from the data is that firms tended to gravitate towards approaches that required the least amount of effort to solve the problem. As supply chains realized the impacts and
persistence of trade policy, there is an increase in effort and cost to mitigate or eliminate the impact of trade policies in the future.
In 35 of the 41 supply chains represented, the interviewees’ first reaction was to take a tariff avoidance strategy and switch suppliers. However, after completing a supplier analysis, the majority of the product lines discovered switching suppliers did not make financial sense due to hidden costs involved in a switch. These costs included the cost to find an alternative supplier, the cost to make sure the alternate supplier has the necessary capacity, quality, and lead-time, and the costs to do all associated system and administrative set up. In addition to reviewing the sourcing strategy, all the supply chains represented in the interviews took an early tariff reduction strategy by changing the efficiency of their supply chain. The most popular method to increase the efficiency of the supply chain was supplier consolidation, Figure 5.2. When asked why supplier consolidation was so popular, several of the interviewees gave the explanation that by consolidating suppliers, they were able to increase volumes and get a better discount. In addition to the discount, it would reduce the complexity in the supply chain, reduce the logistics costs, and fewer suppliers are easier to manage.
After focusing externally, many of the supply chains looked internally to change the efficiency of the supply chain. Several held Kaizen and lean events to eliminate processes and streamline the overall supply chain. Conversely, two supply chains added a process to reduce the impact of the tariffs. Both supply chains added a duty drawback process to capture the refund of duties upon exportation to the final customer.
A short-term approach that one supply chain employed, which runs the risk of upsetting suppliers, was changing the incoterms. Incoterm is a term used to define the responsibilities between a buyer and a seller. For instance, depending on the incoterm, the point of delivery, transaction costs, insurance cost, and export formalities will either be the seller’s or buyer’s
responsibility. This particular organization originally owned the product from the supplier’s dock and transported it across international borders. As a result, this organization had to pay the new tariff associated with this purchase. To avoid the tariff, the organization quietly changed the terms of their purchase order to take ownership upon arrival at its dock, which meant the supplier took responsibility for shipping and any transportation and border fees. Being a larger organization themselves, this supplier did not realize the change for several months. Eventually, upon realizing this cost increase to their own organization, the supplier adjusted the cost of the product accordingly. In the author’s opinion, this is a rather sneaky tactic and not a very effective strategy long term.
5.5 Mid-term
Based on the interview responses and as time progressed, supply chains began to move towards the right side of the spectrum shown in Figure 5.1. Three supply chains chose to diversify their supply chains, which may seem odd to the outside observer. First, these supply chains spent time and effort to reduce the number of suppliers and then changed strategy to actually increase the number of suppliers. Upon further instigation, their goal was to add suppliers outside of the tariff-effected area; these supply chains were strategically adding suppliers in order to reduce the risk of being single-sourced. These three organizations
acknowledged that their overall cost increased but accepted this, as it reduced their overall risk. Five of the twenty-two interviewees highlighted the consolidation of manufacturing as an approach to reducing the impact of a trade policy. It is important to note that all of these supply chains had already been consolidated prior to the interviews. When asked to expand upon the consolidation strategy, interviewees noted the savings as the primary driver for consolidation. Previously, these organizations had operated multiple manufacturing sites around the world, all working similar operations; through consolidation, these firms eliminated significant costs associated with running a manufacturing plant, such as overhead and salary costs. The savings far outweighed the impact of a tariff. While it is conceivable that a supply chain could take this approach, this would generally be considered a longer-term approach, given the expense and time required to close and consolidate a manufacturing site. There are