Dysfunction of cortical GABAergic neurons leads to
sensory hyper-reactivity in a Shank3 mouse model of ASD
The MIT Faculty has made this article openly available.
Please share
how this access benefits you. Your story matters.
Citation
Chen, Qian et al. "Dysfunction of cortical GABAergic neurons leads
to sensory hyper-reactivity in a Shank3 mouse model of ASD."
Nature Neuroscience 23, 4 (March 2020): 520–532 © 2020 The
Author(s)
As Published
http://dx.doi.org/10.1038/S41593-020-0598-6
Publisher
Springer Science and Business Media LLC
Version
Author's final manuscript
Citable link
https://hdl.handle.net/1721.1/130404
Terms of Use
Creative Commons Attribution-Noncommercial-Share Alike
Dysfunction of Cortical GABAergic Neurons Leads to Sensory
Hyper-reactivity in a Shank3 Mouse Model of ASD
Qian Chen1,†, Christopher A. Deister2,†, Xian Gao1,3, Baolin Guo3,4, Taylor Lynn-Jones1,
Naiyan Chen1, Michael F. Wells3, Runpeng Liu1, Michael J. Goard5,6, Jordane
Dimidschstein3,7, Shijing Feng8, Yiwu Shi9, Weiping Liao9, Zhonghua Lu8, Gord Fishell3,7,
Christopher I. Moore2,*, Guoping Feng1,3,*
1McGovern Institute for Brain Research, Department of Brain and Cognitive Sciences, Massachusetts Institute of Technology, Cambridge, MA, USA
2Department of Neuroscience, Brown University, Providence, RI, USA
3Stanley Center for Psychiatric Research, Broad Institute of MIT and Harvard, Cambridge, MA, USA
4Department of Neurobiology, School of Basic Medicine, Fourth Military Medical University, Xi’an, China.
5Department of Molecular, Cellular, and Developmental Biology, University of California, Santa Barbara, Santa Barbara, CA ,USA
6Department of Psychological & Brain Sciences, University of California, Santa Barbara, Santa Barbara, CA ,USA
7NYU Neuroscience Institute, New York University Langone Medical Center, New York, NY, USA 8Guangdong Provincial Key Laboratory of Brain Connectome and Behavior, The Brain Cognition and Brain Disease Institute, Shenzhen Institutes of Advanced Technology, Chinese Academy of Sciences, Shenzhen, China
Users may view, print, copy, and download text and data-mine the content in such documents, for the purposes of academic research, subject always to the full Conditions of use:http://www.nature.com/authors/editorial_policies/license.html#terms
*Corresponding author: Guoping Feng (fengg@mit.edu) and Christopher I. Moore (Christopher_moore@brown.edu) .
†These authors contribute equally to this work: Qian Chen and Christopher A. Deister Contributions
Q.C., C.A.D., C.I.M. and G. Fengdesigned experiments and wrote the paper. Q.C., C.A.D., X.G., B.G., T.L.J., N.C., R.L. performed experiments. C.A.D. wrote the MATLAB code and did the data analysis. M.F.W. generated Shank3B conditional knockout mouse. S.F., Z.L., M.J.G., Y.S. and W.L. did part of data analysis and interpretation. J.D. and G. Fishell designed and provided the Dlx5/6 promoter.
Competing financial interests
The authors declare no competing financial interests. Reporting Summary
Further information on research design is available in the Life Sciences Reporting Summary linked to this article. Data Availability
Raw data could be obtained from corresponding author upon reasonable request. Code Availability
HHS Public Access
Author manuscript
Nat Neurosci
. Author manuscript; available in PMC 2020 September 02. Published in final edited form as:Nat Neurosci. 2020 April ; 23(4): 520–532. doi:10.1038/s41593-020-0598-6.
A
uthor Man
uscr
ipt
A
uthor Man
uscr
ipt
A
uthor Man
uscr
ipt
A
uthor Man
uscr
ipt
9Institute of Neuroscience and Department of Neurology of the Second Affiliated Hospital of Guangzhou Medical University, Key Laboratory of Neurogenetics and Channelopathies of Guangdong Province and the Ministry of Education of China, Guangzhou, 510260, China
Abstract
Hyper-reactivity to sensory input is a common and debilitating symptom in individuals with autism spectrum disorders (ASD), but the neural basis underlying sensory abnormality is not completely understood. Here we examined the neural representations of sensory perception in the neocortex of a Shank3B−/− mouse model of ASD. Male and female Shank3B−/− mice were more sensitive to relatively weak tactile stimulation in a vibrissa motion detection task. In vivo population calcium imaging in vibrissa primary somatosensory cortex (vS1) revealed increased spontaneous and stimulus-evoked firing in pyramidal neurons but reduced activity in interneurons. Preferential deletion of Shank3 in vS1 inhibitory interneurons led to pyramidal neuron
hyperactivity and increased stimulus sensitivity in the vibrissa motion detection task. These findings provide evidence that cortical GABAergic interneuron dysfunction plays a key role in sensory hyper-reactivity in a Shank3 mouse model of ASD and identify a potential cellular target for exploring therapeutic interventions.
Introduction
Autism spectrum disorders (ASD) are highly heritable neurodevelopmental disorders, characterized by abnormalities in social interaction, repetitive behaviors, language and deficits in communication1,2. Atypical sensory responses are now part of the ASD diagnostic criteria (DSM-5). These sensory abnormalities are broad but include hyper-reactivity/ sensitivity to sensory input. Human fMRI3 and animal model studies4,5 suggest that cortical circuit abnormalities could contribute to altered sensory representations, but a direct demonstration of this has been lacking. Among the cell types implicated, cortical GABAergic interneurons are gaining more attention. Interneuron dysfunction has been observed in many animal models of ASD4–7. Further, recent work has linked GABAergic neuronal defects to multisensory integration deficits in mouse models of ASD4,8. However, a direct causal link between cortical GABAergic interneuron dysfunction and sensory
abnormalities in ASD has not been established.
In this study, we used Shank3B knockout (Shank3B−/−) mice9 as a model to explore the neural mechanisms underlying sensory abnormalities. SH3 and multiple ankyrin repeat domains 3 (SHANK3) is a critical postsynaptic scaffolding protein that is required for glutamatergic synaptic development and function10. Deletions and mutations of the Shank3 gene cause Phelan-McDermid syndrome with high prevalence of ASD. Genetic deletions/ mutations of the Shank3 gene in mice leads to glutamatergic synaptic dysfunction and ASD-relevant behavioral abnormalities9,11–14. In this study, we trained Shank3B−/− mice and their wild type (WT) littermates to perform a vibrissa motion detection task and found that Shank3B−/− mice were more sensitive to weak vibrissa deflections. To test whether the hypersensitivity has a neocortical basis, we used in vivo two-photon calcium imaging to monitor neuronal activity in the somatosensory cortex of both WT and Shank3B−/− mice. Calcium imaging revealed increased spontaneous and stimulus-evoked activity in pyramidal
A
uthor Man
uscr
ipt
A
uthor Man
uscr
ipt
A
uthor Man
uscr
ipt
A
uthor Man
uscr
ipt
neurons, but reduced activity in interneurons in Shank3B−/− mice. Preferential-deletion of Shank3 from interneurons was also associated with pyramidal neuron hyperexcitability and sensory hypersensitivity. These data suggest that neocortical interneuron dysfunction in Shank3B−/− mice is key to the emergence of abnormal pyramidal neuron hyperexcitability and sensory hypersensitivity in this monogenic model of ASD.
Stimulus hyper-reactivity in Shank3B
−/−mice
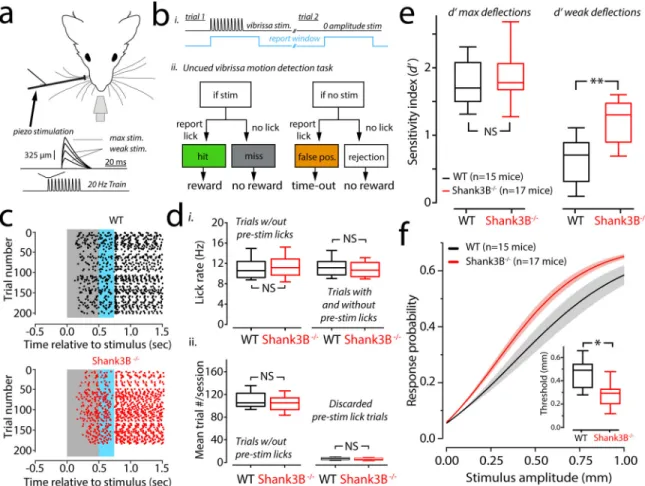
To investigate whether Shank3B−/− mice exhibit any deficits in tactile sensitivity we trained both Shank3B−/− mice and their WT littermates to perform a tactile detection task. Head-fixed and water restricted mice were presented with randomly timed periodic vibrissae deflections (Fig. 1a) and could earn a water reward by licking within a ‘report window’ that was timed to the onset of a stimulus (Fig. 1b, i). The frequency of the stimulus was fixed, but the strength was varied by scaling the amplitude (Fig. 1a, inset). The task was on a “go/no-go” format and thus had four possible trial outcomes: a ‘hit’ if the animal licked correctly in response to a stimulus, a ‘miss’ if the animal did not lick when a stimulus was presented, a ‘false positive’ if the animal licked in response to a zero-amplitude stimulus (catch-trial) or a ‘correct rejection’ if the animal correctly ignored a zero amplitude stimulus (Fig. 1b, ii). The ratio of hits to all stimulus trials, and the ratio of false positives to all catch-trials were used to determine the hit rate and false positive rates (or false alarm rates). Using these estimates of hit- and false-positive rates, the sensitivity index d-prime (d’) was determined for each animal. d’ is a standard metric for scoring detection-sensitivity from signal detection theory15–17, it is a metric that quantifies how separated an animal’s responses to noise are from their responses to a true signal (Supplementary Figure1a). In addition to calculating d’, we determined the related metric ‘criterion location’ to quantify an animal’s bias towards reporting true positives versus false positives (Supplementary Figure 1b). Criterion location is an important metric because animals can, in theory, improve their performance without a true change in sensitivity if they report more false positives (i.e., by guessing more often). We found no differences in the relationship between d’ and criterion between WT and Shank3B−/− animals (Supplementary Figure 1c). Throughout the experiments, all littermate pairs of WTs and Shank3B−/− animals showed no differences in weight (mean weights ± s.e.m. of WT /Shank3B−/−: first three sessions: 22.0 ± 3.0 grams/23.6 ± 3.7 grams; last three sessions: 21.6 ± 2.9/23.0 ± 3.9 grams; p=0.68 and p=0.54, n=10 in each group; bootstrap mean-difference test). Moreover, WT and Shank3B−/− mice did not show differences in their lick rates (Fig. 1d), which we assessed to rule out the potential of motor differences between WT and Shank3B−/− mice. Fig.1c shows lick rasters from a WT (Fig. 1c, top) and a
littermate Shank3B−/− mouse (Fig.1c, bottom). The data shown in Fig.1c, which included all trials that showed no pre-stimulus licking, were compared across sessions and animals and showed no rate differences between WT and Shank3B−/− groups (Fig. 1d, i, left). We also found no difference in lick rates between WT and Shank3B−/− mice, even if trials with pre-stimulus licking were included (Fig. 1d, i, right). There was no significant difference in the total number of trials performed per session (Fig. 1d, ii, left). Moreover, there was no difference in the number of trials discarded due to pre-stimulus licking (Fig. 1d, ii, right), suggesting that both groups of mice had similar levels of impulsivity.
A
uthor Man
uscr
ipt
A
uthor Man
uscr
ipt
A
uthor Man
uscr
ipt
A
uthor Man
uscr
ipt
In order to compute d’ and construct psychometric detection curves we first computed the hit-rate and false alarm rate for all stimuli across six sessions in which the animals experience with the task overlapped (Supplementary Figure 2a). Previous work has shown that somatosensory cortex contributes most to the detection of weak stimuli, closer to perceptual threshold16,18. Thus, we examined detection performance with respect to strong, readily detectable maximal stimuli (1 mm), and more ambiguous weak stimuli (0.2–0.5 mm) (Supplementary Figure 2). False alarm rates appeared similar for WT and Shank3B−/− mice. We further analyzed the trials that comprised the last three overlapping sessions where performance had stabilized for all mice (Supplementary Figure 2). First, we examined sensitivity differences by computing d’ for strong and weak stimuli. Maximal d’ for Shank3B−/− and WT animals was not significantly different (Fig. 1e, left). However, d’ for weaker stimuli computed for the same behavioral sessions was significantly higher in Shank3B−/− when compared to WT animals (Fig. 1e, right). We then constructed
psychometric curves for Shank3B−/− and WT mice (Fig. 1f) by determining hit-rates for a range of stimulus amplitudes. The psychometric curve of Shank3B−/− mice show a leftward shift relative to WT mice. We quantified this shift by comparing the thresholds in our samples. We found that threshold for WT mice was significantly higher than that of Shank3B−/− mice (Fig. 1f insets). Taken together, these data show that Shank3B−/− mice are more sensitive to vibrissae stimuli than their WT counterparts are.
Increased spontaneous and stimulus-evoked neuronal activity in Shank3B
−/−
mice
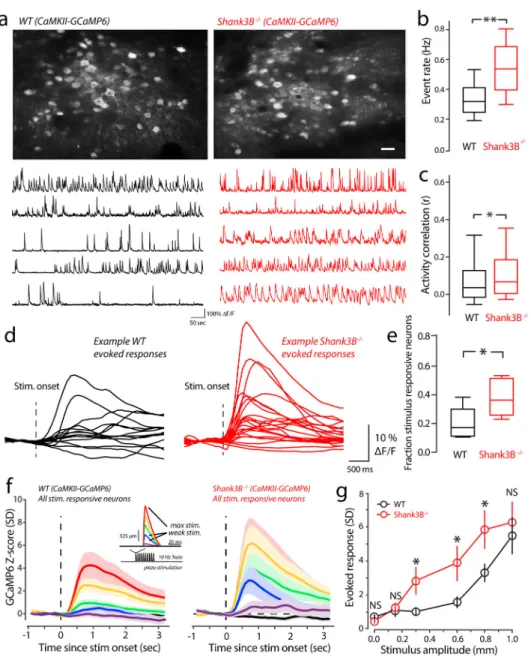
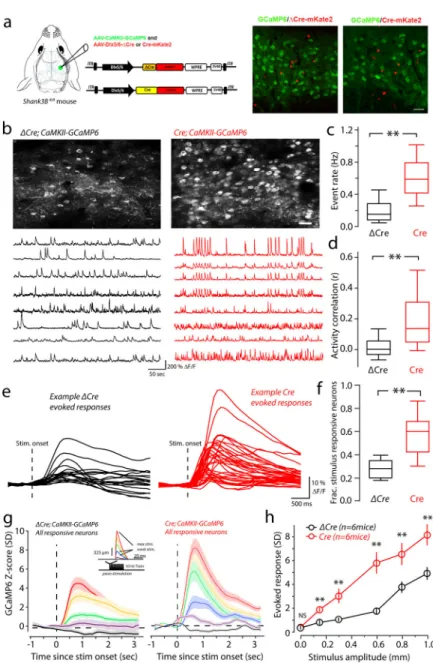
To study network mechanisms underlying stimulus hypersensitivity in Shank3B−/− mice, we performed large-scale in vivo two-photon calcium imaging in head-fixed awake WT and Shank3B−/− mice. We used the excitatory-specific human CaMKIIα promotor to drive the expression of the genetically encoded calcium indicator GCaMP6f (referred throughout as GCaMP6)19. Our imaging fields contained 68–112 neurons (mean ± s.e.m.: 84±12). First, we compared the spontaneous GCaMP6 activity of vS1 between Shank3B−/− and WT mice. Interestingly, we found that Shank3B−/− mice showed higher calcium event rates compared to their WT counterparts (Fig. 2a & 2b). Between our sample groups, we observed a small, but significant, increase in pairwise correlation of spontaneous firing in Shank3B−/− mice (Fig 2a, example traces; Fig 2c). It is well established that when neuronal rate increases correlations will increase as well, even beyond increases in chance spike overlap due to more spikes being discharged18. Although, many factors could lead to different correlations between neurons despite those neurons firing at the same rate under different conditions, one factor that has been previously studied is changing the balance of excitation and inhibition20. We studied the relationship between pairwise rate and correlations by computing the
geometric pairwise mean and correlation for all pairs in each imaging session, we then pooled these data and took the mean and standard error of the mean for three overlapping rate bins (Supplementary Figure 3a). For WT mice there was a linear dependence on rate and correlation (linear fit; regression slope=0.2; p=0.03, linear regression F-Test). For Shank3B−/−, the correlation/rate relationship was relatively flat across the rates examined (linear fit; regression slope=0.02, p=0.43, linear regression F-Test). These results suggest
A
uthor Man
uscr
ipt
A
uthor Man
uscr
ipt
A
uthor Man
uscr
ipt
A
uthor Man
uscr
ipt
that the correlation increases in Shank3B−/− are the result of circuit alterations and not just a simple rate change.
We next determined if stimulus-evoked responses were also enhanced in Shank3B−/− mice. We performed in vivo two-photon imaging of excitatory neurons as mice received randomly timed and variable amplitude piezo-driven vibrissa deflections (Fig. 2f, inset), just as in our detection task. Fig. 2d shows representative example that are the evoked-response from all stimulus-responsive neurons in a WT and Shank3B−/− imaging session. The average-proportion of stimulus responsive neurons found in WT mice was 0.26 ± 0.08 (mean ± s.e.m.), which is within the range of previous studies in awake vS121–23 However, the proportion of stimulus responsive neurons in Shank3B−/− mice was significantly higher at 0.52 ± 0.11 (Fig. 2e, mean ± s.e.m.).In addition to an increase in the proportion of stimulus responsive neurons in Shank3B−/− mice compared to WT, we found enhanced evoked responses across most of the range of stimulus-amplitudes used in our detection task. To quantify this, we constructed an average peri-stimulus time histograms (PSTHs, see the methods) for WT and Shank3B−/− mice (Fig. 2f). Visual comparisons of the WT and Shank3B−/− PSTHs showed clear differences, with an overall enhancement of Shank3B−/− activity. In order to more quantitatively compare these differences, we plotted the mean peak evoked-response (Fig. 2g) for both WT and Shank3B−/−. The strongest and weakest
deflections showed no significant difference (Fig. 2g). As in our behavior, we found the largest differences in evoked responses around the intermediate stimulus range. These results show that layers II/III pyramidal neurons in vS1 of Shank3B−/− are more active and sensitive to external stimuli.
Shank3B
−/−mice showed hypo-neuronal activity in inhibitory
somatosensory cortical neurons
Shank3 is a major scaffolding protein at glutamatergic synapses, coordinating the recruitment of many postsynaptic signaling molecules10,24. Our group and others have shown that Shank3 deletion causes a reduction in glutamatergic synaptic
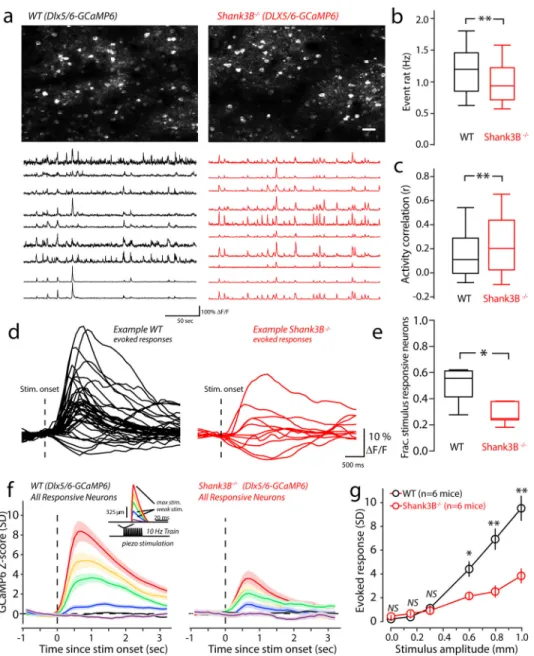
transmission9,11,14,25. We were intrigued by our calcium imaging results that showed increased activity of cortical pyramidal neurons in Shank3B−/− animals. Sparse stimulus evoked activity in layers II/III of WT vS1 is known to be dependent upon stimulus-evoked feedforward inhibition22,26,27, which is a mechanism that ‘balances’ stimulus-evoked feedforward excitation using strong, time-lagged inhibition26–28. Recently, deficits in parvalbumin circuits within the insular cortex and vS1 of Shank3B−/− mice have been reported4,29. We hypothesized that inhibitory circuit disruption in somatosensory cortex may cause excitatory neuron hyperactivity in Shank3B−/− mice. To test this, we performed two-photon calcium imaging selectively from inhibitory neurons of the vS1. We performed unilateral injections of AAVs expressing GCaMP6 under the control of the GABAergic specific Dlx5/6 promoter, a recently developed tool for GABAergic interneuron-specific expression30. We injected AAV-Dlx5/6-GCaMP6 into vS1, which resulted in selective expression of GCaMP6 in inhibitory neurons of vS1. As predicted, Shank3B−/− mice showed reduced spontaneous calcium event rates (Fig. 3a & 3b). Correlations in the spontaneous firing of inhibitory neurons in WT and Shank3B−/− mice were more
A
uthor Man
uscr
ipt
A
uthor Man
uscr
ipt
A
uthor Man
uscr
ipt
A
uthor Man
uscr
ipt
pronounced than excitatory neurons (Fig 3a, example traces; Fig 3c). Because we observed a significant decrease in firing rate of inhibitory neurons, an increase in correlations is not likely the result of a simple change in the rate of the population. We studied the relationship between rate and correlation and found this relationship was not simply linear in either WT or Shank3B−/− mice (Supplementary Figure 3b). It shows high correlations between low-rate pairs and high-rate pairs, whereas moderate-rate pairs have low correlations. Overall, there was an increase in mean correlation among low and high rate pairs in Shank3B−/− mice. We also examined stimulus-evoked activity in inhibitory cells, as we had for excitatory cells (Fig. 3d). We found the number of stimulus responsive neurons was significantly reduced in Shank3B−/− mice (Fig. 3e). Further, a comparison of PSTHs constructed from all stimulus-responsive inhibitory cells in WT and Shank3B−/− neurons revealed that over most of the stimulus-range Shank3B−/− inhibitory cells showed significantly lower-magnitude responses than WT mice (Fig.3f, and 3g). Thus, inhibitory neurons in vS1 of Shank3B−/− are
hypoactive.
Preferential Shank3 deletion in vS1 inhibitory neurons also causes
inhibitory neuron hypo-excitability and excitatory neuron hyper-excitability
It remains unclear whether Shank3 deletion in interneurons is the cause of the hyperactivity of the pyramidal neurons, or the downregulation of interneuron activity is an indirect byproduct of a lifetime of abnormal circuit development in these mice. To address this, we aimed to delete Shank3 in the inhibitory neurons of vS1 using the Dlx5/6 promotor-driven Cre recombinase in the Shank3B conditional mice (Shank3Bfl/fl) which we generated29. Previously, the Dlx5/6 promotor was characterized to be highly selective in expressing fluorescent and optogenetic-proteins in inhibitory neurons, but its ability to restrict Cre-expression to inhibitory cells was not found to be consistent in all cases, because trace amount of Cre could be sufficient for recombination30. To determine how selective an AAV-Dlx5/6-Cre-mKate2 (Dlx5/6-Cre) construct is at deleting Shank3 in interneurons, we performed single-cell PCR from neighboring inhibitory and excitatory layer II/III vS1 neurons (Supplementary Figure 4). We screened 42 excitatory neurons and 33 inhibitory neurons from three AAV-Dlx5/6-Cre injected Shank3Bfl/fl mice. Shank3 was deleted in every inhibitory neuron examined. However, 23.15±3.34% of the excitatory neurons also showed Shank3 deletion. Thus, the use of the Dlx5/6-Cre construct in vS1 of Shank3Bfl/fl mice leads to preferential deletion of Shank3 in inhibitory interneurons.
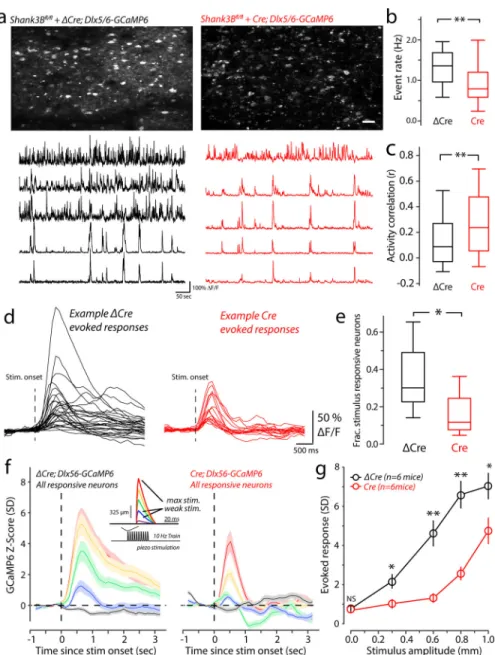
For controls, we used a construct in which the catalytic domain of Cre recombinase was deleted (AAV-Dlx5/6-ΔCre-mKate2, Dlx5/6-ΔCre). We used AAV-Dlx5/6-GCaMP6 to monitor activity of inhibitory neurons in vS1. Strong GCaMP6 signal in layer II-III inhibitory neurons was detected by two-photon microscopy in both Dlx5/6-ΔCre and Dlx5/6-Cre virus injected Shank3Bfl/fl mice (Fig. 4a). Compared with Dlx5/6-ΔCre-injected Shank3Bfl/fl mice, those neurons infected with Dlx5/6-Cre showed significantly lower calcium event frequency among inhibitory neurons, similar to that seen in Shank3B−/− mice (Fig.4a & 4b).We observed an increase in spontaneous activity correlations among inhibitory cells (Fig.4a, example traces; Fig.4c), just as we did for inhibitory cells in the Shank3B−/−
A
uthor Man
uscr
ipt
A
uthor Man
uscr
ipt
A
uthor Man
uscr
ipt
A
uthor Man
uscr
ipt
mouse. The relationship between rate and correlation for inhibitory neurons in the local knockout condition was very similar to that of the Shank3B−/− mouse, but overall the differences between Dlx5/6-ΔCre and Dlx5/6-Cre injected mice were more pronounced (Supplementary Figure 3c). Also similar to Shank3B−/− mice, Dlx5/6-Cre injected (local Shank3B knockout) mice showed more lower-rate pairs with higher correlations, and some high-rate pairs that also showed increases.
We also examined stimulus-evoked activity in inhibitory neurons in those mice. The proportion of stimulus responsive neurons was significantly reduced in Dlx5/6-Cre-injected Shank3Bfl/fl mice (Fig 4d & 4e). PSTHs show reduced evoked activity in Dlx5/6-Cre-injected, relative to Dlx5/6-ΔCre-injected Shank3Bfl/fl mice (Fig. 4f). These differences were significant for all of the stimulus amplitudes (Fig. 4g). These results show that preferential deletion of Shank3 in GABAergic interneurons can cause hypoactivity of in layer II-III interneurons of vS1.
After establishing that Shank3 deletion from inhibitory cells causes the hypo-excitability of interneurons, we hypothesized that the excitability of excitatory neurons would be increased consequently. To test this, we used the same Dlx5/6-Cre and Dlx5/6-ΔCre strategy to delete Shank3 from vS1 inhibitory neurons, but also monitored GCaMP6 activity in excitatory neurons by driving its expression via the CaMKII promoter (Fig. 5a). As we predicted, the frequency of spontaneous Ca2+−events was dramatically increased in Dlx5/6-Cre-injected Shank3Bfl/fl mice (Fig. 5b&5c and Supplementary Videos 1 & 2). In addition to an increase in excitatory neuron firing rates in the local knockout condition, we found that correlations in spontaneous firing was significantly increased in Dlx5/6-Cre-injected compared to Dlx5/6-ΔCre-injected Shank3Bfl/fl mice. (Fig 5b, example traces; Fig 5d). For Dlx5/6ΔCre -injected Shank3Bfl/fl mice there was a linear dependence on rate and correlation
(Supplementary Figure 3d; linear fit; regression slope=0.21 p=0.03, linear regression F-Test). For Dlx5/6-Cre -injected Shank3Bfl/fl mice, the correlation/rate relationship was relatively flat across the rates examined (linear fit, regression slope=0.02, p=0.6, linear regression F-Test). These results are similar to those observed in WT/Shank3B−/− comparison, but the increase in correlations are higher in the local Shank3B knockout. Evoked activity was also increased in excitatory neurons of Dlx5/6-Cre-injected mice. The proportion of excitatory neurons that were stimulus responsive was significantly higher in Dlx5/6-Cre-injected mice (Fig. 5e & Fig 5f). Further, comparisons of stimulus-responsive neuron’s PSTHs showed significant increases in the magnitude of vibirssa-evoked activity across all the stimulus amplitudes examined (Fig. 5g and 5h). Taken together, these results support the hypothesis that deletion of Shank3 in interneurons results in a reduction of cortical inhibition and thereby increasing the amount of excitation in the cortical circuit.
Preferential deletion of Shank3 in interneurons causes stimulus
hyper-reactivity
It remains unclear if vS1-specific hyperexcitability will also lead to sensory hypersensitivity. To directly test this we trained Shank3Bfl/fl animals injected with AAV-Dlx5/6-Cre-mKate2 and injected with AAV-Dlx5/6-ΔCre-mKate2 for the detection task. The injected animals
A
uthor Man
uscr
ipt
A
uthor Man
uscr
ipt
A
uthor Man
uscr
ipt
A
uthor Man
uscr
ipt
showed similar unilateral spread of Cre or ΔCre as measured by post-hoc examination of mKate2 expression in fixed tissue (Fig. 6a and Supplementary Figure 5).
Similar to the results from WT and Shank3B−/− mice, we found that the relationship
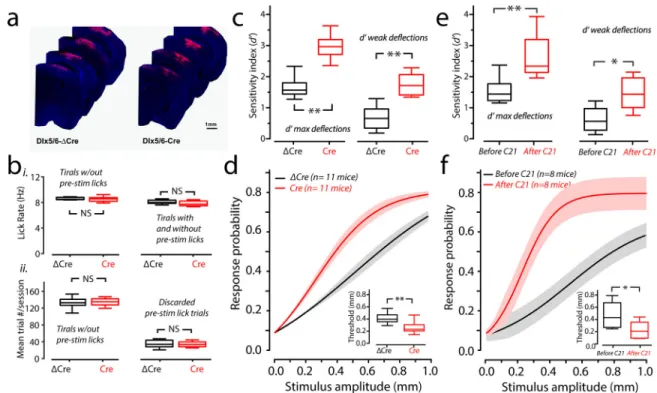
between apparent sensitivity (d’) and response bias were the same between Dlx5/6-ΔCre and Dlx5/6-Cre-injected mice (Supplementary Figure 6). We also found no difference in weights between groups throughout the experiments (mean weights ± s.e.m. of Dlx5/6-Cre and Dlx5/6-ΔCre: First three sessions: 24.7 ± 2.6 grams; 23.3 ± 3.2 grams, n= 6 mice in each group; p=0.8, bootstrap mean-difference test; Last three sessions: 23.9 ± 2.4; 23.0 ± 3.1 grams, n= 6 mice in each group; p=0.8, bootstrap mean-difference test). Lick rates
determined on just the analyzed trials which did not include those with pre-stimulus licks, or when we computed lick rate including discarded trials with pre-stimulus licks were not significantly different between Dlx5/6-ΔCre and Dlx5/6-Cre-injected mice (Fig. 6b, i). The average number of trials per session included for analysis were not different (Fig. 6b, ii, left), nor were the number of trials discarded per session (Fig. 6b, ii, right). To determine if Dlx5/6-Cre-injected mice were more sensitive than Dlx5/6-ΔCre, we computed d’ for strong and weak stimuli. d’ for strong and weak stimuli. Maximal d’ for ΔCre and Dlx5/6-Cre was significantly different (Fig. 6c, left). Further, d’ for weaker stimuli computed for the same behavioral sessions was also significantly different between ΔCre and Dlx5/6-Cre animals (Fig. 6c, right). The psychometric curve of the Dlx5/6-Dlx5/6-Cre-injected mice was leftward-shifted (Fig. 6d) indicating that their response rates to weaker stimuli are greater than Dlx5/6-ΔCre-injected mice. As predicted, Dlx5/6-Cre-injected mice had a lower threshold than Dlx5/6-ΔCre-injected mice (Fig. 6d inset).
Because we observed leakage of Dlx5/6-driven Cre expression in ~20% excitatory neurons we set out to determine what effect sparse and selective deletion of Shank3 from vS1 excitatory neurons, if any, would have on firing rates and detection behavior. We used diluted virus to titrate our injections and achieved ~40% infection of AAV-CaMKII-ΔCre-mKate2 (CaMKII-ΔCre) or AAV-CaMKII-Cre-AAV-CaMKII-ΔCre-mKate2 (CaMKII-Cre) excitatory neurons in vS1 of Shank3Bfl/fl mice (Supplementary Figure 7a & 7b). We found that the spontaneous activity and evoked response of excitatory neurons in CaMKII-Cre injected Shank3Bfl/fl mice were significantly reduced (Supplementary Figure 7c & 7d–g). Overall detection performance was also reduced in Shank3Bfl/fl mice injected with CaMKII-Cre. The psychometric curve for CaMKII-Cre-injected Shank3Bfl/fl mice (n=9 mice) showed an in-significant increase in threshold relative to CaMKII-ΔCre-injected Shank3Bfl/fl mice (Supplementary Figure 7h). However, there was a reduction in performance of CaMKII-Cre injected Shank3Bfl/fl mice (Supplementary Figure 7h). These data suggest that deletion of Shank3B just in a proportion of excitatory neurons does not improve stimulus sensitivity, as we observed in Shank3B−/− mice or the interneuron-biased local Shank3B knockout. Consistent with this, CaMKII-Cre and CaMKII-ΔCre-injected mice showed similar d’ values for strong and weak stimuli (Supplementary Figure 7i). The reason we observed a rightward shift in the psychometric curve without a reduction in d’ was because false-alarm rates and stimulus-response rates were lowered by a similar proportion. Thus, Shank3B deletion in excitatory neurons leads to reduced spontaneous and evoked activity in excitatory neurons, as well as blunted detection behavior. Both of these results are qualitatively opposite of those
A
uthor Man
uscr
ipt
A
uthor Man
uscr
ipt
A
uthor Man
uscr
ipt
A
uthor Man
uscr
ipt
observed in the Shank3B−/− mice, and the interneuron-biased local Shank3B deletion condition.
We next sought to determine if down regulation of inhibition alone was sufficient in explaining the results seen in network dynamics and detection performance observed in Shank3B−/− mice. To determine this, we used an inhibitory chemogenetic approach. We injected an AAV-Dlx5/6-hM4Di in vS1 of WT mice. We made acute in-vitro slices to determine the effectiveness of our Dlx5/6-hM4Di construct, and the DREADDs-agonist C21 (Supplementary Figs. 8a&b). We then imaged the activity of excitatory neurons using CaMKII-GCaMP6 in vivo from Dlx5/6-hM4Di-injected mice and trained them to perform the detection task. After mice showed proficiency in the task, we injected mice with the hM4Di agonist C21 (2 mg/kg) and imaged spontaneous and evoked neural activity as well as their performance on the detection task. We found an increase in spontaneous, evoked activity and correlation among excitatory neurons (Supplementary Figs. 8c–h), just as we had in the Shank3B−/− condition, and the local Dlx5/6-driven Shank3B deletion.
Chemogenetically-driven inhibitory neuron downregulation led to markedly similar effects on detection-task performance as the local inhibitory-neuron biased Shank3B knockout condition. We found that the d’ for strong and weak whisker deflections were increased after injecting the DREADDs-agonist C21 (Fig. 6e). Psychometric curves showed a significant leftward-shift after C21 injection (Fig. 6f). This result is consistent with precious findings in vS1 that optogenetically reducing the PV neuronal activity can enhance the mouse
performance in detection task31. These results demonstrate that preferential deletion of Shank3 from vS1 interneurons is sufficient to drive behavioral sensory hyper-reactivity.
Discussion
Sensory hypersensitivity has been observed in several mouse models of ASD and related neurodevelopmental disorders, including Mecp2−/− and Fmr1−/− 4,7 mice. Recent studies in ASD mouse models of Mecp2, Shank3 and Gabrb3 have shown that peripheral sensory neuron dysfunctions contribute to somatosensory defects including gentle touch8,29. Our results show that deficits in central nervous system circuits significantly contributes to sensory abnormalities in Shank3B−/− mice. The sensory hypersensitivity in Shank3B−/− mice correlates with a hyper-activity of cortical pyramidal neurons. Preferential deletion of Shank3 in cortical inhibitory neurons is sufficient to cause a hyper-active cortical pyramidal neuron network and sensory hyper-reactivity. Impaired inhibitory neuron function has also been found in many other models of ASD4,32,33. Our current study provides evidence that dysfunctional excitatory synaptic transmission in cortical interneurons likely results in their hypo-activity and consequently contributes to sensory hyper-reactivity in the Shank3 mouse model of ASD.
A significant proportion of autistic individuals experience perceptual abnormalities2,34,35. Although Shank3 expresses throughout the brain, it is enriched at both cortico-striatal and cortico-cortical synapses9,36,37 and could lead to deficits in both local and long-range cortico-cortical interactions. Recent work4,38 indicated that the cortex of Shank3B−/− mice is in a hyperexcitable state throughout early development, ultimately contributing to abnormal associative interactions between cortex and striatum. In order to further understand the
A
uthor Man
uscr
ipt
A
uthor Man
uscr
ipt
A
uthor Man
uscr
ipt
A
uthor Man
uscr
ipt
mechanisms responsible for the hyper-excitable state of Shank3B−/− mice, we focused on somatosensory cortex and used a head-fixed ‘go/no-go’ based sensory detection task to probe perceptual disruptions in Shank3B−/− mice. These experiments showed an intrinsic stimulus sensitivity enhancement in Shank3B−/− mice. We found that motivational variables such as lick rates and criterion were similar across WT and Shank3B−/− animals and thereby allowed for fair comparisons of sensitivity measures across groups. The relatively short training time needed for WT animals to learn the detection task may prove to be an essential feature for probing perceptual abnormalities in disease models15,17.
In addition to changes in rate among excitatory and inhibitory neurons, we observed increases in pairwise correlations between both types of cells in Shank3B−/− mice. For the excitatory neurons, we found both a net increase in rate and correlations. It has been
established in the theoretical literature that rate and correlation are inexorably linked, at least when neurons are driven to fire at different rates with excitation alone18. We found a significant relationship between rate and correlation among excitatory neurons in WT mice, but this relationship was altered to some degree in Shank3B−/−, and the local Dlx5/6-Cre-driven Shank3B knockout mice. The specific cellular and network-level reasons for this correlation change, and its importance, remains to be determined. However, excitatory and inhibitory conductance could influence neuronal correlations differently20. Therefore, it is possible that the increased correlations among excitatory neurons we observed reflects a reduction in inhibition driven by Shank3 deletion. We also observed a net increase in correlations among inhibitory neurons in the knockout conditions, and in those cases, the average rates were significantly decreased. Since inhibitory neurons are strongly coupled to each other, and inhibitory neuron activity is reduced when Shank3 is deleted, we can hypothesize that the overall trend for correlations to increase among inhibitory cells is also due to a reduction of inhibitory conductance among them. Our data do not address why there is a group of low firing rate inhibitory neurons with very high correlations in the WT mouse in the first place, and if they are truly distinct from the higher firing rate inhibitory neurons. What possible benefit, or disruption, correlation and/or synchrony changes may have for autistic mouse models of cortical sensory processing, that are independent of rate alone, is an interesting topic, but our data only begins to approach.
The disruption of E-I balance has been implicated in schizophrenia, autism and intellectual disabilities. It has previously been suggested39 that autism and other related disorders might reflect an increase in the ratio between excitation and inhibition that leads to
hyperexcitability of cortical circuits. Similarly, E-I balance is thought to be disrupted in epilepsy. It is worth noting that autistic individuals develop epilepsy at a rate up to 25 times that of the general population40. We did not observe spontaneous epileptic seizures in Shank3B−/− mice. Nevertheless, excitatory neurons of primary sensory cortex (S1) were hyper-excitable and interneuron activity was reduced, suggesting a disruption of E-I balance. Furthermore, we found in Shank3B−/− mice showed differences in perceptual performance and evoked-responses of the excitatory neurons only for weaker whisker deflections, not in strong deflections. However, there was a difference in the evoked-response of inhibitory neurons in Shank3B−/− mice even for strong stimuli. And also, we found difference in perceptual performance and evoked-responses of the excitatory neurons both in weaker and strong deflections where we knocked Shank3B from just vS1 interneurons of adult mice.
A
uthor Man
uscr
ipt
A
uthor Man
uscr
ipt
A
uthor Man
uscr
ipt
A
uthor Man
uscr
ipt
Together, these results suggest that the nervous system of Shank3B−/− mice may have compensated during development in order to normalize the representations of strong sensory stimuli despite having less inhibition to work with. There are many possible ways to achieve this, one parsimonious explanation is lemniscal-thalamic drive to S1 may have been
downregulated in development to achieve similar sensory responses in cortex for the most unambiguous stimuli. Understanding more of how the central nervous system contributes as a whole to ASD-phenotypes is an interesting topic for further study.
Methods:
Animal Use
All experiments were conducted under the guidelines of the Division of Comparative Medicine, with the protocol approved by the Committee for Animal Care of the
Massachusetts Institute of Technology. Shank3B−/− and Shank3 conditional knockout mouse line was generated by our lab as described in previous study9,29 and bred in house on a 12 h light/dark cycle (lights on at 7:00, lights off at 19:00) with food and water available ad libitum. A mix of male and female C57BL/6 mice (4~6-month-old) were used for experiments. All experiments using Shank3B−/− mice were performed in age matched littermates from breeding pairs between Shank3B+/− heterozygous animals. All animal experiments and data analysis were performed with experimenters blinded to genotypes.
Un-cued tactile Behavioral test
Surgeries: On the day of surgery, mice were induced into an anesthetic state with 3% isoflurane (in O2) and injected with 0.1 mg/kg IP buprenorphine (an opiate analgesic).
Meloxicam (1 mg/kg, subcutaneous) was administered pre-operatively and every 24 hours for 3 days to reduce inflammation. Isoflurane was lowered until mice reached a stable anesthetic plane; at which time the isoflurane was typically 1.5–2 %. The head is shaved from the nasal septum up to the occipital bone (between ears) and ointment is applied to each eye. The mouse is positioned in a stereotactic head holder/gas mask. The surgical area is cleaned by 70 % alcohol and 2 % iodine solution. The scalp overlying the dorsal skull was removed. The periosteum was removed with a scalpel. An autoclaved titanium headpost was cemented to the exposed skull using strong dental cement (C&B Metabond; Parkell). After head plate implantation, mice recovered for at least five days before beginning water restriction. ~4–6-month-old male and female WT (n=15) and Shank3B−/− (n=17) mice used for behavior test. For locally deleting Shank3B from the interneurons in vS1, ~4-month-old male and female Shank3Bfl/fl mice (n=11) were unilaterally injected with AAV2/8
-Dlx5/6-Cre-mKate2 or AAV2/8-Dlx5/6-ΔCre-mKate2 (control, n=11) in vS1and the head plate was
implanted. For locally deleting Shank3B from the excitatory neurons in vS1, ~4-month-old male and female Shank3Bfl/fl mice were unilaterally injected with AAV2/8
-CaMKII-Cre-mKate2 (n=9) or AAV2/8-CaMKII -ΔCre-mKate2 (control, n=7). For chemogenetic
inhibition of inhibitory neurons in vS1, 3~4-month-old male and female wide type mice were unilaterally injected with AAV2/9-Dlx5/6-hM4Di-p2a-nlsdTomato(n=8) or AAV2/9
-Dlx5/6-dTomato-p2a-nlsdTomato (control, n=8). Mice recovered for two weeks to let the virus expression before the beginning of water restriction.
A
uthor Man
uscr
ipt
A
uthor Man
uscr
ipt
A
uthor Man
uscr
ipt
A
uthor Man
uscr
ipt
Behavior/Water-Restriction: Animals were placed on water-restriction for at least seven days (1~1.25 ml/day) prior to training. We interacted with animals almost daily as they were habituated to the behavioral apparatus and the researcher. Whiskers were restrained by placing them in a hoop made from silk suture thread that was closed 2–3 mm from the base of the whiskers. This restrainer was attached to a piezo-electric plate bender (Noliac; CMBP09). At the beginning and end of each session, we confirmed that the restrainer was in the same place and held the same whiskers as when the experiment started. On the first two day of training, we focused on associating licking from an acrylic lick-port with whisker stimulation. After this conditioning session (100–200 trials), mice performed our behavioral task with 300–400 trials of mostly highly perceptible stimuli. Once they displayed
proficiency with the task (signal detection statistic for strong stimuli, d’>1), all sessions were converted to 20 % catch trials and stimuli drawn from a random interval allowing for coverage over their entire perceptible range. Mice typically ran 12–14 sessions before being taken off water restriction. The data collection was randomized. Mice were rotated across behavioral rigs between each session to avoid any biasing of behavior toward a specific rig. Further, the training sequence of the animals was randomized across training days. For the chemogenetic manipulations, mice were trained 11 sessions before the administration of the C2141 (2mg/kg, Intraperitoneal injection, HelloBio). From 12 to 14 sessions, mice were administrated with C21 one hour before the training.
Behavioral control was conducted using custom routines written in MATLAB (Mathworks) to interface with National Instruments DAQ boards. The piezo actuator was controlled by piezo driver (Noliac). The stimulus was a 20 Hz train of ten stimuli that each consisted of a fast cosine wave onset with a time to peak of 6 ms (from caudal to rostral) and a slow cosine return with a time to peak of 20 ms (from the deflected rostral point back to rest). For maximum-amplitude deflections, vibrissae moved approximately 1 mm at the point of contact. The stimulation amplitudes were calibrated using a high-speed camera. Lick detection was made using an IR emitter/receiver pair (SparkFun; SEN-00241) centered across the tip of the lick-spout; the IR pair was calibrated daily. Solenoid valves (NResearch Inc.; 161T011) gated water flow and vacuum return.
There were no stimulus cues and all behavior were done in a dark room with white masking noise present. Stimulus timing was essentially random: each trial had a fixed time of 8 seconds from a behavioral control perspective, but we randomly chose a time to insert a stimulus between 1 and 6 seconds after trial onset. The stimulus amplitude was chosen randomly except for catch-trials (stimulus amplitude = 0 mm) and maximal stimuli (stimulus amplitude = 1mm were interleaved randomly, but had a fixed frequency. In addition, any false alarms (licking during the report window on a catch trial) led to 20 second time out. Data analysis: No mice or data points from our experimental groups were excluded from analysis. Trials were included for analysis from behavioral sessions in which mice just began to show proficiency in the task, were engaged with the task, and completed at least fifty trials without pre-stimulus licking. We excluded trials where animals licked 500 ms before the onset of a stimulus. Trials for detection tasks are not initiated by the subject. Thus, the number of trials that mice would complete in a session was dependent on their experience and motivation. We had a maximum amount of time would allow any mouse to stay on a rig,
A
uthor Man
uscr
ipt
A
uthor Man
uscr
ipt
A
uthor Man
uscr
ipt
A
uthor Man
uscr
ipt
but all mice would complete their trials before this time elapsed. However, because the number of trials each mouse would complete was variable, we allowed mice to run until they abstained from licking over a large block of trials, regardless of how detectable the stimulus was, which we interpreted as the animal disengaging from the task. In some cases, a mouse would disengage for a noticeable block of trials, but then re-engage. We developed an empirical method to detect the period(s) in which the mouse disengaged from the task and used it to set an “engagement threshold” to exclude disengaged trials. This method involved taking the moving average of the binary responses and stimulus amplitude using a 50-trial wide window. This resulted in a time-series showing 50-trial wide trends in response probability and stimulus amplitude fluctuations. As mice reached the end of a session, their average response rate would begin to slowly drift towards zero and skew the response distribution towards zero. We empirically determined that the amount of skew (difference in median and mean) of the stimulus distribution, relative to its bottom-third was similar to the proportion of skew in the response distribution and its bottom third when disengaged trials at the end of a session were manually removed. Thus, we defined an engagement threshold as the bottom third of the response distribution corrected for the proportional difference between its statistics and that of the stimulus distribution. Any block of trials that were below this line were excluded from analysis.
Psychometric curve construction: Psychometric curves show the relationship between stimulus amplitude and detection rate. To test if these curves were different between Shank3B−/− mice we compared the mid-points (threshold) and slope-factors (k) of the curve fits for each mouse. The “threshold” in this case corresponds to the deflection amplitude that leads to a successful report more than half of the time, relative to the false alarm rate. We binned responses (hits or misses) based into one of five stimulus amplitude bins. We similarly grouped false-alarms and correct rejections for all catch-trials (trials with a zero-amplitude stimulus). We computed the hit-rate for each zero-amplitude bin, and the false-alarm rate and fit a sigmoidal function to the resulting amplitude vs. response rate data. The sigmoidal function of the form: y=max/(max+e(threshold-X)/slopeFactor)). Where X is the independent variable (stimulus amplitude) and the fit parameters are: a) the threshold which is the amplitude that leads to 50% of the maximal response, b) max, which is the maximal response, and c) slope-Factor, which is the slope of the resulting sigmoid near the threshold. Curve fits were performed in MATLAB using a Non-linear least squares method. All fits had an adjusted R-squared >0.95 and a threshold within our stimulus range.
Virus injection and cranial window preparation
Mice were anesthetized using isoflurane (3% for induction, 1.5–2% during surgery). and injected with 0.1mg/kg IP buprenorphine (an opiate analgesic). Meloxicam (1mg/kg, subcutaneous) was administered pre-operatively and every 24 h for 3 days to reduce inflammation. The head is shaved from the nasal septum up to the occipital bone (between ears) and ointment is applied to each eye. The mouse is positioned in a stereotactic head holder/gas mask. The surgical area is cleaned by 2 % iodine and 70 % alcohol solution. The scalp overlying the dorsal skull was removed. The periosteum was removed with a scalpel. A 3 × 3 mm piece of skull was removed above the somatosensory cortex as determined by stereotactic coordinates, and the dura was kept intact and moist with saline.
A
uthor Man
uscr
ipt
A
uthor Man
uscr
ipt
A
uthor Man
uscr
ipt
A
uthor Man
uscr
ipt
To express GCaMP6f in pyramidal neurons of the primary somatosensory cortex, adeno-associated virus AAV2/8 carrying the construct CaMKII-GCaMP6f (GCaMP6f under the
neural-specific human CaMKIIα promoter, 1 × 10¹² genome copies/ml) was injected at a depth of ~200 μm to the primary somatosensory cortex (5~6 sites, the center of the injection area is : 1.5 mm post the lambda suture , 2.5 mm from the mild line suture) of adult male and female C57BL/6J WT and Shank3B−/− mice (4–6-month-old, n=6 in each groups). For expression of GCaMP6 in GABAergic neurons, GCaMP6 in AAV2/8 under the Dlx5/6 promoter adeno-associated virus was injected in the primary somatosensory cortex of 4–6-month-old male and female WT and Shank3B−/− mice (n= 6 in each groups). For conditional knockout Shank3 in interneurons and imaging neuronal activity in inhibitory or excitatory neurons in Shank3Bfl/fl mice, AAV2/8-Dlx5/6-GCaMP6 or AAV2/8-CaMKII-GCaMP6 virus
and AAV-Dlx5/6-Cre-mKate2 were injected in to the somatosensory cortex at a ratio of 1: 3. Small volumes (~20 nl) of viral suspension were delivered over a period of 5 min per site using a Nanoject II micro-injector (Drummond scientific, Broomall, PA, USA).
For the cranial window, two coverslips were joined with ultraviolet curable optical glue (NOR-138, Norland). A smaller (3 mm diameter) insert fit into the craniotomy and a larger piece (5mm diameter) was attached to the bone. A custom-designed head plate was cemented on the cranial window with Meta-bond (Parkell).
In vivo two-photon calcium imaging
To reduce the anxiety behavior related to the head fixed strategy, we let the animal adapt the imaging environment prior to imaging. Two weeks after viral injection mice were moved to two-photon imaging room and each mouse was head fixed on a custom-made mouse strain system for 30 min, once per day for five days. For each imaging experiment, mice were head-fixed in the restraint and placed under the two-photon microscope for 15 min before the experiments started. Mice were imaged two rounds of spontaneous firing without whisker stimulation. And the mice were imaged with the whisker stimulation driven by piezo after the mice trained (4~5 weeks after virus injection). The stimulation method and rigs were identical to the tactile detection behavior test.
In vivo two-photon imaging was performed as described previously42. Briefly, the imaging was performed on a custom two-photon laser-scanning microscope (Ultima; Bruker) coupled with a Mai Tai Deep See laser (Spectra Physics). The laser was operated at 910 nm (~30–40 mW average power on the sample). The emission filter set for imaging GCaMP6
fluorescence consisted of a 575-nm dichroic mirror and a 525/70 nm band-pass filter. Fluorescence signal was detected using Hamamatsu multialkali PMTs. In most experiments, images were acquired at frame rates of 10 Hz at a resolution of 128 × 100 pixels using a 20×, 1.0 NA water-immersion objective (Zeiss). Image acquisition was performed using custom Prairie View Software. Fifteen minutes of spontaneous activity were collected to estimate the occurrence and duration of spontaneous events. Then, the same stimuli used in the un-cued tactile behavioral test were delivered to the contralateral whiskers and GCaMP6 signals were simultaneously recorded.
A
uthor Man
uscr
ipt
A
uthor Man
uscr
ipt
A
uthor Man
uscr
ipt
A
uthor Man
uscr
ipt
Calcium Imaging Data analysis
Images were analyzed post-hoc using a custom program, and open-source routines, written using MATLAB (MathWorks). The package has been used elsewhere43, and available via GitHub (https://github.com/cdeister/imageAnalysis_gui). Frames were collected as individual image files. For analyses of spontaneous calcium events, we collected 8752 images per mouse at 10Hz. We analyzed the first ten minutes of each recording to compute event rate, which comprise 6000 images per mouse. For analyses of stimulus-evoked response, 70 images were acquired for 300 trials for a total of 21000 frames per mouse. Most motion artifacts came from small movements in the x-y plane. Because our acquisition rate was faster than the average frequency of mouse movements, we relied on rigid-body methods to align images44. We used a discrete Fourier transform based method that calculated shifts with sub-pixel increments. A registration template was constructed from averaging the first 10–100 images collected, or 10–100 images that had the lowest
luminance value; both methods resulted in similarly stable images. Each image was aligned to the template. Mean and standard deviation projections of the registered stack were made, from which somatic regions of interests (ROIs) were made using semi-automated
segmentation of factors found using non-negative matrix factorization. All ROIs were inspected manually. A binary mask from the segmented regions was made for later
processing. Fluorescence values were extracted from each ROI for each frame, and the mean for each cell was computed. In addition, we made annulus-shaped ROIs to estimate neuropil contamination by eroding out 15 pixels from each somatic ROI and subtracting any other cell body that fell in this ring. This gave us two vectors of fluorescence values for the soma and the neuropil. We weighted the neuropil vector by 0.8, which was on the high side of contamination estimates we made by comparing the difference in blood vessels and their surround45. The weighted neuropil vector was subtracted from the somatic vector to produce a corrected vector of fluorescence values.
Fluorescence value (F) traces were converted to a normalized ΔF/F trace. We used an approach similar to previous population calcium imaging studies to estimate baseline F0
fluorescence in each cell. F0 computed via a sliding-window of 500 frames (approximately
50 seconds) using a quartile cut-off that ranged from the bottom tenth percentile up to the median, depending on how active the neuron was46. Lastly, F and F0 traces were used to
make the final ΔF/F trace given by (F(i)-F0(i))/F0(i)), where i is the index for each frame.
Records of ΔF/F were grouped into trials and aligned to stimulus onsets for behavioral data for further analysis. We excluded neurons with filled nuclei, which we determined during segmentation by looking at time-lapse movies as well as average and variance projection images. We also looked for disproportionately long decay-time for spontaneous transients as an indication of filled neurons. These neurons comprised at most 1.5% of our imaging fields. We defined stimulus responsive neurons as those whose evoked-GCaMP6 ΔF/F values (the magnitude of ΔF/F integrated over 500 ms post-stimulus minus the baseline ΔF/F integrated over 500 ms pre-stimulus), averaged across trials with 0.75–1.00 mm deflection amplitudes (the higher end of the detectable range), differed significantly (p<0.05; bootstrap mean-difference test) than evoked activity averaged across trials with a zero-amplitude stimulus.
A
uthor Man
uscr
ipt
A
uthor Man
uscr
ipt
A
uthor Man
uscr
ipt
A
uthor Man
uscr
ipt
We estimated event-rate by counting the total number of deconvolved events from the resulting ΔF/F traces using a robust non-negative deconvolution method47,48 implemented in MATLAB (https://github.com/zhoupc/OASIS_matlab). Event rate was defined as the number of individual Ca2+-transients discharged in a ten-minute period. The algorithm has few hand-tunable parameters, but it takes a “Noise Factor” for thresholding noise and signal during its pre-processing steps. We empirically determined this factor for excitatory and inhibitory cells separately and found that a factor of 1 for excitatory cells and 5 for inhibitory cells to result in ‘de-noised’ ΔF/F traces that were closest to visually inspect raw data. We swept the range of noise factors for all neurons analyzed and computed the R2 value between raw data and the algorithm’s processed data and observed that R2 peaked at 0.99 at our chosen noise factor values, but were largely stable over a wide range of values. Correlation coefficients were computed as the Spearman’s rank correlation coefficient (ρ) using the built-in MATLAB ‘corr’ function. To construct distributions of correlations in spontaneous activity, we computed ρ for all possible pairings of neurons deemed active at all (showed at least ten calcium-events in ten minutes, e.g. rate > 0.01 Hz), for all of an
experimental group’s spontaneous firing imaging sessions, which were then pooled. p-values for ρ were determined using the same Matlab function, which computes the tail-probability of the Spearman ‘D-statistic’.
Peri-stimulus time histograms (PSTHs) were made by determining the average evoked-response across six different amplitudes of whisker deflections, including the zero-amplitude stimuli. We did this for all stimulus responsive neurons and converted ΔF/F to standard scores (Z-scores), which allowed us to determine the degree to which the magnitude of evoked-responses differed between WT and Shank3B−/− mice despite differences in their baseline spontaneous activity.
In Vitro Electrophysiology and single cell genotyping
Slice preparation—The slice preparations were followed by previously described. Briefly, the mice injected with AAV2/8-CaMKII-GCaMP6 and AAV2/8-Dlx5/6-Cre-mKate2
were anesthetized via isoflurane and transcardially perfused with 20 ml of ice-cold
carbogenated (95% O2 and 5% CO2,) cutting solution containing (in mM): 194 sucrose, 30 NaCl, 4.5 KCl, 1.2 NaH2PO4, 0.2 CaCl2, 2 MgCl2, 26 NaHCO3, and 10 D-(+)-glucose (with osmolarity of 300–305 mOsm/l). The brain was rapidly removed and placed into ice-cold cutting solution for slice preparation. The coronal slices (300 µm) containing the somatosensory cortex were prepared by a slicer (VT1200S, Leica, Germany) and then incubated in a holding chamber at 32 °C for 15–20 min. Then the slices were transferred to artificial cerebral spinal fluid containing (in mM): 136 NaCl, 3.5 KCl, 1 MgCl2, 2.5 CaCl2, 26 NaHCO3 and 11 glucose (with osmolarity of 295–300 mOsm/l) at room temperature for at least 1h.
Electrophysiological recordings—Whole-cell patch clamp recordings were performed with infrared differential interference contrast visualization at room temperature (21–25 °C). The fluorescently labeled neurons were visualized and identified with a microscope
equipped with GCaMP6 or red fluorescent protein (mKate2) filter (BX-51WI, Olympus).
A
uthor Man
uscr
ipt
A
uthor Man
uscr
ipt
A
uthor Man
uscr
ipt
A
uthor Man
uscr
ipt
Recording pipettes (BF150–86-7.5, Sutter Instruments) were pulled in a horizontal pipette puller (P-97, Sutter Instruments) with a tip resistance of 3–5 MΩ. Patch pipettes were filled with a solution containing (in mM): 128 potassium gluconate, 10 Hepes, 10 phosphocreatine sodium salt, 1.1 EGTA, 5 ATP magnesium salt, and 0.4 GTP sodium salt. pH was adjusted to 7.3 with KOH, and osmolarity was adjusted to 300–305 mOsm with sucrose. An axon 700B amplifier (Molecular Devices) was used to record membrane potentials. Signals were low-pass filtered at 5 kHz and sampled at 20 kHz with a Digidata 1550 and Clampex 10.6 (Molecular Devices), and data were stored on a computer for subsequent off-line analysis.
Single cell collection and PCR—To collect intact single cell and minimal the contamination, we cleaned all work surfaces and equipment with DNA-OFF (Takara Cat. #9036). Pipettes of 2–4 MΩ resistance were filled with intracellular solution (the same recipe with electrorheological recordings). We gave a positive pressure before attaching the cell. When the pipette touching the neuron, we removed the positive pressure immediately and applied light suction until the cell had visibly clung to the tip of pipette. Then pick up the cell slowly and gently under the guidance of microscope, seeing the detachment of the cell from the slice. After that, we broke the tip of the pipette in the PCR tube containing 4 ul of 1X PBS buffer and snap frozen on dry ice. The samples were transferred to −80°C until further processing. According to the recommended protocols single-cell gDNA samples were amplified by REPLI-g Single Cell Kit (Qiagen). Briefly, the single cell solution was taken out from −80°C and added 3 ul of Buffer D2. Samples were incubated for 10 min at 65°C and the reaction was stopped by adding of 3 ul of Stop buffer. Samples were incubated for another 10 hs at 30°C after adding the amplification mix (29 μl buffer, 2 μl REPLI sc DNA polymerase) and at 65°C for 10 min. After amplification, the products were used for PCR analysis. The PCR primers are: F1: 5’-CAGCATTTATACCTGACTGTGAAGC-3’, R1: 5’ -GGGAGTAGAGCTCAGATAACC-3’ and R2: 5’-CTTTGTAAGACCAAAGTGTGG-3’. And the PCR amplification condition is: 95°C for 5 min, 95°C ,30s; 58°C ,30s; 58°C ,60s; for 35 cycles, 72°C for 5 min. The PCR products were running on 2% agarose gels.
Statistics
All comparisons between groups were collected from littermate animals with experiments performed at the same time. No statistical methods were used to predetermine sample sizes, but our sample sizes are similar to those reported in previous publications9,12. With few exceptions, hypothesis testing between two groups using a bootstrap mean-difference test that does not assume the underlying data are normally distributed. For these tests, we computed a bootstrap distribution of the difference in the two group’s means, for each of 10,000 permutations. Normality of the resulting bootstrap distribution was determined by comparing it to a randomly sampled normal distribution with the same mean and standard deviation as the bootstrap distribution. We used the confidence intervals of the resulting bootstrap distribution to derive p-values49. We report all p-values greater than 0.0001 as the
actual p-value, but those less than 0.0001 are reported as p<0.0001. Throughout the study, we used p<0.05 as threshold for rejecting the null-hypothesis. Calculation of the statistics was done in MATLAB2018b (Mathworks). Further details on particular statistical analyses can be found on the respective figures/results section for each dataset. In two experiments we performed a two-tailed, unpaired, Student’s t-test using Prism 7 (GraphPad Software,
A
uthor Man
uscr
ipt
A
uthor Man
uscr
ipt
A
uthor Man
uscr
ipt
A
uthor Man
uscr
ipt
Inc.), for those experiments we did not formally test for normality and equal variance, but assumed the data were normally distributed and had equal variance. In those two cases, we show the underlying data points or distribution. Experiments were randomized and the investigators were blind to the genotypes during the experiments and outcome assessment.
Supplementary Material
Refer to Web version on PubMed Central for supplementary material.
Acknowledgements
We thank J. Wilde, A. Krol, MG. Chen, M. Hu and members of the Feng Lab for helpful discussions. We thank DA. Scott, S. Allsop, B. Clear and T. Dalia for technical support. We thank the Varanasi Family and R. Buxton for supporting our autism research. This work was supported by the Tan-Yang Center for Autism Research at MIT, the Stanley Center for Psychiatric Research at the Broad Institute of MIT and Harvard, Nancy Lurie Marks Family Foundation, the Poitras Center for Psychiatric Disorders Research at the McGovern Institute for Brain Research at MIT, Shenzhen Overseas Innovation Team Project No.KQTD20140630180249366 (Z.L); Guangdong Innovative and Entrepreneurial Research Team Program No.2014ZT05S020 (Z.L) and the National Institutes of Health: R01MH097104 (G. Feng), NIMH Conte Center grant P50MH094271 (G. Feng), F32MH100749 (C.A.D) and R01NS045130 (C.I.M).
References
1. Amso D, Haas S, Tenenbaum E, Markant J & Sheinkopf SJ. Bottom-up attention orienting in young children with autism. Journal of autism and developmental disorders 44, 664–673, doi:10.1007/ s10803-013-1925-5 (2014). [PubMed: 23996226]
2. Leekam SR, Nieto C, Libby SJ, Wing L & Gould J. Describing the sensory abnormalities of children and adults with autism. Journal of autism and developmental disorders 37, 894–910, doi:10.1007/s10803-006-0218-7 (2007). [PubMed: 17016677]
3. Wang AT. et al. Neural selectivity for communicative auditory signals in Phelan-McDermid syndrome. Journal of neurodevelopmental disorders 8, 5, doi:10.1186/s11689-016-9138-9 (2016). [PubMed: 26909118]
4. Gogolla N, Takesian AE, Feng G, Fagiolini M & Hensch TK. Sensory integration in mouse insular cortex reflects GABA circuit maturation. Neuron 83, 894–905, doi:10.1016/j.neuron.2014.06.033 (2014). [PubMed: 25088363]
5. Goncalves JT, Anstey JE, Golshani P & Portera-Cailliau C. Circuit level defects in the developing neocortex of Fragile X mice. Nature neuroscience 16, 903–909, doi:10.1038/nn.3415 (2013). [PubMed: 23727819]
6. Chao HT. et al. Dysfunction in GABA signalling mediates autism-like stereotypies and Rett syndrome phenotypes. Nature 468, 263–269, doi:10.1038/nature09582 (2010). [PubMed: 21068835]
7. Zhang Y. et al. Dendritic channelopathies contribute to neocortical and sensory hyperexcitability in Fmr1(-/y) mice. Nature neuroscience 17, 1701–1709, doi:10.1038/nn.3864 (2014). [PubMed: 25383903]
8. Orefice LL. et al. Peripheral Mechanosensory Neuron Dysfunction Underlies Tactile and Behavioral Deficits in Mouse Models of ASDs. Cell 166, 299–313, doi:10.1016/j.cell.2016.05.033 (2016). [PubMed: 27293187]
9. Peca J. et al. Shank3 mutant mice display autistic-like behaviours and striatal dysfunction. Nature 472, 437–442, doi:10.1038/nature09965 (2011). [PubMed: 21423165]
10. Naisbitt S. et al. Shank, a novel family of postsynaptic density proteins that binds to the NMDA receptor/PSD-95/GKAP complex and cortactin. Neuron 23, 569–582 (1999). [PubMed: 10433268] 11. Bozdagi O. et al. Haploinsufficiency of the autism-associated Shank3 gene leads to deficits in
synaptic function, social interaction, and social communication. Molecular autism 1, 15, doi:10.1186/2040-2392-1-15 (2010). [PubMed: 21167025]
A
uthor Man
uscr
ipt
A
uthor Man
uscr
ipt
A
uthor Man
uscr
ipt
A
uthor Man
uscr
ipt
12. Mei Y. et al. Adult restoration of Shank3 expression rescues selective autistic-like phenotypes. Nature 530, 481–484, doi:10.1038/nature16971 (2016). [PubMed: 26886798]
13. Wang X. et al. Altered mGluR5-Homer scaffolds and corticostriatal connectivity in a Shank3 complete knockout model of autism. Nature communications 7, 11459, doi:10.1038/ ncomms11459 (2016).
14. Wang X. et al. Synaptic dysfunction and abnormal behaviors in mice lacking major isoforms of Shank3. Human molecular genetics 20, 3093–3108, doi:10.1093/hmg/ddr212 (2011). [PubMed: 21558424]
15. Siegle JH, Pritchett DL & Moore CI. Gamma-range synchronization of fast-spiking interneurons can enhance detection of tactile stimuli. Nature neuroscience 17, 1371–1379, doi:10.1038/nn.3797 (2014). [PubMed: 25151266]
16. Luo TZ & Maunsell JH. Neuronal Modulations in Visual Cortex Are Associated with Only One of Multiple Components of Attention. Neuron 86, 1182–1188, doi:10.1016/j.neuron.2015.05.007 (2015). [PubMed: 26050038]
17. Goel A. et al. Impaired perceptual learning in a mouse model of Fragile X syndrome is mediated by parvalbumin neuron dysfunction and is reversible. Nature neuroscience 21, 1404–1411, doi:10.1038/s41593-018-0231-0 (2018). [PubMed: 30250263]
18. de la Rocha J, Doiron B, Shea-Brown E, Josic K & Reyes A. Correlation between neural spike trains increases with firing rate. Nature 448, 802–806, doi:10.1038/nature06028 (2007). [PubMed: 17700699]
19. Chen TW. et al. Ultrasensitive fluorescent proteins for imaging neuronal activity. Nature 499, 295– 300, doi:10.1038/nature12354 (2013). [PubMed: 23868258]
20. Doiron B, Litwin-Kumar A, Rosenbaum R, Ocker GK & Josic K. The mechanics of state-dependent neural correlations. Nature neuroscience 19, 383–393, doi:10.1038/nn.4242 (2016). [PubMed: 26906505]
21. Peron SP, Freeman J, Iyer V, Guo C & Svoboda K. A Cellular Resolution Map of Barrel Cortex Activity during Tactile Behavior. Neuron 86, 783–799, doi:10.1016/j.neuron.2015.03.027 (2015). [PubMed: 25913859]
22. Crochet S, Poulet JF, Kremer Y & Petersen CC. Synaptic mechanisms underlying sparse coding of active touch. Neuron 69, 1160–1175, doi:10.1016/j.neuron.2011.02.022 (2011). [PubMed: 21435560]
23. Yang H, Kwon SE, Severson KS & O’Connor DH. Origins of choice-related activity in mouse somatosensory cortex. Nature neuroscience 19, 127–134, doi:10.1038/nn.4183 (2016). [PubMed: 26642088]
24. Kim E & Sheng M. PDZ domain proteins of synapses. Nature reviews. Neuroscience 5, 771–781, doi:10.1038/nrn1517 (2004). [PubMed: 15378037]
25. Kouser M. et al. Loss of predominant Shank3 isoforms results in hippocampus-dependent impairments in behavior and synaptic transmission. The Journal of neuroscience : the official journal of the Society for Neuroscience 33, 18448–18468, doi:10.1523/
JNEUROSCI.3017-13.2013 (2013). [PubMed: 24259569]
26. Cruikshank SJ. et al. Thalamic control of layer 1 circuits in prefrontal cortex. The Journal of neuroscience : the official journal of the Society for Neuroscience 32, 17813–17823, doi:10.1523/ JNEUROSCI.3231-12.2012 (2012). [PubMed: 23223300]
27. Moore CI & Nelson SB. Spatio-temporal subthreshold receptive fields in the vibrissa
representation of rat primary somatosensory cortex. Journal of neurophysiology 80, 2882–2892 (1998). [PubMed: 9862892]
28. Wehr M & Zador AM. Balanced inhibition underlies tuning and sharpens spike timing in auditory cortex. Nature 426, 442–446, doi:10.1038/nature02116 (2003). [PubMed: 14647382]
29. Orefice LL. et al. Targeting Peripheral Somatosensory Neurons to Improve Tactile-Related Phenotypes in ASD Models. Cell 178, 867–886 e824, doi:10.1016/j.cell.2019.07.024 (2019). [PubMed: 31398341]
30. Dimidschstein J. et al. A viral strategy for targeting and manipulating interneurons across vertebrate species. Nature neuroscience 19, 1743–1749, doi:10.1038/nn.4430 (2016). [PubMed: 27798629]