HAL Id: hal-03228468
https://hal.archives-ouvertes.fr/hal-03228468
Submitted on 26 May 2021
HAL is a multi-disciplinary open access
archive for the deposit and dissemination of
sci-entific research documents, whether they are
pub-lished or not. The documents may come from
teaching and research institutions in France or
abroad, or from public or private research centers.
L’archive ouverte pluridisciplinaire HAL, est
destinée au dépôt et à la diffusion de documents
scientifiques de niveau recherche, publiés ou non,
émanant des établissements d’enseignement et de
recherche français ou étrangers, des laboratoires
publics ou privés.
Functional characterization of PD1+TIM3+
tumor-infiltrating T cells in DLBCL and effects of PD1
or TIM3 blockade
Mikaël Roussel, Kieu-Suong Le, Clémence Granier, Francisco Llamas
Gutierrez, Etienne Foucher, Simon Le Gallou, Céline Pangault, Luc Xerri,
Vincent Launay, Thierry Lamy, et al.
To cite this version:
Mikaël Roussel, Kieu-Suong Le, Clémence Granier, Francisco Llamas Gutierrez, Etienne Foucher, et
al.. Functional characterization of PD1+TIM3+ tumor-infiltrating T cells in DLBCL and effects of
PD1 or TIM3 blockade. Blood Advances, The American Society of Hematology, 2021, 5 (7),
pp.1816-1829. �10.1182/bloodadvances.2020003080�. �hal-03228468�
REGULAR ARTICLE
Functional characterization of PD1
1TIM3
1tumor-in
filtrating T cells in
DLBCL and effects of PD1 or TIM3 blockade
Mika ¨el Roussel,1,2,* Kieu-Suong Le,3,* Cl ´emence Granier,4-6Francisco Llamas Gutierrez,7Etienne Foucher,3Simon Le Gallou,1,2 C ´eline Pangault,1,2Luc Xerri,3Vincent Launay,8Thierry Lamy,1Eric Tartour,4-6Daniel Olive,3,†and Thierry Fest1,2,†
1Microenvironment, Cell Differentiation, Immunology, and Cancer–UMR_S1236, Universit ´e de Rennes, ´Etablissement Français du Sang de Bretagne, INSERM, Rennes,
France;2Laboratoire d’H´ematologie, Centre Hospitalier Universitaire, Rennes, France;3INSERM UMR 1068, Centre National de la Recherche Scientifique UMR 7258, Universit ´e Aix Marseille and Institut Paoli Calmettes, Marseille, France;4Service Immunologie Biologique, Hˆopital Europ ´een Georges Pompidou, Assistance Publique–H ˆopitaux
de Paris, Paris, France;5INSERM U970, Paris Cardiovascular Research Center (PARCC), Paris, France;6Equipe Labellis ´ee Ligue Contre le Cancer, Paris, France;7Service
d’Anatomie Pathologique, Centre Hospitalier Universitaire, Rennes, France; and8Service d’H´ematologie, Centre Hospitalier, Centre Hospitalier Universitaire, Saint Brieuc,
France
Key Points • Activated B cell–like
DLBCL shows in-creased levels of PD11 TIM31TILs with im-paired functions. • These exhausted PD11
TIM31TILs can be functionally reactivated after blocking PD1 or TIM3.
In diffuse large B-cell lymphoma (DLBCL), tumor-infiltrating T lymphocytes (TILs) are involved in therapeutic responses. However, tumor-specific TILs can be dysfunctional, with impaired effector functions. Various mechanisms are involved in this exhaustion, and the increased expression of programmed cell death receptor 1 (PD1) and TIM3 on dysfunctional cells suggests their involvement. However, conflicting data have been published regarding their expression or coexpression in DLBCL. We evaluated the presence and phenotype of CD41and CD81TILs in freshly collected tumor tissues in DLBCL and compared the results with those in follicular lymphoma, classical Hodgkin lymphoma, and nonmalignant reactive lymphadenopathy. We found that TILs expressing both PD1 and TIM3 were expanded in DLBCL, particularly in the activated B cell–like subgroup. Isolated PD11TIM31TILs exhibited a transcriptomic signature related to T-cell exhaustion associated with a reduction in cytokine production, both compromising the antitumor immune response. However, these cells expressed high levels of cytotoxic molecules. In line with this, stimulated PD11 TIM31TILs from DLBCL patients exhibited reduced proliferation and impaired secretion of interferon-g, but these functions were restored by the blockade of PD1 or TIM3. In summary, the PD11TIM31TIL population is expanded and exhausted in DLBCL but can be
reinvigorated with appropriate therapies.
Introduction
Diffuse large B-cell lymphoma (DLBCL) is the most common and most aggressive type of B-cell lymphoma and constitutes a heterogeneous group of tumors with several entities. In particular, 2 subtypes, germinal center B cell–like (GC) and activated B cell–like (ABC) DLBCL, have displayed different outcomes after immunochemotherapy in some, but not all, studies.1,2Despite limited and short response rates in relapsed or refractory DLBCL after anti–programmed cell death receptor 1 (PD1) treatment alone,3therapeutic regimens combining PD1/PD ligand 1 (PD-L1) pathway blockade and rituximab chemotherapy are currently under investigation in several ongoing trials. However, correlative data from clinical trials point to the role of tumor-infiltrating T lymphocytes (TILs) for therapeutic efficacy. CD81 TILs may have reduced efficacy in the context of T cell–mediated immunotherapy, including chimeric antigen receptor (CAR) T-cell therapy, through the loss of various effector functions, such as
Submitted 29 July 2020; accepted 16 February 2021; published online 31 March 2021. DOI 10.1182/bloodadvances.2020003080.
*M.R. and K.-S.L. contributed equally to this work.
†T.F. and D.O. contributed equally as supervisors and senior authors.
For data sharing, please contact the corresponding author at thierry.fest@univ-rennes1.fr.
The full-text version of this article contains a data supplement. © 2021 by The American Society of Hematology
cytolytic capacity, proliferative capacity, and production of the cytokines interferon-g (IFN-g), tumor necrosis factor-a (TNF-a), and interleukin-2 (IL-2).4-7
CD81 TILs that upregulate PD1 expression display an exhausted phenotype.8PD1 is a surrogate marker of T-cell exhaustion and acts by negatively regulating T-cell receptor (TCR) and CD28 signaling and decreasing proliferation and cytokine secretion of T cells upon engagement with its ligands (PD-L1 and PD-L2).9,10Accumulated data indicate that PD1 and PD-L1 are highly expressed in the tumor microenvironment and are robust prognostic markers in various tumors.11-16In DLBCL, conflicting results have been published, and increased PD1 expression in circulating T cells has been associated with poor outcomes in patients.17,18 In contrast, high PD-L1 expression on tumor cells and high levels of plasma-soluble PD-L1 have been associated with poor outcomes.19-22 Finally, PD1 expression alone is not sufficient to characterize exhausted T cells.23Among other molecules, TIM3 represents another well-characterized marker associated with T-cell exhaustion. TIM3 is a member of the T-cell immunoglobulin and mucin domain family of proteins and is expressed on T cells and innate immune cells, where it has been shown to suppress responses after its engagement.24 Like PD1, TIM3 serves as an inhibitory immune checkpoint receptor and is a marker of dysfunction in T cells infiltrating tumors in both mice and humans.25,26 High expression levels of TIM3 on CD81 T cells have been associated with tumor progression and poor outcomes.17,27,28TIM3 expression is closely associated with PD1 expression on TILs, and PD11TIM31TILs have been described as being more exhausted than their TIM32 counterparts.29,30 The CD41T-cell subset, which is critical to CD81T-cell function and antitumor responses, also expresses these inhibitory receptors.31,32 Combination therapies based on blockade of both TIM3 and PD1 exhibited synergistic effects in restoring T-cell responses in vitro and antitumor responses in preclinical animal models.26
Herein, using viable tumor cell suspensions, we sought to accurately assess the level of TIL infiltration in DLBCL, determine the phenotype and gene expression profile of these cells by comparing PD11TIM31and PD12TIM32compartments in CD41 and CD81T cells, and evaluate their functional capacities in terms of proliferation and production of IFN-g. We found enrichment in exhausted T cells in ABC DLBCL tumors, and we demonstrated in vitro that these cells could be reactivated functionally after the blockade of PD1 or TIM3.
Materials and methods
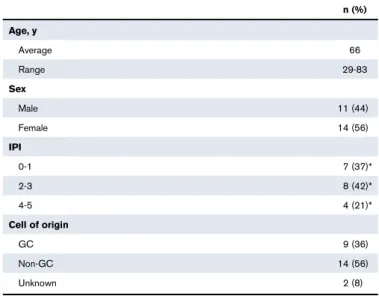
PatientsFresh biopsy samples were collected at diagnosis from DLBCL patients (n 5 25), all classified according to the World Health Organization (Table 1).33 In addition, follicular lymphoma (FL; n5 15), classical Hodgkin lymphoma (cHL; n 5 10), and reactive lymphadenopathy (rLN) samples (n5 7) were analyzed as controls. DLBCL cases were considered to be de novo cases, because there was no history of FL or FL histological features. The DLBCL cell of origin was determined by immunohistochemistry using the Hans algorithm (n 5 21)34 or molecular analysis using the previously described reverse transcriptase multiplex ligation-dependent probe amplification technique (n5 4).35All patients provided informed consent according to the principles of the Declaration of Helsinki and the French National Cancer Institute ethics committee
recommendations, and the study was approved by the ethics board of the Paoli-Calmette Institute.
Cell isolation, cell sorting, and surface and intracellular staining
Sample tissues were mechanically disrupted (GentleMACS; Miltenyi Biotec) to obtain dissociated mononuclear cells, which were frozen for further analysis.
For functional analyses, T cells were obtained from lymphoma tissues by negative selection (StemCell Technologies). To isolate TIM31PD11, TIM32PD12, and TIM32PD11 T cells, purified intratumoral T cells were labeled with CD2, CD56, PD1, TIM3, and a viability marker (Live/Dead Aqua stain; Life Technologies), and were sorted on the FACSAria platform (BD Biosciences; supplemental Table 1A).
For NanoString analysis, cells were stained with CD3, CD4, CD8, CD45RO, PD1, and TIM3 (supplemental Table 1). The CD31 CD45RO1DAPI2population and PD12TIM32CD41, PD11TIM31 CD41, PD12TIM32CD81, or PD11TIM31CD81population were sorted.
Cells were surface stained (detailed in the data supplement; supplemental Table 1), and data were acquired on an LSRII (BD Biosciences) and analyzed using FACSDiva and FlowJo software. Intracellular cytokine secretion
After stimulation (detailed in the data supplement), cells were surface stained with CD3 BV605, CD4 BV650, CD8 Alexa-Fluor700, PD1 BV421, and/or TIM3 PE antibodies and Live/Dead Aqua stain before fixation/permeabilization with the BD Cytofix/ Cytosperm kit. Cells were washed and stained with intracellular molecular antibodies (mAbs) specific for IL-2, TNF-a, IFN-g, and granzyme B.
Table 1.DLBCL patient characteristics (n5 25)
n (%) Age, y Average 66 Range 29-83 Sex Male 11 (44) Female 14 (56) IPI 0-1 7 (37)* 2-3 8 (42)* 4-5 4 (21)* Cell of origin GC 9 (36) Non-GC 14 (56) Unknown 2 (8)
IPI, International Prognostic Index. *Percentage for cases with known data.
CellTrace labeling and T-cell proliferation assays Mononuclear cells and sorted T-cell subsets were stained with the CellTrace violet cell proliferation kit (Life Technologies; detailed in the data supplement). Proliferation was evaluated by the percent-age of CellTracedim cells. Supernatants of cocultures were collected, and IFN-g was further measured by enzyme-linked immunosorbent assay (BD Biosciences).
In situ immunofluorescence staining and analysis of TILs
Tissue samples from 6 DLBCL, 2 rLN, and 2 FL patients obtained on the day of surgery were frozen and stored at280°C. Staining for CD8, PD1, TIM3, and either Ki67 or CD20 was performed using nonlabeled primary antibodies followed by fluorophore-labeled secondary antibodies (detailed in the data supplement; supplemental Table 2). Fluorescence analysis and automated cell counts were performed as previously described.29 To evaluate the distance between the CD81 T-cell infiltrate depending on PD1/TIM3 phenotype and CD201clusters, we performed tissue segmentation based on CD20 staining. This allowed counting of PD11TIM31 CD81 T cells according to their localization in CD201vs CD202areas.
NanoString analysis
The nCounter PanCancer immune cell profiling kit (Nanostring Technologies, Inc.) was used (detailed in the data supplement). The analysis allowed us to compare PD11TIM31 and PD12TIM32 subsets in the CD41or CD81T-cell populations and determine, by a Student t test statistic (P, .05; |fold change [FC]| . 2), the specific gene expression pattern for each population expressed in FC. Ingenuity pathways analysis (Ingenuity Systems) was used to define upstream regulators.
Statistical analysis
Quantitative variables are expressed as means6 standard errors of the mean (SEMs). Statistical analyses were performed with GraphPad Prism 5 software using the Mann-Whitney U or Wilcoxon nonparametric test as appropriate (*P , .05, **P , .01, ***P , .001). For each parameter, the mean frequency of positive cells or mean fluorescence intensity was normalized across samples. Data were then visualized by hierarchical clustering under MeV software (version 4.9.0). Euclidian distance was used with average linkage clustering.
Results
In ABC DLBCL, lymphoma cells strongly express PD-L1
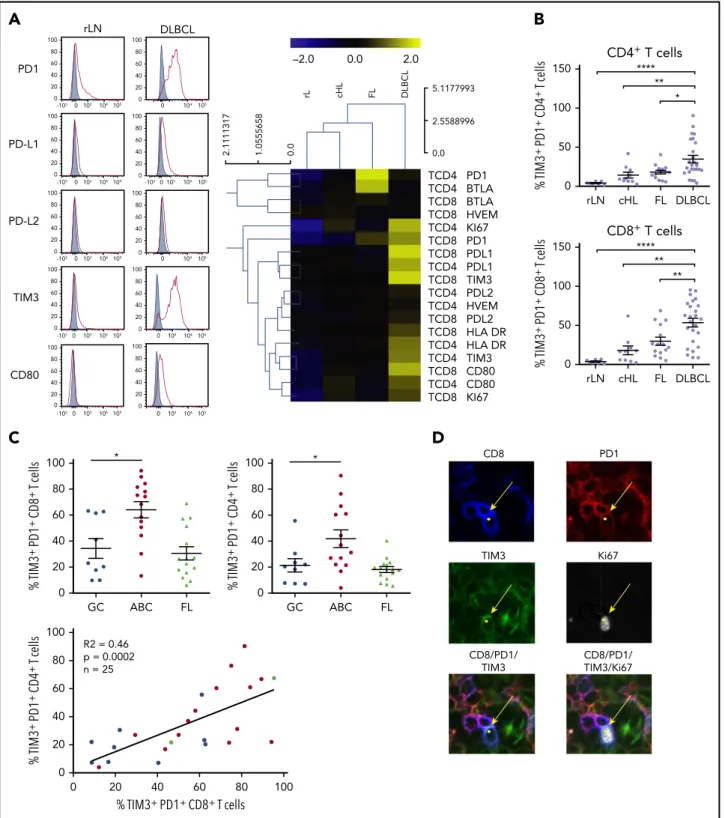
We investigated by flow cytometry the expression of L1 and PD-L2 on lymphoma cells using a clonal marker in DLBCL, FL, and rLN and most likely on normal B cells in cHL. This investigation is in line with previous studies of primary DLBCL cells and lymphoma cell lines.21,36The expression of PD-L1 was significantly higher (P , .01) on DLBCL cells vs cells from rLN and other lymphomas, whereas there was no significant difference in PD-L2 on B cells, although expression in cHL and rLN tended to be higher (Figure 1A). As in previous studies,21,36,37 we also found that B cells taken from ABC DLBCL samples expressed significantly
more PD-L1 (P, .05) than B cells from GC DLBCL or FL samples (Figure 1B).
In ABC DLBCL tumors, expansion of CD81and CD41 TILs expressing inhibitor molecules and the
proliferation marker Ki67
Because of the increased number of PD-L11B cells, we studied the frequency of TILs and the expression of immune checkpoint membrane proteins in tissues from DCLBL, cHL, FL, and rLN samples. CD81 T cells were significantly increased in DLBCL compared with other tumors and rLN (considered here as a control), whereas the percentage of CD41T cells was significantly lower in DLBCL compared with other tumor types and rLN (supplemental Figure 1). DLBCL tissues exhibited a specific phenotypic pattern compared with rLN, cHL, and FL tissues; in particular, CD41and CD81 T cells expressed higher levels of inhibitory molecules on their surface, including PD1, PD-L1, TIM3, and CD80 (Figure 2A). Additionally, the percentages of PD11TIM31 CD41 and PD11 TIM31CD81T cells were increased in DLBCL samples compared with other tissues (P , .05; Figure 2B). Interestingly, both the CD41and CD81PD11TIM31subsets were significantly increased in ABC DLBCL tumors compared with GC DLBCL and FL. Finally, tumor infiltration by PD11TIM31 CD41 correlated with that by PD11TIM31 CD81 T cells, independently of DLBCL subtype (Figure 2C). In contrast with cells from GC DLBCL or FL, PD11 TIM31TILs accumulated in the tumor microenvironment of ABC DLBCL tumors, and these cells exhibited increased HLA-DR and Ki67 expression (Figure 2A). Immunofluorescence microscopic analysis revealed that;1% to 7% of the Ki671cells were PD11 CD81TILs (Figure 2D; supplemental Table 3).
In DLBCL, PD11TIM31CD81TILs localize inside CD201B-cell clusters
We investigated the localization of T and B cells within lymphoma-involved lymph nodes. Frozen tissues from 6 DLBCL (GC, n5 3; ABC, n5 3), 2 FL, and 2 rLN patients were examined using 5-color multiplex immunofluorescence for PD11TIM32 and PD11TIM31 CD81T cells and CD201cells. Both DLBCL and rLN were highly infiltrated by CD81 T cells, with average CD81/CD201ratios of 1:18 and 1:6, respectively, whereas FL tissues were less infiltrated (1:71; supplemental Table 3). In DLBCL tissues, CD81 T cells sometimes expressed both PD1 and TIM3, with a high variability between patients in the examined tissues and with no observed differences between ABC and GC DLBCL subtypes. The median frequency of PD11TIM31cells in the CD81T cell subset was 15%; this frequency fell to 2% for rLN and FL (Figure 3; supplemental Figure 2A; supplemental Table 3). In DLBCL, PD11TIM31CD81 T cells were observed inside CD201 B-cell clusters, whereas in rLN, we found PD11CD81(usually TIM32) T cells at the periphery of CD201B-cell clusters (Figure 3; supplemental Figure 2B). PD11TIM31TIL characterization by
transcriptome analysis
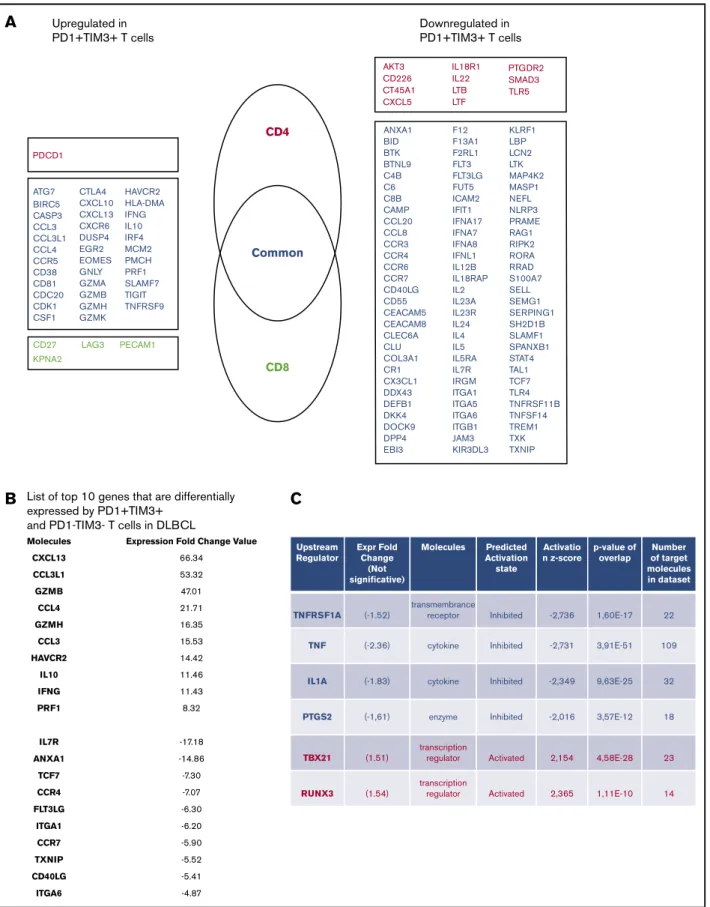
To define the molecular signature of dysfunctional PD11TIM31TILs in DLBCL, we profiled their gene expression and compared them with PD12TIM32T-cell counterparts. We conducted this compar-ison for the CD41and CD81T-cell populations of 3 patients with DLBCL. The expression of 138 (18.2%) of 760 genes changed significantly (P , .05; |FC| . 2), with 40 upregulated and
98 downregulated genes in PD11TIM31 cells compared with PD12TIM32 cells. Only 16 of 138 genes were specific for the CD41 or CD81 T-cell population, including 11 (68%) down-regulated genes and 1 updown-regulated gene (PDCD1) in the CD41 T-cell population and 4 upregulated genes in the CD81 T-cell population (Figure 4A). The list of the top-10 upregulated genes in PD11TIM31 cells included: (1) chemokine ligands, including CCL3, CCL4, and CCL3L1, all 3 of which were located near to one another at the q arm of chromosome 17, and CXCL13, a molecule involved in the follicle homing of secondary lymphoid organs, which had the highest score;(2) cytotoxicity molecules granzyme B, A, and H, IFN-g, and perforin; and (3) molecules involved in immune suppression, such as IL10 (Figure 4B). Besides PD1 and TIM3, multiple cell-surface inhibitors, including LAG3, TIGIT, TNFRSF9 (CD137), and CTLA4, were expressed. Down-regulation of IL7R, CCR7, and TCF7 suggests a transition from
a central memory to an exhausted or effector phenotype. The decreased expression of signaling membrane receptors (IL11RA, IL18R1, IL4R, IL5RA, and IL7R) and the downregulation of several genes encoding cytokines, including IL2, IL22, IL4, IL5, IL13, and IL12B, suggests loss of functionality via reduced cytokine signaling. Gene changes related to PD11TIM31cells also affected transcrip-tion factors, with the upregulatranscrip-tion of IRF8, EOMES, and IRF4, whereas RORA, RORC, GATA3, and STAT4 were downregulated, as were IFN response factors. We next analyzed the potential upstream regulators driving the significant changes in the data set. Prediction of downregulated upstream factors in PD11TIM31cells revealed TNF (with the highest score) and then TNFRSF1A, IL1A, and PTGS2; the expression of these 4 genes tended to be repressed in our data set (Figure 4C). In contrast, predictions of upregulated upstream factors identified the 2 transcription factors TBX21 and RUNX3 (Figure 4C).
A
B
0 20 40 60 80 FL ABC GC % P D-L1 + lymphoma B cells *** * 0 20 40 60 80 100 % P D-L2 + lymphoma B cells rLN cHL FL DLBCL 0 rLN cHL FL DLBCL 20 40 60 80 *** *** ** % P D-L1 + lymphoma B cells PD-L1 rLN 0 0 103104105 20 40 60 80 100 cHL 0 103104105 0 20 40 60 80 100 FL 0 103104105 0 20 40 60 80 100 DLBCL 0 103104105 0 20 40 60 80 100 Normalized to mode PD-L2 0 103104105 0 20 40 60 80 100 0 103104105 0 20 40 60 80 100 0 103104105 0 20 40 60 80 100 0 103104105 0 20 40 60 80 100 Figure 1.Lymphoma B cells from ABC DLBCL stronglyexpress PD-L1.(A) Representative histograms of PD-L1 and PD-L2 expression on isotype-restricted clonal B cells, except for cHL (top), and percentage of B cells expressing PD-L1 or PD-L2 in DLBCL (n5 23), FL (n 5 15), cHL (n 5 10), and rLN (n5 7) samples (bottom). (B) Percentage of PD-L11
lymphoma cells in GC DLBCL (n5 9), ABC DLBCL (n 5 12), and FL (n5 15) samples. *P , .05, **P , .01, ***P , .001 by Mann-Whitney nonparametric U test.
CD8 PD1 TIM3 Ki67 CD8/PD1/ TIM3/Ki67 CD8/PD1/ TIM3
D
C
100 80 60 40 20 0 100 80 60 40 20 0 % TIM3 + PD1 + CD4 + T cells % TIM3+ PD1+ CD8+ T cells R2 = 0.46 p = 0.0002 n = 25 100 80 60 40 20 0 % TIM3 + PD1 + CD8 + T cells * GC ABC FL 100 80 60 40 20 0 * % TIM3 + PD1 + CD4 + T cells GC ABC FLB
CD4+ T cells rLN cHL FL DLBCL 150 **** ** 100 50 0 % TIM3 + PD1 + CD4 + T cells * CD8+ T cells 150 100 50 0 rLN cHL FL DLBCL % TIM3 + PD1 + CD8 + T cells ** ** ****A
TCD4 PD1 TCD4 BTLA TCD8 BTLA TCD8 HVEM TCD4 KI67 TCD8 PD1 TCD8 PDL1 TCD4 PDL1 TCD8 TIM3 TCD4 PDL2 TCD4 HVEM TCD8 PDL2 TCD8 HLA DR TCD4 HLA DR TCD4 TIM3 TCD8 CD80 TCD4 CD80 TCD8 KI67 5.1177993 0.0 2.5588996 rL cHL FL DLBCL 2.1111317 1.0555658 0.0 –2.0 0.0 2.0 rLN DLBCL PD1 0 103 -103 104 105 0 104 105 100 80 60 40 20 0 100 80 60 40 20 0 PD-L1 0 103 -103 104 105 -1030103 104 105 100 80 60 40 20 0 100 80 60 40 20 0 PD-L2 0 103 -103 104 105 0 104 105 100 80 60 40 20 0 100 80 60 40 20 0 TIM3 0 103 -103 104 105 0 103 104105 100 80 60 40 20 0 100 80 60 40 20 0 CD80 100 80 60 40 20 0 0 103 -103 104 105 100 80 60 40 20 0 0 103 104105Figure 2.PD11TIM31CD41T cells and PD11TIM31CD81T cells are enriched in ABC DLBCL tissues.(A) Representative histograms of PD1, PD-L1, PD-L2, TIM3, and CD80 expression on CD81T cells from 1 rLN and 1 DLBCL sample (left). PD1, PD-L1, PD-L2, BTLA, HVEM, CD80, TIM3, HLA-DR, and Ki67 expression on CD41and CD81T cells in DLBCL (n5 25), FL (n 5 15), cHL (n 5 10), and rLN (n 5 7) samples (right). The percentage of Ki671cells and median fluorescence intensity (MFI) for other markers were normalized and hierarchically clustered using Tmev software. (B) Percentage of CD41and CD81T cells expressing PD1 and TIM3 in DLBCL (n5 25), FL (n5 15), cHL (n 5 10), and rLN (n 5 7) samples. (C) Percentage of PD11TIM31CD81T cells and PD11TIM31CD41T cells in GC DLBCL (n5 9), ABC DLBCL (n 5 14), and FL (n5 15) samples. Correlation between percentages of PD11TIM31CD81T cells and percentages of PD11TIM31CD41T cells on DLBCL samples (GC, blue;
ABC, red; unknown, green). (D) Representative mIHC staining in a DLBCL sample (magnification3100). Yellow arrows show a CD81(blue), PD11(red), TIM31(green) cell that expresses Ki67 (white). *P, .05, **P , .01, ****P , .0001 by Mann-Whitney nonparametric U test.
Altered functional responses of PD11TIM31TILs in DLBCL
We next wanted to evaluate the functional capacities of TILs isolated from DLBCL tumors. Proliferative capacity of and cytokine production by CD81and CD41T cells from 13 DLBCL samples in response to TCR stimulation were assessed in vitro. We compared results with those obtained for a control group comprising cells from 3 rLN, 6 cHL, and 3 FL samples. CD81 and CD41T cells from DLBCL samples proliferated and secreted IFN-g significantly less in response to CD3/CD28 stimulation than those from the control group (Figure 5A). Interestingly, these functional losses were proportional to the percentage of tumor-infiltrating PD11TIM31 T cells, particularly for the CD81 T-cell subset (Figure 5B; supplemental Figure 3A). The decrease in cell proliferation correlated with the diminished IFN-g secretion, suggesting that both functions were reduced in parallel upon TCR activation (Figure 5C). A 5 times higher dose of anti-CD3 and anti-CD28 mAbs produced similar results (supplemental Figure 3A-B). We then tested T-cell activation by PMA and ionomycin and measured the capacity of PD11TIM31 TILs to secrete IL-2, TNF-a, IFN-g, and granzyme B. In the CD81T-cell population, we found an inverse correlation between IL-2 or TNF-a production and the percentage of tumor-infiltrating PD11TIM31 CD81 T cells (supplemental Figure 3C). In contrast, increased granzyme B production paralleled increased PD11TIM31 CD81 T-cell infiltration (Figure 5D). Interestingly, although we did not observe a correlation between IFN-g production and CD81T-cell infiltration, IFN-g production increased significantly as tumor infiltration by PD11TIM31 CD41 T cells increased (supplemental Figure 3C). These results were specific to DLBCL tumors, whatever the cell-of-origin classification, and were not observed in the control group, with the exception of a correlation between IFN-g production and CD41 T-cell infiltration (supplemental Figure 4). Taken together, functional analyses of TIM31PD11 T cells confirmed the tran-scriptome profiling data by revealing impaired cytokine production; however, these cells maintained their capacity to produce cytotoxic granzyme B.
PD11TIM31TILs exhibited broad markers of exhausted phenotype
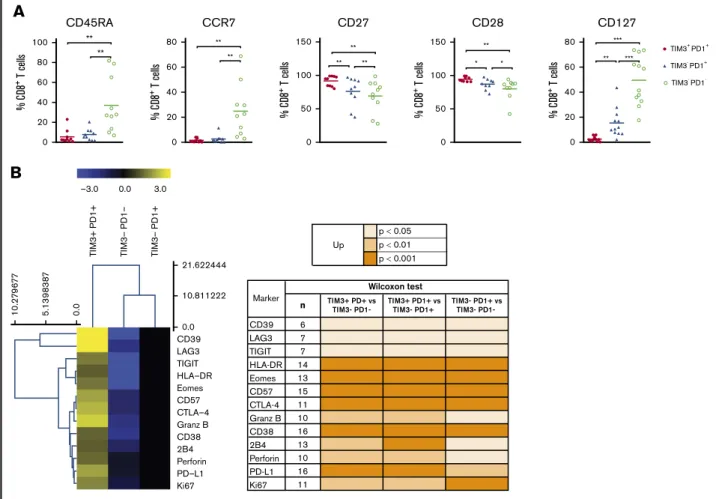
PD1 expression is rapidly upregulated upon T-cell activation and may persist at moderate levels in healthy humans. In addition to PD1, exhausted T cells express a range of other cell-surface inhibitory molecules that can act in synergy. We investigated the expression of additional functional molecules by CD81and CD41 T-cell populations in DLBCL and compared results for the PD11 TIM31, PD11TIM32, and PD12TIM32subsets. PD11TIM31CD81 T cells expressed the lowest levels of CD45RA, CCR7, and CD127 and had increased expression of CD27 and CD28. Taken together, this is indicative of a dynamic phenotype, where CD81T cells are progressively skewed toward an effector memory phenotype (Figure 6A). Compared with PD11TIM32and PD12TIM32CD81 T-cell subsets, PD11TIM31CD81T cells significantly upregulated phenotypically by flow cytometry: (1) CD38, HLA-DR, and CD57 activation markers; (2) a broad range of inhibitory receptors, including TIGIT, CD39, LAG3, CTLA-4, PD-L1, and 2B4; (3) the transcription factor EOMES; (4) the proliferation marker Ki67; and (5) the cytotoxic molecules perforin and granzyme B (Figure 6B). Similar results were observed for the CD41T-cell population and the comparison between the PD11TIM31and PD11TIM32/PD12 TIM32subsets (supplemental Figure 5).
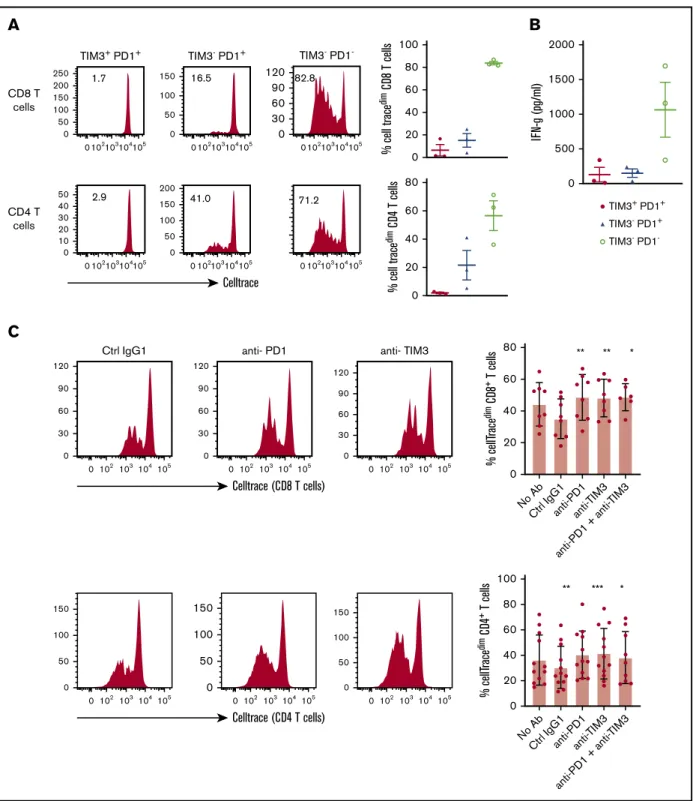
Restoration of TIL proliferation after blockade of PD1 or TIM3
TILs, particularly the PD11TIM31CD81T-cell subset, significantly upregulated the expression of the nuclear protein Ki67, indicating that cells in all phases of the cell cycle are present (Figure 2A,D). We therefore determined the in vitro proliferative capacity of CD81 and CD41TILs after CD3/CD28 stimulation for 5 days. In addition, we assessed the production of IFN-g secondary to the stimulation. Results compared PD11TIM31, PD11TIM32, and PD12TIM32 subsets based on a flow cytometric gating strategy. At the end of the culture, PD12TIM32cells had mostly undergone several cycles of division (mean6 SEM, 83.8% 6 1.5% and 60% 6 11% for PD12TIM32CD81and PD12TIM32CD41T cells, respectively).
DLBCL rLN CD8 PD1 TIM3 CD8+PD1+TIM3+ CD8 PD1 TIM3 TIM3 -TIM3+ CD8-PD1-TIM3+ CD8+PD1+TIM3 -CD20+ CD20- CD20+ CD20-CD8+PD1+TIM3+ Figure 3.CD81T-cell expression of PD1 and
TIM3 in DLBCL vs rLN and their colocaliza-tion with B cells.In this DLBCL sample, the yellow box shows 4 cells expressing CD8 (blue), PD1 (red), and TIM3 (green) in contact with CD201lymphoma cells, identified by the white box. These CD81T cells frequently localize in the CD201infiltrate (turquoise). In this rLN sample, the CD81T cells (blue) sometimes express PD1 (red) but not TIM3 (green). They are found at the periphery of the CD201cluster. Original magnifi-cation360.
ATG7 CTLA4 HAVCR2 HLA-DMA IFNG IL10 IRF4 MCM2 PMCH PRF1 SLAMF7 TIGIT TNFRSF9 CXCL10 CXCL13 CXCR6 DUSP4 EGR2 EOMES GNLY GZMA GZMB GZMH GZMK BIRC5 CASP3 CCL3 CCL3L1 CCL4 CCR5 CD38 CD81 CDC20 CDK1 CSF1 CD27 LAG3 PECAM1 KPNA2 PDCD1 CD4 AKT3 CD226 CT45A1 CXCL5 ANXA1 BID BTK BTNL9 C4B C6 C8B CAMP CCL20 CCL8 CCR3 CCR4 CCR6 CCR7 CD40LG CD55 CEACAM5 CEACAM8 CLEC6A CLU COL3A1 CR1 CX3CL1 DDX43 DEFB1 DKK4 DOCK9 DPP4 EBI3 F12 F13A1 F2RL1 FLT3 FLT3LG FUT5 ICAM2 IFIT1 IFNA17 IFNA7 IFNA8 IFNL1 IL12B IL18RAP IL2 IL23A IL23R IL24 IL4 IL5 IL5RA IL7R IRGM ITGA1 ITGA5 ITGA6 ITGB1 JAM3 KIR3DL3 KLRF1 LBP LCN2 LTK MAP4K2 MASP1 NEFL NLRP3 PRAME RAG1 RIPK2 RORA RRAD S100A7 SELL SEMG1 SERPING1 SH2D1B SLAMF1 SPANXB1 STAT4 TAL1 TCF7 TLR4 TNFRSF11B TNFSF14 TREM1 TXK TXNIP IL18R1 IL22 LTB PTGDR2 SMAD3 TLR5 LTF Common CD8 Upregulated in PD1+TIM3+ T cells Downregulated in PD1+TIM3+ T cells
A
B
Molecules CXCL13 CCL3L1 GZMB CCL4 GZMH CCL3 HAVCR2 IL10 IFNG PRF1 IL7R ANXA1 TCF7 CCR4 FLT3LG ITGA1 CCR7 TXNIP CD40LG ITGA6Expression Fold Change Value
66.34 53.32 47.01 21.71 16.35 15.53 14.42 11.46 11.43 8.32 -17.18 -14.86 -7.30 -7.07 -6.30 -6.20 -5.90 -5.52 -5.41 -4.87
List of top 10 genes that are differentially expressed by PD1+TIM3+
and PD1-TIM3- T cells in DLBCL
C
Upstream Regulator TNFRSF1A (-1.52) (-2.36) (-1.83) (-1,61) enzyme cytokine cytokine transmembrance receptor (1.51) transcription regulator transcription regulator Activated Activated Inhibited Inhibited Inhibited Inhibited 2,154 -2,016 -2,349 -2,731 -2,736 1,60E-17 3,91E-51 9,63E-25 3,57E-12 4,58E-28 23 18 32 109 22 14 1,11E-10 2,365 (1.54) TNF IL1A PTGS2 TBX21 RUNX3 Expr Fold Change (Not significative) Molecules Predicted Activation state Activatio n z-score p-value of overlap Number of target molecules in datasetFigure 4.PD11TIM31T cells display an exhausted transcriptomic signature.(A) Genes differentially expressed by PD11TIM31and PD12TIM32T-cell subsets. Genes are classified as specific to CD41T cells (red) or CD81T cells (green) or common to both subsets (blue). (B) List of top-10 genes differentially expressed by PD11 TIM31and PD12TIM32T-cell subsets. (C) Upstream regulators for genes differentially expressed by PD11TIM31and PD12TIM32T-cell subsets.
0 % CellT race dim CD 4 + T cells 20 40 60 80 100 * 0.1 IF N-γ (pg/mL) 1 10 100 1000 10000 * 0
DLBCL Control DLBCL Control DLBCL Control
% CellT race dim CD 8 + T cells 20 40 60 80 100 *
A
0 0 20 40 60 80 100 IF N-γ (pg/mL) % TIM3+ PD1+ CD8+ T cells 1000 2000 3000 4000 R2: 0.4 p = 0.0045 n = 18 0 0 1000 2000 3000 4000 5000 % CellT race dim CD 8 + T cells IFN-γ (pg/mL) 40 20 60 80 100C
R2: 0.64 p = 0.0001 n = 18 0 0 20 40 60 80 100 % CellT race dim CD 8 + T cells % TIM3+ PD1+ CD8+ T cells 20 40 60 80 R2: 0.58 p = 0.0002 n = 18B
0 0 20 40 60 80 100 IF N-γ (pg/mL) % TIM3+ PD1+ CD4+ T cells 2000 1000 3000 4000 5000 R2: 0.02 p = 0.5 n = 20 0 0 1000 2000 3000 4000 5000 % CellT race dim CD 4 + T cells IFN-γ (pg/mL) 40 20 60 80 R2: 0.38 p = 0.0036 n = 20 0 0 20 40 60 80 100 % CellT race dim CD 4 + T cells % TIM3+ PD1+ CD4+ T cells 20 40 60 80 R2: 0.21 p = 0.03 n = 20 0 0 20 40 60 80 100 % granz yme C D4 + T cells % TIM3+ PD1+ CD4+ T cells 10 20 30 R2: 0.20 p = 0.14 n = 12 Granzyme B 30 0 50 100 150 % granz yme C D8 T cells % TIM3+ PD1+ CD8T cells 40 50 60 70 R2: 0.31 p = 0.05 n = 12 Granzyme B 0 0 20 40 60 80 100 % I FN-γ CD 4 T cells % TIM3+ PD1+ CD4 T cells 20 40 60 R2: 0.4 p = 0.02 n = 12 IFN-γD
Figure 5.In DLBCL tumors, PD11TIM31T cells are exhausted.CellTrace violet–labeled mononuclear cells from DLBCL (n 5 13) and control group (n 5 12 [rLN, n 5 3; cHL, n5 6; FL, n 5 3]) tissues were activated by plate-coated CD3 and soluble CD28 antibodies. (A) Proliferative capacity of CD41and CD81T cells, determined by the
percentage of CellTracedimcells and the concentration of IFN-g detected in the culture supernatant. (B) Correlation between the percentage of PD11TIM31CD41or CD81
T cells and their proliferation and IFN-g secretion (n5 18 or 20 DLBCL). (C) Correlation between the percentage of proliferated T cells and the concentration of IFN-g detected in the supernatant (n5 18 or 20 DLBCL;GC, blue; ABC, red; unknown, green). (D) Correlation between percentage of CD41or CD81T cells coexpressing PD1 and TIM3 and their intracellular IFN-g or granzyme B secretion (n5 12; GC, blue; ABC, red; cell of origin not defined, green).
PD11TIM32 subsets proliferated moderately, whereas PD11 TIM31 cells barely proliferated (mean 6 SEM, 6.6% 6 5%, 15.3%6 6%, 2.8% 6 1.3%, and 19% 6 6.3% for PD11TIM31 CD81, PD11TIM32CD81, PD11TIM31CD41, and PD11TIM32 CD41 T cells, respectively; Figure 7A). In addition, only PD12 TIM32subsets produced high levels of IFN-g (mean6 SEM, 127 6 105, 1486 61, and 1063 6 395 pg/mL for PD11TIM31, PD11 TIM32, and PD12TIM32 T cells, respectively; Figure 7B). In contrast, and in accordance with the above findings, intracellular detection of IL-2, TNF-a, IFN-g, and granzyme B after PMA/ ionomycin stimulation revealed that, compared with PD12TIM32 subsets, PD11TIM31 cells decreased their IL-2 secretion but significantly increased their IFN-g and granzyme B secretion. The PD11TIM32subsets were somewhat intermediate between the 2 other phenotypes (Figure 7B; supplemental Figure 6). Finally, we blocked PD1 and/or TIM3 molecules by use of inhibitory mAbs and tested TIL proliferation after CD3/CD28 stimulation. Proliferation of the CD41and CD81T-cell populations significantly increased (P, .05) when anti-PD1 or anti-TIM3 mAbs were added to the culture compared with control isotype mAbs (Figure 7C). We did not observe synergistic effects when anti-PD1 and anti-TIM3 mAbs were combined. Finally, we reasoned that the level of infiltration by TIM31PD11TILs in DLBCL tumors could have an impact on the prognosis of patients. To explore this idea, we used a public RNA
sequencing data set of 928 DLBCL samples38 and found that patients with low expression levels for HAVCR2 (encodes TIM3) and PDCD1 (encodes PD1) genes had significantly worse outcomes than others (Figure 7D).
Discussion
In this study, we performed a systematic analysis to define the phenotype and functional capacities of CD81and CD41infiltrating T cells in DLBCL tumors. To this end, we analyzed cell suspensions obtained from tumor biopsies and compared DLBCL with FL, cHL, and rLN tissues. The comparison of PD-L1 expression by B cells in the various tumor tissues revealed that PD-L1 was significantly higher in B cells from DLBCL, particularly in B cells from the ABC subtype, as previously described in patient studies39,40 and in accordance with a mouse model of ABC DLBCL where tumors contained PD-L11 B cells associated with a tumor microenviron-ment enriched for CD81T cells at the expense of CD41, as in our study (supplemental Figure 1)41.
In contrast to GC DLBCL, in ABC DLBCL, CD81and CD41T-cell populations showed high expression of the proliferation marker Ki67, associated with an increase in HLA-DR and regulatory surface proteins, such as PD1 and TIM3. Thus, although the percentage of CD41T cells was ultimately decreased in DLBCL, in ABC DLBCL,
A
CD45RA 0 20 40 60 80 100 % C D8 + T cells ** ** % C D8 + T cells CCR7 0 20 40 60 80 ** ** % C D8 + T cells CD28 0 50 100 150 ** * * % C D8 + T cells CD27 0 50 100 150 ** ** ** TIM3+ PD1+ TIM3- PD1 -TIM3- PD1+ CD127 0 20 40 60 80 ** *** *** % C D8 + T cells p < 0.05 p < 0.01 p < 0.001 Upn TIM3+ PD+ vsTIM3- PD1- TIM3+ PD1+ vsTIM3- PD1+ TIM3- PD1+ vsTIM3- PD1-
CD39 6 LAG3 7 TIGIT 7 HLA-DR 14 Eomes 13 CD57 15 CTLA-4 11 Granz B 10 CD38 16 2B4 13 Perforin 10 PD-L1 16 Ki67 11 Marker Wilcoxon test
B
CD39 0.0 10.811222 0.0 5 .1 398 38 7 10.2 7 9 6 7 7 21.622444 LAG3 TIGIT HLA–DR Eomes CD57 CTLA–4 Granz B CD38 2B4 Perforin PD–L1 Ki67 3.0 0.0 TI M3– P D1– TI M3+ P D1+ TI M3– P D1+ –3.0Figure 6.The PD11TIM31T cell–exhausted phenotype. (A) Expression of CD45RA, CCR7, CD27, CD28, and CD127 by PD11TIM31, PD11TIM32, and PD12TIM32 CD81T-cell subsets (n5 10 DLBCL). (B) Expression of inhibitory, proliferation, and effector markers among CD81T-cell subsets. For each marker, the percentage was normalized and hierarchically clustered using Tmev software. *P# .05, **P , .01, ***P , .001 by Wilcoxon parametric test.
B
TIM3+ PD1+ TIM3- PD1+ TIM3- PD1 -0 500 1000 1500 2000 IF N-g (pg/ml)A
0 20 40 60 80 % cell trace dim C D4 T cells 0 20 40 60 80 100 % cell trace dim C D8 T cells CD8 T cells 0 102103104105 0 50 100 150 200 250 1.7 TIM3+ PD1+ 0 102103104105 0 50 100 150 16.5 TIM3- PD1+ 0 102103104105 0 60 30 90 120 82.8 TIM3- PD1 -CD4 T cells 0 102103104105 0 10 20 30 40 50 2.9 0 102103104105 0 50 100 150 200 41.0 0 102103104105 71.2 Celltrace % cellT race dim CD 4 + T cells 100 ** *** * 80 60 40 20 0 No Ab Ctrl IgG1anti-P D1 anti-TIM3 anti-P D1 + anti-TIM3 0 102 103104105 0 50 100 150 0 102 103104105 0 50 100 150 0 102 103104 105 0 50 100 150 Celltrace (CD4 T cells) % cellT race dim CD 8 + T cells ** * ** No Ab Ctrl IgG1anti-P D1 anti-TIM3 anti-P D1 + anti-TIM3 80 60 40 20 0 0 102 103 104 105 0 30 60 90 120 Ctrl IgG1 0 102 103104105 0 30 60 90 120 anti- PD1 0 102 103104105 0 30 60 90 120 anti- TIM3 Celltrace (CD8 T cells)C
Figure 7.In DLBCL, PD1 and TIM3 are involved in T-cell exhaustion.(A) Representative histograms of the proliferation (evaluated by the percentage of CellTracedim
cells) of each CD81and CD41T-cell subset (n5 3 DLBCL). (B) IFN-g secretion in the supernatant of each T-cell subset was measured by enzyme-linked immunosorbent assay (n5 3 DLBCL). (C) CellTrace violet–labeled mononuclear cells from DLBCL samples (n 5 8-12) were activated by plate-coated CD3 and soluble CD28
antibodies. Blocking monoclonal antibodies or control isotype antibodies were added at 10 mg/mL. Representative histograms of the proliferation of CD81T cells and CD41 T cells (left) and percentage of T cells undergoing proliferation (right) in DLBCL in the presence of anti-PD1 or anti-TIM3 antibodies or a combination of both antibodies vs control immunoglobulin G1 (IgG1) antibodies. (D) Event-free survival for the 928 DLBCL patients (GSE117556 cohort). Patients stratified according
to PDCD1 and HAVCR2 expression in 4 subgroups after thresholds were defined using the MaxStat package 0.7-25 (https://cran.r-project.org/web/packages/maxstat/ index.html). Survival probability was calculated with a log-rank test. *P, .05, **P , .01, ***P , .001 by Wilcoxon parametric test.
both CD81 and CD41 T-cell compartments presented PD11 TIM31cells with an activated phenotype and similar transcriptomes. The PD11TIM31cells increased their expression of the cytotoxic molecules, such as granzymes, IFN-g, and perforin, but also chemokine ligands, particularly CXCL13, a molecule involved in the homing of CXCR51 T and B cells to follicles of secondary organs. This later finding is consistent with immunofluorescence experiments and the enrichment of PD11TIM31CD81T cells in CD201 B-cell clusters, in accordance with the recruitment of CXCR51CD81 effector T cells in tumors.42 Collectively, our findings suggest that in ABC DLBCL, the tumor microenvironment exhibits all the features of an operative cellular immune response. However, the response differs from patient to patient, in accor-dance with previously described T cell–inflamed and non–T cell–inflamed phenotypes in solid tumors where increased TILs are associated with the former.43-45The T cell–inflamed subset of tumors was dominated by T-cell markers and chemokines that likely mediated effector T-cell recruitment, increasing antitumor T-cell response, which is consistent with the fact that patients with DLBCL expressing high levels of HAVCR2 (encodes TIM3) and PDCD1 (encodes PD1) have better clinical outcomes than low expressors (Figure 7D).
Gene expression profiling revealed that PD11TIM31 T cells presented decreased expression of TCF7, which encodes the transcription factor TCF1. TIM31TCF12 CD81 T cells
corresponded to terminally exhausted TILs that lost the capacity to respond to PD1 blockade.46,47 Functional investigations con-firmed that the decline in IL-2 production (as well as TNF-a and IFN-g) correlated with an increase in PD11TIM31T-cell infiltration. In parallel, the PD11TIM31 cells lost their proliferative capacity after CD3/CD28 stimulation, despite the fact that they expressed the proliferative marker Ki67. In contrast, bioinformatic prediction of upregulated upstream regulators identified an imprint of TBX21/T-bet and RUNX3 in these cells, 2 transcription factors described, respectively, as related to functionally efficient or reactivable TILs and as supporting the expression of crucial tissue-residency genes while suppressing genes associated with tissue egress and recirculation.48,49 This finding suggests that PD11 TIM31TILs in DLBCL remain functionally reactivable. Indeed, our TCR activation assays showed an increase in granzyme B and IFN-g production proportional, respectively, to the increase of PD11TIM31CD81and CD41TILs (Figure 5D). Overall, our data are consistent with the fact that DLBCL exhibits a dynamic tumor-specific response, which needs to be reactivated through the restoration of the proliferative capacity of terminal differentiated PD11TIM31TILs.
Mechanisms by which antibody blockade of PD1 reinvigorates T cells are not fully understood; however, a specific subpopulation of exhausted CD81 TILs retain polyfunctionality and respond to anti-PD1 therapy.46However, in refractory/relapsed DLBCL, only
1.00 0.75 0.50 Sur vival probabilit y 0.25 p = 0.00026 0.00 0 10 20 30 Time 40 50 60 70
D
Number at risk 443 110 224 151 357 86 175 105 277 60 144 86 159 28 99 56 84 10 63 33 36 5 22 10 5 0 4 1 0 0 0 0 0 10 20 30 Time 40 50 60 70 Strat aStrata PDCD1=high, HAVCR2=high PDCD1=high, HAVCR2=low PDCD1=low, HAVCR2=high PDCD1=low, HAVCR2=low
Figure 7.(Continued).
low response rates to anti-PD1 monotherapy have been observed in unselected patients.50Recurrent genetic alterations may facilitate escape from immune surveillance, including, for example, gene inactivation of b2-microglobulin and CD58 or, in ABC DLBCL, loss of major histocompatibility complex II expression.51,52However, in ABC DLBCL, the presence of PD-L11 B cells associated with PD11TILs supports the rationale behind current ongoing therapeutic strategies combining anti-PD1 mAbs with anti-CD20–based chemo-therapy (registered at www.clinicaltrials.gov as #NCT02541565, #NCT03259529, and #NCT03366272). The combination of immune checkpoint blockers with small molecules (eg, inhibition of BTK) or with immunomodulatory imide drugs may also improve antitumor immune response.53In our study, CD41and CD81TILs restored their proliferative response to CD3/CD28 stimulation after PD1 or TIM3 blockade. Thus, the immune response, although blunted, can be restored by different pathways, and this reactivation occurs for both CD81and CD41TILs.
Even taking into account the small sample size, among the striking information from our study is the fact that PD1 and TIM3 pathways seemed to be independent, meaning they are not synergistic. Therefore, different T-cell subsets with different requirements are operating in lymphoma. The most straightforward conclusion is that both pathways should be targeted, with differences between DLBCL patients that need to be identified. Additional investigations should include single-cell transcriptome analysis, helpful in such questions, and, of course, a greater number of samples tested and the genetic diversity of DLBCL analyzed. Interestingly, our data can be compared with a recent case report showing that CD81T cells and CAR T cells from a patient with DLBCL treated with CAR T-cell therapy exhibited overexpression of PD1 and TIM3 before the contraction of the CAR T-cell population.54
Our study supports the concept that successful therapies should harness those cells that limit tumor growth, particularly T cells and other immune cells. The extraordinary success of cancer immuno-therapy implies that immune checkpoints hold promising therapeu-tic potential in ABC DLBCL. Our study provides preclinical proof of concept for the clinical evaluation of incorporating anti-PD1–based therapy into the current anti-CD20–based modalities as combina-tion immunotherapy for ABC DLBCL. The lack of direct synergy between PD1 and TIM3 blockade was not really expected here in light of current studies in solid tumors evaluating such a combina-tion.55Therefore, in DLBCL, further preclinical evaluation is required for dual blockade, bearing in mind that such an approach may carry potential risks, as has been seen with CTLA/PD1 blockade in melanoma. Our study sheds light on another surprising feature in DLBCL, which concerns the diversity of markers of inhibitory
pathways detected on TILs, such as TIGIT and ectonucleotidases (CD39), and the increased expression of the CD80 marker on CD41 and CD81 T cells, which could affect the PD1/PD-L1 functional axis.56 The intimate relationship between T cells and lymphoma cells in ABC DLBCL demonstrates that both inhibitory and activating pathways could be tackled to unleash immune responses and allow adequate T-cell effector functions, with these cells expressing high levels of cytotoxic molecules, as shown in our study.
Acknowledgments
The authors thank the pathologists, biologists, and clinicians, particularly those from the BREHAT group, who participated in the collection of samples and clinical data annotation. The authors acknowledge the Centre de Ressources Biologiques-Sant ´e (BB-0033-00056) of Rennes Hospital and the Paoli-Calmette Institute (AC 2018-1905) Biobank for their support in the processing of biological samples, as well as the CeVi collection of the Institute Carnot/CALYM.
The team of D.O. was supported by the grant Equipe FRM DEQ20180339209 from the Equipe Fondation pour la Recherche M ´edicale. D.O. is a senior scholar at the Institut Universitaire de France.
Authorship
Contribution: K.-S.L., M.R., T.F., and D.O. designed the research; K.-S.L., M.R., C.G., F.L.G., and E.F. performed the research; K.-S.L., M.R., D.O., and T.F. analyzed the data; S.L.G. and E.T. assisted with the experiments; L.X., C.P., V.L., and T.L. provided FL samples; and M.R., K.-S.L., and T.F. wrote the paper.
Conflict-of-interest disclosure: D.O. is cofounder of ImCheck Therapeutics, Alderaan Biotechnology, and Emergence Therapeu-tics and is a shareholder in these companies. The remaining authors declare no competing financial interests.
The current affiliation for K.-S.L. and E.F. is ImCheck Thera-peutics, Marseille, France.
ORCID profiles: M.R., 0002-9741-0668; D.O., 0000-0003-1299-4113; T.F., 0000-0002-6437-4189.
Correspondence: Thierry Fest, Inserm UMR1236, Facult ´e de M ´edecine, 2 Av du Pr L ´eon Bernard, CS 34317, F-35043 Rennes Cedex, France; e-mail: thierry.fest@univ-rennes1.fr; and Daniel Olive, Inserm UMR1068, CNRS UMR7258, Universit ´e Aix Marseille U105, Institut Paoli Calmettes, F-13273 Marseille Cedex 09, France; e-mail: daniel.olive@inserm.fr.
References
1. Campo E, Swerdlow SH, Harris NL, Pileri S, Stein H, Jaffe ES. The 2008 WHO classification of lymphoid neoplasms and beyond: evolving concepts and practical applications. Blood. 2011;117(19):5019-5032.
2. Staiger AM, Ziepert M, Horn H, et al; German High-Grade Lymphoma Study Group. Clinical impact of the cell-of-origin classification and the MYC/ BCL2 dual expresser status in diffuse large B-cell lymphoma treated within prospective clinical trials of the German High-Grade Non-Hodgkin’s Lymphoma Study Group. J Clin Oncol. 2017;35(22):2515-2526.
3. Lesokhin AM, Ansell SM, Armand P, et al. Nivolumab in patients with relapsed or refractory hematologic malignancy: preliminary results of a phase Ib study. J Clin Oncol. 2016;34(23):2698-2704.
4. Schietinger A, Philip M, Krisnawan VE, et al. Tumor-specific T cell dysfunction is a dynamic antigen-driven differentiation program initiated early during tumorigenesis. Immunity. 2016;45(2):389-401.
5. Chen J, L ´opez-Moyado IF, Seo H, et al. NR4A transcription factors limit CAR T cell function in solid tumours. Nature. 2019;567(7749):530-534. 6. Zajac AJ, Blattman JN, Murali-Krishna K, et al. Viral immune evasion due to persistence of activated T cells without effector function. J Exp Med. 1998;
188(12):2205-2213.
7. Wherry EJ, Blattman JN, Murali-Krishna K, van der Most R, Ahmed R. Viral persistence alters CD8 T-cell immunodominance and tissue distribution and results in distinct stages of functional impairment. J Virol. 2003;77(8):4911-4927.
8. Ahmadzadeh M, Johnson LA, Heemskerk B, et al. Tumor antigen-specific CD8 T cells infiltrating the tumor express high levels of PD-1 and are functionally impaired. Blood. 2009;114(8):1537-1544.
9. Keir ME, Butte MJ, Freeman GJ, Sharpe AH. PD-1 and its ligands in tolerance and immunity. Annu Rev Immunol. 2008;26:677-704.
10. Hui E, Cheung J, Zhu J, et al. T cell costimulatory receptor CD28 is a primary target for PD-1-mediated inhibition. Science. 2017;355(6332):1428-1433. 11. Muenst S, Soysal SD, Gao F, Obermann EC, Oertli D, Gillanders WE. The presence of programmed death 1 (PD-1)-positive tumor-infiltrating
lymphocytes is associated with poor prognosis in human breast cancer. Breast Cancer Res Treat. 2013;139(3):667-676.
12. Badoual C, Hans S, Merillon N, et al. PD-1-expressing tumor-infiltrating T cells are a favorable prognostic biomarker in HPV-associated head and neck cancer. Cancer Res. 2013;73(1):128-138.
13. Thompson RH, Dong H, Lohse CM, et al. PD-1 is expressed by tumor-infiltrating immune cells and is associated with poor outcome for patients with renal cell carcinoma. Clin Cancer Res. 2007;13(6):1757-1761.
14. Dunne MR, Elliott L, Hussey S, et al. Persistent changes in circulating and intestinal gd T cell subsets, invariant natural killer T cells and mucosal-associated invariant T cells in children and adults with coeliac disease. PLoS One. 2013;8(10):e76008.
15. Muenst S, Schaerli AR, Gao F, et al. Expression of programmed death ligand 1 (PD-L1) is associated with poor prognosis in human breast cancer. Breast Cancer Res Treat. 2014;146(1):15-24.
16. Nomi T, Sho M, Akahori T, et al. Clinical significance and therapeutic potential of the programmed death-1 ligand/programmed death-1 pathway in human pancreatic cancer. Clin Cancer Res. 2007;13(7):2151-2157.
17. Zhang L, Du H, Xiao T-W, et al. Prognostic value of PD-1 and TIM-3 on CD31 T cells from diffuse large B-cell lymphoma. Biomed Pharmacother. 2015; 75:83-87.
18. Zhang W, Bai J-F, Zuo M-X, et al. PD-1 expression on the surface of peripheral blood CD41T cell and its association with the prognosis of patients with diffuse large B-cell lymphoma. Cancer Med. 2016;5(11):3077-3084.
19. Dong L, Lv H, Li W, et al. Co-expression of PD-L1 and p-AKT is associated with poor prognosis in diffuse large B-cell lymphoma via PD-1/PD-L1 axis activating intracellular AKT/mTOR pathway in tumor cells. Oncotarget. 2016;7(22):33350-33362.
20. Fang X, Xiu B, Yang Z, et al. The expression and clinical relevance of PD-1, PD-L1, and TP63 in patients with diffuse large B-cell lymphoma. Medicine (Baltimore). 2017;96(15):e6398.
21. Kiyasu J, Miyoshi H, Hirata A, et al. Expression of programmed cell death ligand 1 is associated with poor overall survival in patients with diffuse large B-cell lymphoma. Blood. 2015;126(19):2193-2201.
22. Rossille D, Gressier M, Damotte D, et al; Groupe Ouest-Est des Leuc ´emies et Autres Maladies du Sang. High level of soluble programmed cell death ligand 1 in blood impacts overall survival in aggressive diffuse large B-Cell lymphoma: results from a French multicenter clinical trial. Leukemia. 2014; 28(12):2367-2375.
23. Yang ZZ, Grote DM, Ziesmer SC, Xiu B, Novak AJ, Ansell SM. PD-1 expression defines two distinct T-cell sub-populations in follicular lymphoma that differentially impact patient survival. Blood Cancer J. 2015;5(2):e281.
24. Das M, Zhu C, Kuchroo VK. Tim-3 and its role in regulating anti-tumor immunity. Immunol Rev. 2017;276(1):97-111.
25. Fourcade J, Sun Z, Benallaoua M, et al. Upregulation of Tim-3 and PD-1 expression is associated with tumor antigen-specific CD81 T cell dysfunction in melanoma patients. J Exp Med. 2010;207(10):2175-2186.
26. Sakuishi K, Apetoh L, Sullivan JM, Blazar BR, Kuchroo VK, Anderson AC. Targeting Tim-3 and PD-1 pathways to reverse T cell exhaustion and restore anti-tumor immunity. J Exp Med. 2010;207(10):2187-2194.
27. Li H, Wu K, Tao K, et al. Tim-3/galectin-9 signaling pathway mediates T-cell dysfunction and predicts poor prognosis in patients with hepatitis B virus-associated hepatocellular carcinoma. Hepatology. 2012;56(4):1342-1351.
28. Turnbull A, Balfour-Lynn IM. Recent advances in paediatric respiratory medicine. Arch Dis Child. 2016;101(2):193-197.
29. Granier C, Dariane C, Combe P, et al. Tim-3 expression on tumor-infiltrating PD-11CD81T cells correlates with poor clinical outcome in renal cell carcinoma. Cancer Res. 2017;77(5):1075-1082.
30. Fucikova J, Rakova J, Hensler M, et al. TIM-3 dictates functional orientation of the immune infiltrate in ovarian cancer. Clin Cancer Res. 2019;25(15): 4820-4831.
31. Ngiow SF, von Scheidt B, Akiba H, Yagita H, Teng MW, Smyth MJ. Anti-TIM3 antibody promotes T cell IFN-g-mediated antitumor immunity and suppresses established tumors. Cancer Res. 2011;71(10):3540-3551.
32. Melief CJM.“License to kill” reflects joint action of CD4 and CD8 T cells. Clin Cancer Res. 2013;19(16):4295-4296.
33. Swerdlow SH, Campo E, Pileri SA, et al. The 2016 revision of the World Health Organization classification of lymphoid neoplasms. Blood. 2016;127(20): 2375-2390.
34. Hans CP, Weisenburger DD, Greiner TC, et al. Confirmation of the molecular classification of diffuse large B-cell lymphoma by immunohistochemistry using a tissue microarray. Blood. 2004;103(1):275-282.
35. Mareschal S, Ruminy P, Bagacean C, et al. Accurate classification of germinal center B-cell-like/activated B-cell-like diffuse large B-cell lymphoma using a simple and rapid reverse transcriptase-multiplex ligation-dependent probe amplification assay: a CALYM study. J Mol Diagn. 2015;17(3):273-283. 36. Hu L-Y, Xu X-L, Rao H-L, et al. Expression and clinical value of programmed cell death-ligand 1 (PD-L1) in diffuse large B cell lymphoma: a retrospective
study. Chin J Cancer. 2017;36(1):94.
37. Xing W, Dresser K, Zhang R, et al. PD-L1 expression in EBV-negative diffuse large B-cell lymphoma: clinicopathologic features and prognostic implications. Oncotarget. 2016;7(37):59976-59986.
38. Sha C, Barrans S, Cucco F, et al. Molecular high-grade B-cell lymphoma: defining a poor-risk group that requires different approaches to therapy [published correction appears in J Clin Oncol. 2019;37(12):1035]. J Clin Oncol. 2019;37(3):202-212.
39. Kwon D, Kim S, Kim P-J, et al. Clinicopathological analysis of programmed cell death-1 and programmed cell death-ligand 1 expression in the tumor microenvironments of diffuse large B-cell lymphomas. Histopathology. 2016;68(7):1079-1089.
40. Xu-Monette ZY, Zhou J, Young KH. PD-1 expression and clinical PD-1 blockade in B-cell lymphomas. Blood. 2018;131(1):68-83.
41. Pascual M, Mena-Varas M, Robles EF, et al. PD-1/PD-L1 immune checkpoint and p53 loss facilitate tumor progression in activated B cell diffuse large B-cell lymphomas. Blood. 2019;133(22):2401-2412.
42. He R, Hou S, Liu C, et al. Follicular CXCR5- expressing CD8(1) T cells curtail chronic viral infection [published correction appears in Nature. 2016; 540(7633):470]. Nature. 2016;537(7620):412-428.
43. Gajewski TF, Corrales L, Williams J, Horton B, Sivan A, Spranger S. Cancer immunotherapy targets based on understanding the T cell-inflamed versus non-T cell-inflamed tumor microenvironment. Adv Exp Med Biol. 2017;1036(suppl 2):19-31.
44. Tumeh PC, Harview CL, Yearley JH, et al. PD-1 blockade induces responses by inhibiting adaptive immune resistance. Nature. 2014;515(7528): 568-571.
45. Ayers M, Lunceford J, Nebozhyn M, et al. IFN-g-related mRNA profile predicts clinical response to PD-1 blockade. J Clin Invest. 2017;127(8):2930-2940. 46. Miller BC, Sen DR, Al Abosy R, et al. Subsets of exhausted CD81T cells differentially mediate tumor control and respond to checkpoint blockade
[published correction appears in Nat Immunol. 2019;20(11):1556]. Nat Immunol. 2019;20(3):326-336.
47. Im SJ, Hashimoto M, Gerner MY, et al. Defining CD81 T cells that provide the proliferative burst after PD-1 therapy. Nature. 2016;537(7620):417-421. 48. Milner JJ, Toma C, Yu B, et al. Runx3 programs CD81T cell residency in non-lymphoid tissues and tumours [published correction appears in Nature.
2018;554(7692):392]. Nature. 2017;552(7684):253-257.
49. Paley MA, Kroy DC, Odorizzi PM, et al. Progenitor and terminal subsets of CD81 T cells cooperate to contain chronic viral infection. Science. 2012; 338(6111):1220-1225.
50. Ansell SM, Minnema MC, Johnson P, et al. Nivolumab for relapsed/refractory diffuse large B-cell lymphoma in patients ineligible for or having failed autologous transplantation: a single-arm, phase II study. J Clin Oncol. 2019;37(6):481-489.
51. Challa-Malladi M, Lieu YK, Califano O, et al. Combined genetic inactivation of b2-Microglobulin and CD58 reveals frequent escape from immune recognition in diffuse large B cell lymphoma. Cancer Cell. 2011;20(6):728-740.
52. Wilkinson ST, Vanpatten KA, Fernandez DR, et al. Partial plasma cell differentiation as a mechanism of lost major histocompatibility complex class II expression in diffuse large B-cell lymphoma. Blood. 2012;119(6):1459-1467.
53. Mhibik M, Wiestner A, Sun C. Harnessing the effects of BTKi on T cells for effective immunotherapy against CLL. Int J Mol Sci. 2019;21(1):68. 54. Funk CR, Petersen CT, Jagirdar N, et al. Oligoclonal T cells transiently expand and express Tim-3 and PD-1 following anti-CD19 CAR T cell therapy:
a case report. Int J Mol Sci. 2018;19(12):4118.
55. Wolf Y, Anderson AC, Kuchroo VK. TIM3 comes of age as an inhibitory receptor. Nat Rev Immunol. 2020;20(3):173-185.
56. Zhao Y, Lee CK, Lin C-H, et al. PD-L1:CD80 cis-heterodimer triggers the co-stimulatory receptor CD28 while repressing the inhibitory PD-1 and CTLA-4 pathways. Immunity. 2019;51(6):1059-1073.e9.
![Figure 5. In DLBCL tumors, PD1 1 TIM3 1 T cells are exhausted. CellTrace violet–labeled mononuclear cells from DLBCL (n 5 13) and control group (n 5 12 [rLN, n 5 3; cHL, n 5 6; FL, n 5 3]) tissues were activated by plate-coated CD3 and soluble CD28 antibod](https://thumb-eu.123doks.com/thumbv2/123doknet/14525731.532360/9.890.121.770.100.910/figure-exhausted-celltrace-labeled-mononuclear-control-tissues-activated.webp)