Comparison of Frontal and Parietal Cortices
in the Control of Visual Attention
by
Timothy J. Buschman
B.S. Biology
California Institute of Technology, 2001
SUBMITTED TO THE DEPARTMENT OF BRAIN AND COGNITIVE
SCIENCE IN PARTIAL FULFILLMENT OF THE REQUIREMENTS FOR
THE DEGREE OF
DOCTOR OF PHILOSOPHY IN NEUROSCIENCE
AT THE
MASSACHUSETTS INSTITUTE OF TECHNOLOGY
FEBRUARY 2008
© 2008 Massachusetts Institute of Technology. All rights reserved.
Signature of Author: __________________________________________________
Brain and Cognitive Science
September 30, 2007
Certified by: ________________________________________________________
Earl K. Miller, Ph.D.
Picower Professor of Neuroscience
Thesis Supervisor
Accepted by:________________________________________________________
Matthew A. Wilson, Ph.D.
Professor of Neurobiology
Chairman, Committee for Graduate Students
2 | A b s t r a c t
Comparison of Frontal and Parietal Cortices
in the Control of Visual Attention
by
Timothy J. Buschman
Submitted to the Department of Brain and Cognitive Science
on January 24, 2008 in Partial Fulfillment of the Requirements
for the Degree of Doctor of Philosophy in Neuroscience
Abstract
The ability to switch between tasks reflects a fundamental part of our intelligence. A
foundation of this ability lies in perceiving and processing information pertinent to the situation
at hand. It is our capacity to attend to specific objects and, more importantly, our ability to
switch our attention from object to object, that supports complex cognitive behavior.
Therefore, by understanding the neural mechanisms involved in directing attention we hope to
better understand cognition. Previous work investigating the ability to control attention has
suggested that attention is influenced from two sources – attention can either be driven from
external sources in an bottom-up, exogenous manner or directed internally in an top-down,
endogenous manner. This project will utilize two different forms of visual search in order to
emphasize these two different types of attentional control. Both the prefrontal and parietal
regions are implicated as the source of this control. In order to investigate their relative roles
we recorded simultaneously from both parietal cortex (specifically, the lateral intraparietal
cortex) and prefrontal cortex (specifically, the frontal eye fields and dorsolateral prefrontal
cortex).
We address four main questions. First, we contrast the respective roles of frontal and
parietal cortex in the direction of attention when it is under either top-down or bottom-up
control. We use the timing of attention signals between frontal and parietal cortex to establish
that frontal cortex directs top-down attention back into parietal cortex, while bottom-up
attention is reflected first in parietal cortex, flowing forward to frontal cortex. Secondly, we
investigated the role of synchrony and the inter-areal relationships underlying top-down and
bottom-up control of attention. Our results suggest synchrony between areas shifts as the task
shifts, likely aiding in the selection of the network best suited to the current task. Third, we
compare the neural mechanisms between internal and external control of attention. Finally,
we investigate the neural correlates of the putative parallel and serial mechanisms underlying
visual search, finding support for the existence of a serial search and for the role of the frontal
eye fields in the direction of spatial attention.
Thesis Supervisor: Earl K. Miller
3 | A c k n o w l e d g e m e n t s
Acknowledgements
I would like to thank my mentor, Earl Miller, for his guidance throughout my graduate career. Earl has taught me to be creative, how to write, how to think, how to design experiments, and how to interpret results. Earl has created an environment of unwavering support and independent thinking while fostering a strong sense of lab camaraderie. I appreciate his devotion to science and to our lab – he truly enjoys being a scientist; an enthusiasm that is contagious. Earl is a great mentor and role model, but just as importantly, he is a good friend.
I would also like to thank my committee members for their help and support. I am grateful to Bob Desimone for giving me the opportunity to jump into systems neuroscience in my
post-baccalaureate year and he is responsible for kick-starting my interest in visual attention. Matt Wilson has given me a depth of understanding of neuroscience that I am still probing – it wasn’t until the third time I heard his 9.011 lectures that I think I even began to understand them. John Maunsell has fostered my interest in visual attention and has selflessly given his time on such short notice.
I am grateful to my lab mates. There is not a single person in Earl’s lab who I have not learned from. Everyone has provided me with illuminating discussions – acting as a sounding-board, supporting me when I was still learning, and (of course) feeling free to correct me when I am wrong. I would like to especially thank Jefferson Roy with his help in learning to manage life as a primate researcher. Without his wisdom and guidance I doubt I would have lasted this long. Kristin MacCully has provided support (and laughter) since the day I joined the lab. Wael Asaad has taught me much about neuroscience and is ultimately responsible for pushing me to do large-scale simultaneous recordings. I would also like to thank Michelle Machon, Dave Freedman, and Jon Wallis; all of whom have taught me more than they probably realize. Finally, I would like to thank the animal care techs as well as the veterinary staff for their support of our research – it would be impossible without them yet they receive so little credit.
I would also like to acknowledge the support of my family. My parents imbued in me a love of science; they taught me to be curious and always encouraged my questions; and, most importantly, they have loved me and supported me throughout my entire life. I am also thankful for my wonderful
siblings with whom I spent my childhood laughing, playing, fighting, and learning. They were my first best-friends. I would like also like to thank my grandfather for his love and support; he gave me my interest in computers and it has often proven to be my most valuable skill.
Lastly, I am thankful for the love and support of my family. My son Ryan is a constant reminder of the joy and wonder in life. Finally, and most importantly, I am eternally grateful for the love and support of my wife, Sarah. She has taught me more than anyone, has been a better friend that I have ever deserved, and has loved me more than I thought possible. Without her none of this would have been possible and so it is only fitting that this thesis be devoted to her, as is all of my life.
4 | T a b l e o f C o n t e n t s
Table of Contents
Abstract ... 2
Acknowledgements ... 3
Table of Contents ... 4
Chapter 1: General Introduction ... 10
The Balance of Cognition ... 10
The Advantage of Attention ... 11
Psychophysical Evidence for Endogenous and Exogenous Control of Attention... 12
Loss of Attentional Control ... 14
The Effect of Attention on Neural Representations ... 15
Biased Competition Model ... 16
Synchronous Activity as a Biasing Signal ... 17
Brain Regions Involved in the Control of Attention ... 19
Neural Responses in Lateral Intraparietal (LIP) Region ... 20
Neural Responses in Dorsolateral Prefrontal Cortex (dlPFC) ... 21
Neural Responses in Frontal Eye Fields (FEF) ... 23
Pre-Motor Theory of Attention ... 25
Simultaneous Recording ... 26
Goals of the Current Study ... 26
Chapter 2: Role of Parietal and Frontal Cortex in the Control of Attention ... 28
Introduction ... 28
Visual Pop-out and Visual Search ... 28
Flow of Information about the Locus of Attention ... 29
Figure 1 ... 30
5 | T a b l e o f C o n t e n t s Figure 3 ... 33 Figure 4 ... 35 Figure 5 ... 36 Table 1 & 2 ... 38 Figure 6 ... 39 Figure 7 ... 41 Figure 8 ... 42
Aligning Data on Array Onset versus Saccade Initiation ... 43
Figure 9 ... 44
Dynamics of Selectivity for Single Units ... 47
Correlation of Neural Activity with Behavior ... 54
Figure 10 ... 51
Figure 11 ... 52
Figure 12 ... 53
Conclusion ... 55
Chapter 3: The Role of Synchrony in the Control of Attention ... 57
Introduction ... 57
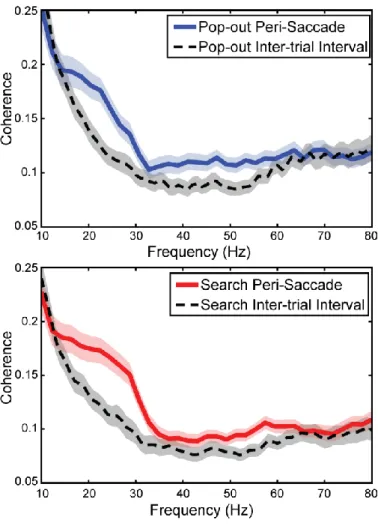
Synchrony between Parietal and Frontal Cortex ... 57
Figure 13 ... 58
Figure 14 ... 60
Correcting for a Common Ground ... 61
Figure 15 ... 62
Correcting for Reaction Time Differences between Tasks ... 63
Figure 16 ... 64
6 | T a b l e o f C o n t e n t s
Figure 18 ... 66
Figure 19 ... 67
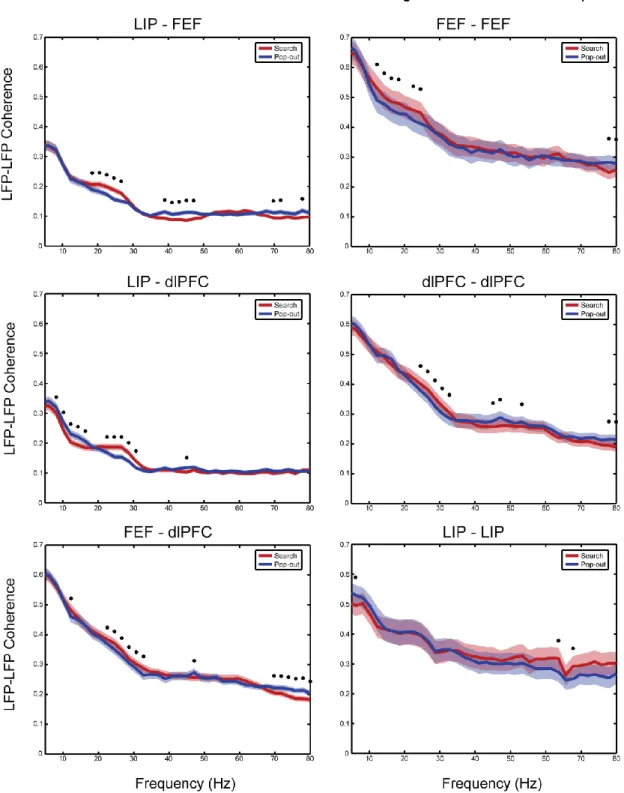
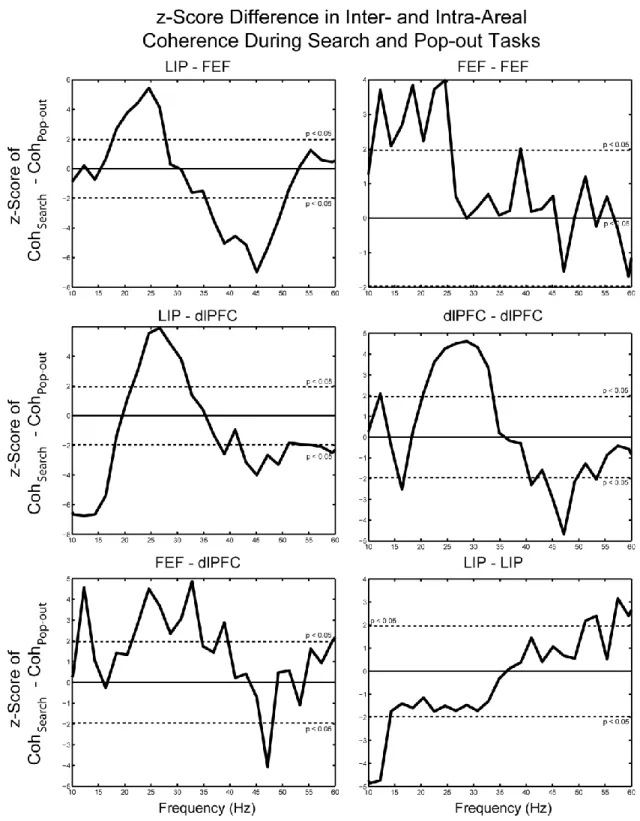
Inter- and Intra-Areal Coherence ... 68
Figure 20 ... 69
Figure 21 ... 70
Synchrony Varies with Location Preference ... 74
Figure 22 ... 75
Figure 23 ... 77
Figure 24 ... 78
Figure 25 ... 79
Correlation of Synchrony with Reaction Time ... 80
Figure 26 ... 81
Figure 27 ... 83
Phase Relationships between Local Field Potentials... 84
Figure 28 ... 86 Figure 29 ... 87 Figure 30 ... 89 Figure 31 ... 90 Figure 32 ... 91 Figure 33 ... 92
Synchrony between Frequency Bands ... 94
Figure 34 ... 96
Synchrony between Spikes and Local Field Potentials ... 97
Figure 35 ... 98
7 | T a b l e o f C o n t e n t s
Chapter 4: Neural Coding for Task Parameters ... 100
Introduction ... 100
Information about Task Parameters over Time ... 100
Figure 36 ... 101
Figure 37 ... 103
Figure 38 ... 104
Figure 39 ... 105
Conclusion ... 106
Chapter 5: Common & Disparate Mechanisms Underlying Control of Attention ... 108
Introduction ... 108
Attention Signals Across Tasks ... 108
Figure 40 ... 111 Figure 41 ... 112 Figure 42 ... 113 Figure 43 ... 114 Figure 44 ... 115 Figure 45 ... 116
Information about the Stimulus Parameters ... 117
Figure 46 ... 118
Figure 47 ... 120
Figure 48 ... 121
Intersection of Attention & Stimulus Information ... 122
Conclusion ... 122
Figure 49 ... 123
8 | T a b l e o f C o n t e n t s
Introduction ... 126
Behavioral Evidence for Parallel and Serial Search Mechanisms ... 127
Figure 50 ... 128
Table 3 ... 130
Neural Evidence for Serial and Parallel Mechanisms in Search ... 131
Figure 51 ... 134
Figure 52 ... 136
Strength of Serial Search and Reaction Time ... 137
Figure 53 ... 138
Neural Evidence for Clockwise Search ... 139
Figure 54 ... 141
Figure 55 ... 142
Serial Search on a Single Neuron Level ... 143
Figure 56 ... 145
Serial Search on a Single Trial Level ... 146
Figure 57 ... 147
FEF leads dlPFC during Search ... 148
Figure 58 ... 149
Psychophysical Estimate of the Time to Shift Attention ... 150
Controlling for Eye Movement Differences ... 150
Figure 59 ... 151
Conclusions ... 152
Chapter 7: General Conclusions ... 154
Figure 60 ... 157
9 | T a b l e o f C o n t e n t s
Subjects ... 161
Behavioral Task ... 161
Figure 61 ... 163
Recording Locations and Isolation of Neural Activity ... 164
Analysis Techniques ... 166
Mutual Information Statistic ... 166
Figure 62 ... 168
Comparing the Mean vs. Leading Edge of a Distribution ... 169
Coherence Statistic ... 170
Estimating Coherence of Single Trials ... 171
Circular Statistics ... 173
10 | I n t r o d u c t i o n
Chapter 1: General Introduction
The Balance of Cognition
Cognition is the balance between external stimulation and internal motivation. It is important to quickly perceive important (salient) changes in our environment so that we can respond to them when necessary. However, it is also necessary to avoid becoming locked to external stimuli – only being able to represent and respond to the brightest, loudest, flashiest thing would result in simple, boring behaviors. Much of intelligent behavior relies on internal motivations such as goals and rules. If our behavior is only dictated by the most salient object in the environment it is difficult to maintain the consistent representations necessary for long-term, directed actions that are fundamental to intelligent behavior.
Understanding how the brain balances these competing interests will provide a basis for gaining insight into cognition. One manner in which to approach this more general question is through the study of attention. Attention is the ability to select specific neural representations, either externally or internally generated, and focus upon them. Importantly, for the current study, there is psychophysical, imaging, and electrophysiological evidence that attention can be driven both internally (endogenously) or externally (exogenously), making it an ideal platform from which to investigate our ability to balance these competing influences.
An additional advantage of studying attention is that there is an expansive and rich literature, with most of it devoted to visual attention, providing a strong foundation on which to build the current study. Many of the major results will be highlighted below. Furthermore, attention is involved in many cognitive behaviors, including possibly playing a role in the binding of features within an object
(Treisman and Gelade, 1980; Friedman-Hill et al., 1995; Treisman, 1996, 1998; Treisman and Kanwisher, 1998), in working memory (Smith and Jonides, 1997; Cabeza and Nyberg, 2000; Mayer et al., 2007; van Swinderen, 2007), and even as a possible gateway into the study of consciousness (Crick and Koch, 1998, 2003). Therefore, in addition to furthering our understanding of cognitive control of behavior, deeper insight into attention will continue to expand our understanding of many other parts of cognition.
11 | I n t r o d u c t i o n
The Advantage of Attention
Paralleling the cognitive advantages of attention, visual attention provides a similar advantage to our visual perception. In order to perceive an object with greater resolution we naturally focus on it, drawing our attention to it, usually immediately followed by a saccade. One reason that attention plays a central role in visual perception is the incredibly rich nature of our visual environments. Although a natural visual scene has some structure, there are still a large variety of scenes, each with a large amount of data which needs to be processed. The retina itself does a fairly good job of capturing this information, as it is estimated to send 10 million bits of information into the thalamus every second (Koch et al., 2004; Koch et al., 2006). The computational power to process and analyze such complex scenes is tremendous; this is one of the many problems facing computer vision. The visual system appears to approach the problem through a hierarchical (although heavily interconnected) network of visual areas (Felleman and Van Essen, 1991). Areas lower in the hierarchy respond to simple visual parameters such as orientation(Hubel and Wiesel, 1968), while areas farther along in the hierarchy usually respond to more complex stimuli. For example, visual categorization seems to exist only at the highest levels of the visual system, after several stages of visual processing (Freedman et al., 2001; Freedman and Assad, 2006). Additionally, neurons in higher level regions respond to stimuli presented over a much larger visual area – neurons in V1 have receptive fields 0.2o in diameter while neurons in TE and TEO have receptive fields spanning 10o or more (Hubel and Wiesel, 1968; Gross et al., 1969; Gattass et al., 1981; Gattass et al., 1988). Although this is costly in terms of resolution, it allows for the
computational load to be reduced by paring down the visual scene to something more manageable. Visual attention compensates for this reduced resolution by allowing specific portions of the visual scene to be processed to a greater degree. This spatial enhancement is often referred to as the ‘spotlight’ of attention (Posner et al., 1980). This can compensate for the loss of acuity of higher visual areas by collapsing the receptive field of a neuron to the attended region (Reynolds et al., 1999; Womelsdorf et al., 2006a). These perceptual advantages of directing visual attention can be measured psychophysically. For example, focusing visual attention to a particular stimulus can increase acuity for simple, low-level parameters such as orientation, color, and spatial frequency as well as complex visual features such as form and categorization (Corbetta et al., 1990; Solomon et al., 1997). Directing attention to a location also speeds up the reaction time to a stimulus appearing at that location, even across modalities (Posner et al., 1980; Lange and Roder, 2006).
12 | I n t r o d u c t i o n
Psychophysical Evidence for Endogenous and Exogenous Control of Attention
Visual attention is believed to be under both endogenous (internal) and exogenous (external) control. The majority of evidence for this disassociation comes from visual search experiments. Visual search experiments ask the subject to find a particular stimulus amongst a display that is cluttered with distractors. Experimental evidence has shown that the speed at which subjects can detect and find the target stimulus is determined by the number and type of distractors. For example, under most
conditions, if the distractors are visually consistent across the entire visual array - differing from the target in a single, simple dimension (such as color, orientation, or spatial frequency) - reaction times are fast and do not depend on the number of items in the display (Treisman and Gelade, 1980). So, there are no costs, in either reaction time or performance, to adding another distractor to the visual array (Treisman and Gelade, 1980). Under these conditions the target is said to “pop-out” from the distractors. Objects that suddenly appear, are brighter, or faster moving can also automatically draw attention to themselves (Jonides and Yantis, 1988; Treisman and Gormican, 1988).
In contrast, if the distractors are not visually uniform, reaction time to find the target increases linearly with the number of distractors in the display (Treisman and Gelade, 1980; Treisman and Gormican, 1988). In the classic example, if the target is a conjunction of two features (e.g., colored red and orientated vertically) and the distractors consist of stimuli that share one or the other dimension (e.g., a red horizontal bar, or a blue vertical bar), then adding another distractor will increase the reaction time linearly. Under these conditions, the target no longer pops out and therefore the subject must exert effort in searching for it.
The neural mechanisms underlying these two types of search have been the subject of intense debate. Two major theories have been put forth. The work of Ann Treisman and colleagues has suggested that these two forms of visual search are due to two distinct mechanisms with the brain. They propose that the visual system is able to process large portions of the visual field in parallel up to a certain point, after which attention must be used to select a particular portion for further analysis (Treisman and Gelade, 1980; Treisman and Gormican, 1988). Under this model the initial, more basic
13 | I n t r o d u c t i o n analysis, which is carried out in parallel, forms the basis for pop-out search. More difficult search requires top-down selection of specific stimuli, necessitating a serial approach as the spotlight of attention is shifted from object to object. This model predicts the empirically observed reaction time differences and suggests that there exists a specific level of complexity after which subjects can no longer perform searches in a parallel, pop-out manner.
An alternative model championed by John Duncan, Jeremy Wolfe, and colleagues, suggests that true serial search is a rarity, limited to very specific circumstances not common in everyday scenes. Instead, they suggest a gradation of parallel search – as in Treisman’s model, easy search is done quickly in early visual areas, however, more complicated search does not require serial mechanisms but rather still occurs in parallel with internal, top-down influences guiding the parallel search towards items related to the target (Duncan and Humphreys, 1989; Wolfe et al., 1989; Cave and Wolfe, 1990; Duncan et al., 1997; Wolfe and Horowitz, 2004). Evidence for Duncan’s model comes from experimental results showing the reaction time cost of an added distractor does not fall into two limited categories (parallel or serial) but falls along a continuum from fast, efficient search to slower, costly search (McLeod et al., 1988; Duncan and Humphreys, 1989; Wolfe and Horowitz, 2004).
Although these two models differ in many important ways, there are several commonalities that provide the basis for the current set of experiments. First, both models predict a parallel component that allows for the selection of the target stimulus under pop-out conditions. Computational modeling has suggested that this parallel search can be done via a saliency map (Itti and Koch, 2000, 2001). The saliency map charts the degree of salience of each object within the entire visual field. Salience can be thought of as the degree of ‘pop-out-ness’ of an object in the visual field and can be computed for each object from its features such as its relative brightness or movement (Itti and Koch, 2000, 2001). These models have even been extended to spiking networks (Niebur and Koch, 1994; de Brecht and Saiki, 2006) and several brain regions have been proposed as the anatomical instantiation of the saliency map including visual cortex (Li, 2002), parietal cortex (Gottlieb et al., 1998; Colby and Goldberg, 1999; Kusunoki et al., 2000; Bisley and Goldberg, 2003) and FEF (Thompson et al., 1997; Schall and Bichot, 1998). These areas are discussed in greater detail below. Since salience is purely defined by the
14 | I n t r o d u c t i o n
features of the objects in the visual field, it is a bottom-up process. In other words, salience is defined externally, with attention automatically drawn to the most salient stimulus.
A second commonality between the two models is the requirement for internal direction of attentional selection under difficult search conditions. The selection process uses goal directed
information about the identity of the target to either guide the parallel search under Duncan’s model or to direct the attentional spotlight and compare a putative object with the target under Treisman’s model. This selection relies on the memory of the target during search. Therefore attention must arise internally, from within the brain, not the external world.
This dichotomy of internal and external control of visual attention forms the basis for the current study – both models suggest that visual search results from the interaction between a bottom-up, externally, driven process and a top-down, internally, driven process. Leveraging this for the current study allows us to use a comparison of pop-out search with conjunctive, difficult, search in order to contrast how the brain implements bottom-up and top-down control of behavior.
Loss of Attentional Control
Deficits in attentional control lead to diverse behavioral issues. The most common disease directly effecting visual attention is often the result of a stroke affecting the parietal cortex. These patients typically exhibit hemi-spatial neglect (Pouget and Driver, 2000; Hillis, 2006; Nachev and Husain, 2006). Initially, they are unable to perceive any objects in the affected hemisphere, but over time their visual perception slowly recovers to near-normal levels. However, even after recovery, while the patient is able to perceive objects presented to affected hemisphere when presented alone, if a competing stimulus is put into the unaffected hemisphere the patients are no longer able to perceive the original object in the affected hemisphere. This has been suggested to reflect the patients’ inability to select objects within the affected hemisphere.
15 | I n t r o d u c t i o n A more common disease involving the loss of attentional control is Attention
Deficiency-Hyperactivity Disorder (ADHD) or Attention Deficit Disorder (ADD). An estimated 8 to 10% of school-age children are diagnosed as having ADHD/ADD in the United States, making it one of the most prevalent diseases among children (Committee on Quality Improvement, 2000). The deficits underlying ADHD are not well understood, but psychophysical studies of children with ADHD suggests they have trouble disassociating attention from one location to in order to shift to a new location (McDonald et al., 1999). Current theories about the cause of ADHD have focused on differential activation in prefrontal cortex and basal ganglia, possibly leading to deficits in cognitive control (Rubia et al., 1999; Zang et al., 2005).
The Effect of Attention on Neural Representations
Many of the psychophysical advantages conveyed by directing attention to a particular stimulus have parallel benefits on neural selectivity when attention is directed towards a neuron’s receptive field. Typically neurons in the visual cortex respond in a varied manner across stimulus space – they have a tuning curve for some stimulus dimension. When attention is directed into a neuron’s receptive field, the gain of its tuning curve is increased. In other words, the neuron becomes better able to discriminate between stimuli across its preferred dimension. This is true for selectivity in V2 and V4 (Motter, 1993; Luck et al., 1997), IT (Chelazzi et al., 1993; Miller et al., 1993; Chelazzi et al., 1998), and MT and MST (Treue and Maunsell, 1996; Treue and Trujillo, 1999; Martinez-Trujillo and Treue, 2002). Attentional effects in striate cortex are under debate, with some evidence that they exist (Motter, 1993; Sharma et al., 2003) and some evidence they do not exist (Moran and Desimone, 1985). The exact mechanism of attentional modulation on neural firing rates is not clear. For orientation and direction selectivity there is evidence for a multiplicative effect – the tuning curve of a single neuron is amplified when attention is directed towards its receptive field (McAdams and Maunsell, 1999; Treue and Trujillo, 1999). In
contrast, the gain in contrast sensitivity seen when attention is directed towards a stimulus appears to be the result of an additive effect, such that the tuning curve is boosted by a constant (Reynolds et al., 2000). However, some have argued for a multiplicative effect in contrast gain as well (Martinez-Trujillo and Treue, 2002; Carrasco, 2006; Williford and Maunsell, 2006). Attentional effects can also be
described as ‘shrinking’ of the receptive field of a neuron such that the neuron only responds to the selected stimulus (Reynolds et al., 1999; Womelsdorf et al., 2006a). Finally, the effect of attention has also been suggested to be equivalent to the addition of contrast to the attended stimulus (Reynolds et al., 2000; Martinez-Trujillo and Treue, 2002). However, this analogy does not appear to fully explain the
16 | I n t r o d u c t i o n
effect of attention on neural activity as contrast is known to be directly correlated with earlier response latency, while direction of attention to a stimulus does not appear to decrease the response latency of a neuron (Lee et al., 2007).
Biased Competition Model
The biased competition model is currently the most accepted theory on how attentional control is implemented in the visual stream. The model, proposed by Desimone and Duncan, suggests that selection occurs at every level of the visual system through lateral competition (Desimone and Duncan, 1995). These competitive interactions are able to select the object most strongly represented, whether due to the physical nature of the stimulus or due to a top-down biasing signal selecting a specific object.
For example, when a single stimulus is presented it drives selective neurons strongly, which pass information on to the next layer. This process continues throughout the visual stream, resulting in representation of that stimulus throughout the entire brain. Similarly, when two or more stimuli are presented alongside one another, they are all represented early on. However, as multiple sets of neurons respond, each selective for one of the visual stimuli, lateral inhibition between these groups of neurons causes competition for representation. Similar to the psychophysical models, this competition can be biased from one of two different sources: either externally driven or internally motivated. A more salient stimulus in the visual field leads to a stronger neural representation (Allman et al., 1985; Desimone et al., 1985; Reynolds and Desimone, 2003), allowing that stimulus to win the competition for representation in downstream cortical regions. Alternatively, if attention is directed to a stimulus then top-down signals can bias competition towards the selected stimulus by giving the representation a boost. The model allows for the top-down influence to be either through an attentional spotlight, through boosting a particular stimulus parameter (such as color), or even a combination of both methods.
Electrophysiological evidence for the biased competition model comes from experiments done by Desimone’s group (Reynolds et al., 1999). In this study, single neurons in V2 and V4 were recorded while either one or two stimuli were presented in the neuron’s receptive field. When either stimulus
17 | I n t r o d u c t i o n was presented alone, the neuron responded preferentially to one or the other stimulus. When both were presented simultaneously and attention was directed away from the receptive field, the neural response was in between the response to each stimulus alone – as if the two stimuli were competing with one another, resulting in an average response. However, when attention was directed to either stimulus within the receptive field, the response was as if only the attended stimulus was presented. In this case, the competition has been biased through top-down selection towards one of the stimuli, allowing for that stimulus to win representation. Further support for the model has come in the form of computational studies (Szabo et al., 2004; Deco and Rolls, 2005) and anatomical evidence suggesting a canonical cortical circuit that may support similar computation (Moldakarimov et al., 2005).
Although the biased competition model captures much of the electrophysiological and
behavioral effects of attention, neither the source nor the manner of the biasing signal is currently fully understood. Although this question is the focus of this thesis, previous work has provided evidence for the role of synchronous activity as a mechanism for biasing signals, and for the fronto-parietal network’s involvement in the direction of attention. These results are reviewed below.
Synchronous Activity as a Biasing Signal
Synchronous firing has been proposed to be the manner through which the representation of a selected object can be increased (Aertsen et al., 1989; Engel et al., 2001; Salinas and Sejnowski, 2001; Fries, 2005; Womelsdorf and Fries, 2007). As the postsynaptic potential associated with an incoming action potential has limited duration, coincident inputs will have increased efficacy compared to non-coincident inputs. Therefore, if a population of neurons representing a single stimulus synchronizes their firing activity, that stimulus will be more strongly represented in downstream areas. This has been proposed to be the manner through which specific representations are biased (Aertsen et al., 1989; Engel et al., 2001; Salinas and Sejnowski, 2001; Fries, 2005; Womelsdorf and Fries, 2007).
Electrophysiological evidence for a role of synchrony in attention comes from Desimone’s lab (Fries et al., 2001; Womelsdorf et al., 2006b). Monkeys were directed to either attend to an object inside or outside the receptive field of a V4 neuron. They were required to monitor the stimulus for a
18 | I n t r o d u c t i o n
slight color change, to which they responded as quickly as possible. Both the spiking activity of multi-units (which is spiking activity not sorted into specific neurons) and local field potentials (oscillatory neural activity at low frequencies) were recorded. The authors found that when attention was directed into the receptive field of a V4 neuron the combined spiking activity of multiple neurons became increasingly synchronized with the underlying local field potential in an upper frequency band (30 – 70 Hz), while becoming less synchronized to low frequency band (5 – 12 Hz). Further analysis suggested that when the synchrony between spikes and LFPs was highest in the upper frequency band, the
animals’ reaction time was faster, suggesting that synchrony affects the ability of the animal to perceive and respond to changes. A more recent experiment from Bichot, Rossi and Desimone (Bichot et al., 2005) using free-viewing visual search found similar effects in V4 during free search – when searching for objects synchrony between local field potentials increased significantly in the upper frequency band for objects sharing a feature of the target. Taken together, these results suggest that the gain in response with attention could be implemented as an increase in the synchronous firing of neurons. Theoretical work has suggested that this gain modulation is optimal within the upper frequency band (Salinas and Sejnowski, 2000, 2001; Tiesinga et al., 2002; Tiesinga and Sejnowski, 2004; Mishra et al., 2006).
Synchrony may also play a more generalized role in regulating the flow of information (Bressler, 1996; Engel et al., 2001; Salinas and Sejnowski, 2001). Similar to its role in attention, synchronous activity may help to strengthen different pathways, acting as a way to dynamically shift the effective connectivity between regions as needed for a particular task. Support for this model is sparse, but experiment evidence from cats suggests that lower frequencies tend to be more strongly synchronized when cats are purposefully controlling their behavior, while higher frequencies are more strongly synchronized when the animal is passively viewing the same stimulus (von Stein et al., 2000). Further experimental evidence has suggested that different frequency bands can lock to one another (Schanze and Eckhorn, 1997; von Stein et al., 2000; Palva et al., 2005). Finally, synchrony has also been shown to increase between neurons with similar selectivity, suggesting a mechanism for selecting specific sub-networks of neurons (Womelsdorf et al., 2007). Overall, these results not only point to a role for
synchrony in providing the biasing signal underlying attention, but also as a more general mechanism for dynamically modulating the effective connectivity between areas.
19 | I n t r o d u c t i o n
Brain Regions Involved in the Control of Attention
While electrophysiological recordings are very well suited for understanding how single neurons from a particular region is involved in specific behaviors, until recently, there has been difficulty in recording from multiple neurons simultaneously. However, with the introduction of functional MRI (fMRI), it is now possible to image activity across the entire brain simultaneously, albeit at a much lower resolution.
Several groups have used fMRI to determine what brain regions are involved in the control of attention. Almost all studies have isolated regions in the parietal cortex (specifically within the
intraparietal sulcus) as well as regions in prefrontal cortex, including the human analogue of the frontal eye fields in the precentral sulcus (Corbetta and Shulman, 2002). When human subjects were asked to attend to a location in order to wait for the presentation of a stimulus (Corbetta et al., 1993; Coull and Nobre, 1998), or were instructed to attend to either motion or color, regions in the precentral sulcus (human FEF) and intraparietal sulcus were activated (Liu et al., 2003). This pattern of results were true for several other studies attempting to isolate the control of attention, leading to the suggestion of the existence of a fronto-parietal network involved in the control of attention (Corbetta et al., 1993; Corbetta et al., 1998; Coull et al., 1998). Furthermore, these results have been used to suggest a common framework within the brain for different modes of attentional selection (i.e. attending to location, color, motion, etc) (Liu et al., 2003; Yantis and Serences, 2003).
The fMRI literature provides us with a good idea of which brain regions are involved in controlling attention. However, due to the long timecourse of fMRI, it is impossible to establish the relative timing of selectivity during the allocation of attention. Without the time-course, it is difficult to determine the flow of information, and therefore impossible to ascertain which brain regions are in control of behavior under different circumstances. In order to determine the flow of information, one must record neural activity simultaneously from all of the brain regions potentially involved in the control of attention. In primates, the analogous regions seem to be the lateral intraparietal area (LIP), the lateral prefrontal cortex (specifically dorsolateral prefrontal cortex, dlPFC), and the frontal eye fields (FEF). Electrophysiological findings from these regions are reviewed below.
20 | I n t r o d u c t i o n
Neural Responses in Lateral Intraparietal (LIP) Region
The lateral intraparietal (LIP) region lies along the lateral bank of the intraparietal sulcus and has been found to be involved in a large variety of visual and visuo-motor tasks. The parietal cortex lies between visual cortex and frontal cortex and is believed to be one of the first areas to begin the transformation of sensory input from purely reflective in nature into more complex, goal, and
movement directed representations. LIP lies along the dorsal stream of the visual system in the monkey and receives feed-forward inputs from V3, V3A, V4, MT, MST, and TEO as well as being reciprocally connected with other parietal regions and frontal regions FEF and dlPFC (Schwartz and Goldman-Rakic, 1984; Andersen et al., 1990; Blatt et al., 1990; Stanton et al., 1995; Lewis and Van Essen, 2000; Ferraina et al., 2002). When LIP is stimulated the monkey will make a saccade to the response field of the neuron, suggesting a possible role in saccadic eye movements (Schiller and Tehovnik, 2001). Projections to the superior colliculus are believed to underlie the microstimulation effects found in LIP (Schiller and Tehovnik, 2001; Ferraina et al., 2002). In addition, LIP neurons have also been found to be selective for smooth pursuit eye movements (Bremmer et al., 1997).
Electrophysiological evidence from LIP has shown the area to play several roles. Early work demonstrated that the area shows delay activity during a delayed spatial memory task. During this task a monkey is required to fixate, during which a brief stimulus is flashed in their periphery. The animal must maintain fixation during a delay until instructed to release, at which point it makes a single saccade to the remembered flashed location. LIP neurons show high activity throughout the entire delay when the stimulus is flashed in the neuron’s receptive field (Barash et al., 1991). This delay activity is unique to LIP amongst other regions in the parietal cortex, making it an effective way to isolate LIP.
Recent experiments have found LIP to also show activation with the direction of attention. LIP neurons respond transiently to a flashed stimulus in the periphery, an occurrence that is known to temporarily draw attention to it (Bisley and Goldberg, 2006). LIP neurons will also reflect the current location of attention, regardless of whether the animal makes a saccade to that location or not (Bisley and Goldberg, 2006). In visual search tasks, LIP neurons have largely been studied under pop-out conditions, and have been shown to reflect the target location fairly early (at approximately 90 ms)
21 | I n t r o d u c t i o n (Ipata et al., 2006; Thomas and Pare, 2007). Finally, LIP neurons have been shown to reflect attentional priority of the represented location (Bisley and Goldberg, 2003).
LIP also shows flexibility in its representations, morphing to represent task-related information. For example, LIP neurons have been found to carry color information when it is a task-relevant
parameter, but not when it is irrelevant to the current task (Toth and Assad, 2002). Furthermore, LIP neurons have been shown to encode shape information (Sereno and Maunsell, 1998) and correlate strongly with the perceived direction of motion of a random-dot stimulus (Williams et al., 2003). They have even shown category related information for random-dot stimuli (Freedman and Assad, 2006). LIP activity has also been related to more cognitive variables such as time (Leon and Shadlen, 2003),
decision making (Platt and Glimcher, 1999; Shadlen and Newsome, 2001), reasoning (Yang and Shadlen, 2007) and reward (Bendiksby and Platt, 2006) when the animal’s behavior is reported with a saccade. These results suggest that LIP is a very flexible region and, taken along with its suggested role in the allocation of attention, have led to it being proposed to be the anatomical instantiation of the saliency map (Gottlieb et al., 1998; Colby and Goldberg, 1999; Kusunoki et al., 2000; Bisley and Goldberg, 2003). This role for LIP fits well with previous results, and, we believe, fits well with the results of this thesis.
Neural Responses in Dorsolateral Prefrontal Cortex (dlPFC)
The prefrontal cortex sits at the anterior pole of the brain and reaches its greatest elaboration and relative size in the primate, especially human, brain (Fuster, 1995), suggesting it plays a role in our ability for advanced cognition and goal-directed behaviors. Recent imaging work has also shown the size of prefrontal cortex is directly correlated with intelligence in adult humans (Haier et al., 2004). The PFC seems anatomically well situated to play a role in cognitive control. It is in the position to be a microcosm of cortical processing, able to synthesize a wide range of external and internal information and also exert control over much of the cortex. The PFC receives and sends projections to most of the cerebral cortex (with the exception of primary sensory and motor cortices) as well as all of the major subcortical systems such as the hippocampus, amygdala, cerebellum, and the basal ganglia (Porrino et al., 1981; Amaral and Price, 1984; Amaral, 1986; Selemon and Goldman-Rakic, 1988; Barbas and De Olmos, 1990; Eblen and Graybiel, 1995; Croxson et al., 2005). Different PFC subdivisions have distinct patterns of interconnections with other brain systems (e.g., lateral PFC – sensory and motor cortex,
22 | I n t r o d u c t i o n
orbital PFC – limbic), but there are prodigious connections both within and between PFC subdivisions (Pandya and Barnes, 1987; Barbas and Pandya, 1989; Pandya and Yeterian, 1990; Barbas et al., 1991; Petrides and Pandya, 1999). The anatomical architecture suggests an infrastructure ideal for learning, one that can act as a large associative network for detecting and storing patterns between diverse events, experiences, internal states, etc. This anatomical structure makes it ideal to act as a center of control.
Indeed, neurophysiological studies in animals and imaging studies in humans have shown that the PFC is highly multimodal. Neurons from within PFC are responsive to a wide range of information and have other properties useful for cognitive control (Miller, 2000). Furthermore, PFC neurons sustain their activity to maintain information across short, multi-second, memory delays (Pribram et al., 1952; Fuster and Alexander, 1971; Fuster, 1973; Funahashi et al., 1989; Miller et al., 1996). This property is crucial for goal-directed behavior, which unlike “ballistic” reflexes, typically extend over time. After training on a wide range of operant tasks many PFC neurons (from ⅓ to ½ of the population) reflect the learned task contingencies: the logic or rules of the task (White and Wise, 1999; Asaad et al., 2000; Wallis et al., 2000; Mansouri et al., 2006). For example, a neuron might be selectively activated by a given cue (e.g., a green light) whereas another neuron might be activated when that cue means something different (like “stop”). Some neurons might activate in anticipation of a forthcoming expected reward or a relevant cue (Watanabe, 1996; G et al., 1999; Wallis and Miller, 2003; Padoa-Schioppa and Assad, 2006), and neurons have even been found to reflect whether a monkey is currently following the abstract principles “same” or “different” (White and Wise, 1999; Wallis et al., 2000). In short, the PFC does indeed act like a brain area that absorbs and reflects the rules needed to guide goal-directed, volitional behavior.
There is strong experimental evidence that the prefrontal cortex is involved in the direction of attention. Human patients with lesions to the PFC not only have difficulty controlling their behavior but show deficits in visual search tasks (Eglin et al., 1991b; Knight et al., 1995; Knight, 1997). Inactivating dlPFC with muscimol in primates reduces their ability to do visual search tasks, but not detection tasks (Iba and Sawaguchi, 2003). This deficit was present for both pop-out and conjunction search task conditions, and the reaction time difference observed between the two tasks was lost after inactivation.
23 | I n t r o d u c t i o n This suggests the dlPFC plays a role in both forms of search (an implication that fits well with our results). Electrophysiological recordings within the dlPFC during a visual pop-out task shows selectivity for the target location at approximately 130 ms after the onset of the search array (Hasegawa et al., 2000). These results suggest a role of PFC in the control of visual attention, possibly through the provision of the top-down signals.
Miller and Cohen (2001) argued that all this indicates that the cardinal PFC function is to acquire and actively maintain patterns of activity that represent goals and the means to achieve them (rules)
and the cortical pathways needed to perform the task (“maps”, hence “rulemaps”). Under this model,
activation of a PFC rulemap sets up bias signals the propagate throughout much of the rest of the cortex, affecting sensory systems (visual attention) as well as the systems responsible for response execution, memory retrieval, emotional evaluation, etc. The aggregate effect is to guide the flow of neural activity along pathways that establish the proper mapping between inputs, internal states, and outputs to best perform the task. Establishing the proper mapping is especially important whenever stimuli are ambiguous (i.e. they suggest more than one behavioral response), or when multiple
responses are possible and the task-appropriate response must compete with stronger, more habitual, alternatives. In short, task information is acquired by the PFC, which provides support to related information in posterior brain systems, effectively acting as a global attentional controller.
Under the Miller and Cohen model, the prefrontal cortex provides a biasing signal to posterior cortex, not only for attentional selection, but also acts to direct all cognitive functions. Although there is good circumstantial evidence that the PFC is the ‘top’ in top-down biasing signals, in order to
demonstrate that PFC directs internal control, it is important to measure the flow of information during internally controlled behavior compared to externally controlled behavior (Miller and D'Esposito, 2005).
Neural Responses in Frontal Eye Fields (FEF)
The frontal eye fields (FEF) lie on the anterior bank of the arcuate sulcus. This area is involved in the production of eye movements and is typically defined as the region of prefrontal cortex that when stimulated with currents < 50 μA will elicit a saccade (Bruce and Goldberg, 1985). FEF is
24 | I n t r o d u c t i o n
intereconnected with the eye plant in the brainstem (which gives it direct control over eye movements) as well as other eye movement related areas, such as the superior colliculus, LIP, and the supplementary eye fields (Stanton et al., 1988; Stanton et al., 1993, 1995). Additionally, FEF sends projections to visual areas V2, V3, V4, MT, MST, and TEO (Stanton et al., 1995). While ablating the FEF does not cause the complete loss of saccades, there is evidence that lesioned animals have difficulty making purposeful saccades (Bruce and Goldberg, 1985; Gaymard et al., 1998; Tehovnik et al., 2000).
Recent research has suggested that FEF plays a role in the control of visual attention. Work from Schall’s group has shown that FEF neurons respond to the location of the target stimulus in a pop-out task approximately 50 ms before saccade onset (Schall and Hanes, 1993; Schall et al., 1995; Bichot et al., 2001; Sato et al., 2001). FEF neurons will respond to the target location regardless of whether the animal makes a saccade to the target’s location (Thompson et al., 1997; Murthy et al., 2001; Sato et al., 2003; Thompson et al., 2005c). Furthermore, neurons in FEF will show target selectivity under both easy and difficult search conditions (Bichot et al., 2001; Sato et al., 2001). These results have led to Schall’s group suggesting that FEF carries a saliency map that integrates both top-down and bottom-up information (Thompson and Bichot, 2005a; Thompson et al., 2005a). This model of FEF functionality is very similar to the saliency map suggested by the guided search model of visual search; it allows for the combination of bottom-up, physical attributes of stimuli with the top-down selection parameters used for search.
The role of FEF in the control of attention has also been supported by the experiments by T. Moore’s laboratory. Moore and colleagues stimulated in FEF at subthreshold levels (i.e. levels that would not elicit a saccadic response) while recording from V4 neurons. The selected V4 neurons had receptive fields which overlapped with the motor field of the FEF stimulation site. The response of V4 neurons to visual stimuli were enhanced when FEF was stimulated, as if attention was being driven to that location (Moore and Armstrong, 2003). Further studies have shown that when directing attention to subparts of the receptive field the response of the V4 neuron will collapse around the selected region, in the same manner as found by Reynolds, Chellazi, and Desimone (Reynolds et al., 1999; Armstrong et al., 2006). Microstimulation in FEF will also boost the animal’s behavioral discriminability at the target location (Moore and Fallah, 2001, 2004). Finally, recent experiments have shown that when stimulating
25 | I n t r o d u c t i o n in FEF, neurons with overlapping receptive fields in V4 will show an increase in gain of their tuning curve, similar to when the animal attends to that location (Armstrong and Moore, 2007). These results suggest that FEF may play a direct role in directing attention to specific portions of the receptive field and that this direction may come from the same regions that actually induce the eye to move. Naturally, these results have lent strong support to the pre-motor theory of attention, discussed below.
Pre-Motor Theory of Attention
Humans make several saccades a second in order to focus objects onto their fovea. As the fovea is dense with photoreceptors, this allows for fine discrimination of the stimuli. Since the eye movement is explicit, this type of orientation is also known as overt attention. However, as outlined above, we are also able to covertly direct our attention to specific objects or locations allowing for deeper, finer analysis without having to move our eyes. Psychophysical experiments have found strong evidence that saccades cannot be made without first covertly allocating attention to the intended target location – shifts in attention always precede saccades (Rayner et al., 1978; Deubel and Schneider, 1996a; Peterson et al., 2004). This result has led to the pre-motor theory of attention which proposes that covert shifts of attention are due to a sub-threshold activation of the saccadic system (Rizzolatti et al., 1987). As noted above, recent experiments in FEF have supported this model – sub-threshold stimulation in FEF appears to bias posterior cortex in a manner similar to attention. Furthermore, all three regions found to be involved in the control of saccadic eye movements are also found to be activated by the covert direction of attention.
A recent electrophysiological study attempted to disassociate motor related activity from visual (or visuo-motor) activity in the frontal eye fields of monkeys by training them respond manually to a pop-out search task, as compared to the more common eye movement response (Thompson et al., 2005c). Thompson et al found that when no saccadic response was required, the neurons that
responded in a manner that was purely motor (i.e. they did not respond to visual stimuli in their motor fields) were not activated by the visual search task. In contrast, visuo-motor neurons, which were activated both by the onset of visual stimuli and by saccadic movements, showed a strong selectivity for the pop-out target stimulus. In fact, the authors found that the purely movement related neurons were
26 | I n t r o d u c t i o n
suppressed during search. Based on these results, and previous results, the FEF is a possible region underlying the pre-motor signals involved in directing covert attention.
Simultaneous Recording
As we are interested in the relative roles of the three cortical regions putatively involved in the control of attention (LIP, dlPFC, and FEF), it is important that we expand upon typical
electrophysiological techniques by recording simultaneously from all three regions of interest. This is necessary for several reasons. Absolute timing of neural activity can vary with further
training/experience, between tasks, and with the statistical criterion used. Therefore, in order to accurately measure the flow of information between regions, our main interest was in the relative timing differences between areas. Simultaneous recording from multiple electrodes aids in detecting them because it reduces the influence of extraneous variables such as differences in performance across sessions. This is especially true in our case as the effects we are interested in contrasting are possibly subtle (such as timing differences between populations), and therefore simultaneously recording from all three regions will allow for improved discrimination. It is crucial to resolve the flow of information between different brain regions as it is the only way to truly determine which brain regions seem to be in control of different behaviors (Miller and D'Esposito, 2005). Simultaneous recordings also allow for relational timing effects, such as synchrony, to be investigated.
Goals of the Current Study
The first goal of this study, and the focus of the first part of the thesis, will be to determine the relative role of prefrontal and parietal cortices in the endogenous and exogenous control of attention. Animals were trained to perform both a covert visual search and covert visual pop-out task, utilizing internal and external control of attention, respectively. Simultaneously recorded neurons in LIP, FEF, and dlPFC will then be compared in order to determine when each region find the location of the target stimulus. The ordering of this latency will give insight into the direction of information flow between the two tasks and illuminate which region(s) is involved in the control of attention.
27 | I n t r o d u c t i o n The second goal of the study will be to investigate the differences in the synchronous
relationship between/with-in each region(s) during the tasks. As noted in the Introduction, there is extensive evidence that local synchrony plays a role in attention, and theoretical work suggesting synchrony could provide a mechanism for the dynamic change in effective connectivity between brain regions. Therefore, we aim to investigate the relationship between the local field potential of different regions and within regions, as well as the relationship between spiking activity and LFPs.
Our third aim is to resolve the similarities and differences in the neural networks underlying exogenous and endogenous control of attention. While there is considerable evidence from fMRI experimentation that both parietal and frontal regions are involved in both types of attentional control, due to the low spatial resolution of fMRI it is not possible to determine at the network level whether these two functions are separate or combined. We hope to investigate the commonalities and differences in the networks supporting behavior in each task.
Our fourth goal is to investigate the relative role of serial and parallel search mechanisms supporting endogenous and exogenous control of attention. Furthermore, we hope to determine which brain regions underlie these differing neural computations.
28 | C o n t r o l o f A t t e n t i o n
Chapter 2: Role of Parietal and Frontal Cortex in the Control of Attention
Introduction
Visual attention is thought to be controlled from both endogenous (internal) and exogenous (external) sources. Experiments with visual search paradigms provide the majority of evidence for the existence of these two forms of attentional control. For example, under most conditions, when a visual scene is presented attention will be automatically drawn to the most salient object in the scene, where saliency is defined by a variety of parameters, including relative brightness and movement (Jonides and Yantis, 1988; Treisman and Gormican, 1988). However, when a visual scene is presented that does not have any stimulus of particularly high saliency, in order to select a visual object for greater scrutiny, one must internally direct attention to the stimulus (this is classically shown in a conjunction search,
Treisman and Gelade, 1980; Treisman and Gormican, 1988).
The best working model of both the psychophysical and neural effects of attention is the biased competition model (Desimone and Duncan, 1995). The model proposes that lateral inhibition between the neural representation of visual stimuli leads to competition between stimuli for representation in the cortex. Under this model the stimulus with the highest saliency will have the strongest
representation (or even possibly the earliest representation), allowing it to win this competition. However, internal direction of attention can select specific stimuli and bias those representations to win the competition. While physiological support exists for the model’s representation of competing stimuli (Reynolds et al., 1999), two important points remain with little to no experimental evidence: whether the competition proceeds in a bottom-up, feed-forward manner and the origin of the biasing signal. We hope to answer these questions by utilizing the exogenous and endogenous nature of visual pop-out and visual search in order to investigate the relative roles of parietal and prefrontal cortex in the control of visual attention. Most of this chapter has previously appeared in print (Buschman and Miller, 2007).
Visual Pop-out and Visual Search
In order to determine the respective roles of prefrontal and parietal cortices in the endogenous and exogenous control of attention, we recorded from multiple electrodes simultaneously implanted in frontal and parietal cortices as monkeys found a visual target under two conditions (Figure 1). Under
29 | C o n t r o l o f A t t e n t i o n both conditions the target was randomly located in an array of four stimuli, and only differed in how the distractors related to the target. As with the classic human studies overviewed above, the ‘pop-out’ condition was designed to rely on exogenous, external, bottom-up control of attention. Under this condition the distractors were all identical and differed from the target along two dimensions (color and orientation), so the target’s salience automatically draws attention (Treisman and Gelade, 1980). In contrast, during the ‘search’ condition, each distractor independently differed from the target. Because the target matched some of the distractors in each dimension, it was not salient and had to be sought just using the memory of the sample stimulus. As noted above, this form of visual search requires endogenous, internal, top-down control of attention.
The monkeys showed the behavioral hallmarks of bottom-up versus top-down attention. As with humans, under these two conditions, we can measure the cost of an added distractor by varying the number of distractors in the search array. There was a shallower increase in reaction time (RT) with more distractors during pop-out than search (6 ms/item for pop-out; 22 ms/item for search; p < 0.001, t-test of least-squares linear regression, Figure 2). This difference suggests a mechanistic difference underlying the two types of search. Furthermore, under recording conditions, when there were always four items in the search array (three distractors, one target), the monkeys’ reaction time was
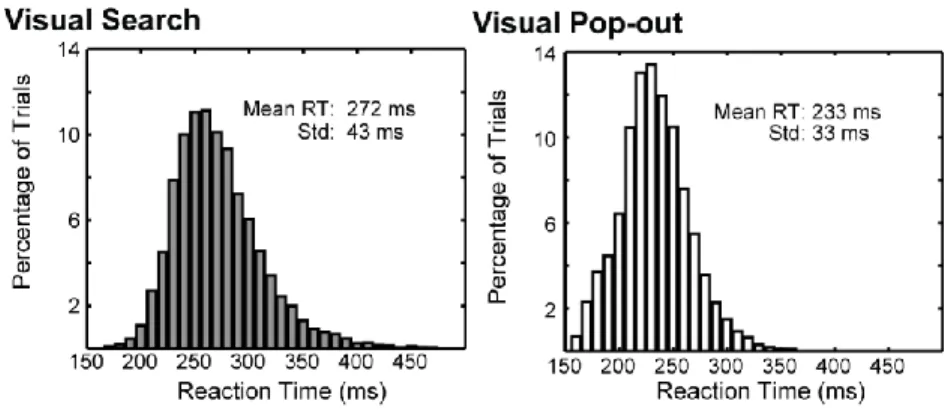
significantly longer and more variable for search than pop-out (Figure 3). Average RTs for search (272 ms) and pop-out (233 ms) differed significantly (p < 10-5, t-test). The variance in RT also differed significantly (standard deviations of 43 ms for search and 33 ms for pop-out, p < 10-5, χ2 test). This difference is also typical for visual search and pop-out in humans (Treisman and Gelade, 1980; Duncan and Humphreys, 1989; Wolfe et al., 1989) and further reflects different mechanisms underlying the behavior.
Flow of Information about the Locus of Attention
We were interested in the respective roles of prefrontal and parietal cortex in the direction of attention under these two tasks. In order to determine these roles, we leveraged the behavioral design: the animal always made its choice with a saccade to the target location and previous psycophysical work has shown saccades are preceded by shifts in attention. Therefore, in order to establish when each anatomical area directs attention to the target location, we can determine the time-point at which
30 | C o n t r o l o f A t t e n t i o n
Figure 1
Figure 1. Schematic of Task Design. Red circle indicates eye position throughout the task. Both Search
and Pop-out required the animal to begin the task fixating, followed by the sample stimulus, which was the target to be found in the visual array. After a short delay, the visual array was presented and the animal was required to make a single, direct, saccade to the target location in order to receive a reward. Visual Search and Pop-out tasks only differed in how the distractors related to the target in the search array.
31 | C o n t r o l o f A t t e n t i o n neurons in each area signaled the target location. This activity reflects both the pre-saccadic shift in attention to the target as well as the eye movement itself. Since the saccade acts as a behavioral marker which informs us of when the animal knew the target location, we can look backwards in time, relative to the saccade, in order to find the neural correlates of directing attention.
We determined when each neuron first “found” (reflected) the target location by computing when the amount of information in its firing rate about target location first reached significance. Significance was determined via the mutual information statistic (see Methods). We were interested in the amount of information about the target location carried by the firing rate of an individual cell. Trials were broken down into groups by condition (pop-out or search) and by target location. This grouped across differences in target identity (color and orientation) as well as distractor identity, controlling for any selectivity for these parameters. As attention is known to precede a saccade (Rayner et al., 1978; Deubel and Schneider, 1996b; Peterson et al., 2004), measuring selectivity in this manner ensures any selectivity observed is only related to the allocation of attention or to the eye movement itself.
The degree of selectivity was calculated across the entire timecourse of the trial in
non-overlapping windows of 25 ms, where the amount of information about the target location contained in the firing activity of each cell was determined within each bin. Significance was determined within each bin independently by comparing the observed amount of information against a null distribution created through randomization tests (see Method). The amount of observed information was denoted as significant only if it exceeded 95% of the null distribution (p < 0.05 in each bin). The point at which an individual neuron began to significantly reflect the target location was defined as the time point at which significant information was found for two consecutive bins (chance level = 0.052 or 2.5*10-3). This is known as the time to first significance for each neuron. Figure 4, top and bottom, show the firing rates (for pop-out only) as well as the mutual information over time (for both pop-out and search) for an example dlPFC and LIP neuron, respectively. The starred position shows the time to first significance for each cell. As will be seen on the population level, the LIP neuron shows selectivity for the target
32 | C o n t r o l o f A t t e n t i o n
Figure 2
Figure 2. Reaction Time Increase with Increased Distractors. Psychophysical testing with variable
number of distractors in the search array showed differences between search (in red) and pop-out (in blue). The average reaction time for the animal to find the target is plotted as a circle for visual arrays with 1, 2, and 3 distractors. Black lines show standard deviation. The solid colored lines show the linear fit for both search (red) and pop-out (blue). Shaded regions show 95% confidence interval about these fits. There was a shallower increase in reaction time (RT) with more distractors during pop-out than search (6 ms/item for pop-out; 22 ms/item for search; p < 0.001, t-test of least-squares linear regression).
33 | C o n t r o l o f A t t e n t i o n
Figure 3
Figure 3. Overall reaction time distributions for Search and Pop-out. Reaction time distributions for
Search (left) and Pop-out (right) from both animals during recording sessions (with 4 items in visual array). Visual search showed both an average increase in reaction time as well as a more variable reaction time. Average RTs for search (272 ms) and pop-out (233 ms) differed significantly (p < 10-5, t-test). The variance in RT also differed significantly (standard deviations of 43 ms for search and 33 ms for pop-out, p < 10-5, χ2 test).
34 | C o n t r o l o f A t t e n t i o n
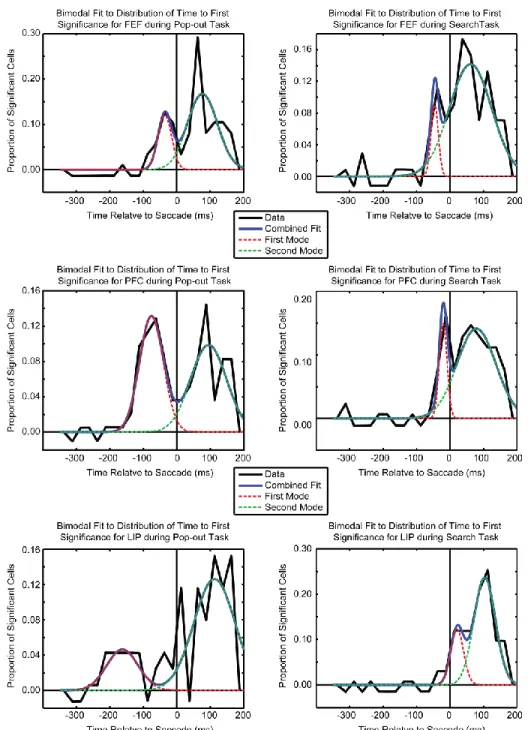
The time to first significance was determined for each neuron recorded, generating a
distribution of when neurons from each anatomical region first found the target location relative to the start of the saccade. These distributions are shown in Figure 5. During pop-out, there was a bimodal distribution for all three regions (Figure 5, left). For each area there was a population of neurons that first found the target well before the saccade (i.e., shortly after visual array onset) and a separate population that found the target after the saccade. The early population consisted of 35% of all target location selective neurons in LIP (24/68), 51% in dlPFC (40/78), and 31% in FEF (17/54). During pop-out there were clear differences in timing across these early populations: LIP neurons found the target first, followed by dlPFC neurons, and then FEF neurons.
In contrast, during the search task, neurons began finding the target later than in pop-out, just before the saccade, and in the reverse order: the frontal areas (dlPFC and FEF) showed selectivity first, followed by LIP (Figure 4B). About 1/3 of all selective neurons in FEF and dlPFC began to reflect the target location before the saccade (19/60 and 21/70, respectively), while only 14% (8/58) of selective LIP cells did so. This is greater than expected by chance for FEF and dlPFC but not for LIP (p = 8*10-5, p = 4*10-5, and p = 0.41, respectively, tested against binomial distribution).
The distribution of when individual neurons in each area first showed significant information for the target location appeared to be multimodal. In order to quantify the number and location of modes we fit models with a mixture of one, two, or three Gaussians to the data. We used the Bayesian
Information Criterion (BIC, Schwarz, 1978) to determine how well each model fit the observed data. The BIC is a combination of the residuals between the model and data and the number of free parameters in the model, correcting for the advantage of more complex models. The model with the lowest BIC is the model that has the best fit to the data without over-parameterization. As is shown in Table 1 we found that a bimodal distribution fit the best for the observed data in all three anatomical regions during both search and pop-out. The resultant R2 of the fits (Table 2) all show a large proportion of the variance in the observed data was captured by the mixture of Gaussians. The bimodal fit estimated both the mean and variance of the distributions. The deviation about each parameter was estimated using the Fisher Information and was used to both calculate a confidence interval for each parameter and to test for significant differences between areas (similar to a t-test).
35 | C o n t r o l o f A t t e n t i o n
Figure 4
Figure 4. The firing rate of example LIP and LPFC neurons during the visual pop-out task (left column,
top and bottom, respectively). Trials were aligned on saccade in order to capture the shift of attention before the saccade. Selectivity for target location, regardless of the identity of the target, can be clearly seen in the firing rate histograms and was captured in the mutual information statistic. Panels in the right column show the amount of information about the target location carried in the firing rate for the example LIP and LPFC neurons, respectively. The amount of information over time is shown for both the visual search and pop-out tasks. The asterisk indicates the time-point at which the observed amount of information was significant for two consecutive bins at p < 0.05. This marks the time to first significance. The population effects shown in the main text are reflected in these example neurons: during pop-out, selectivity in LIP precedes LPFC, while during search, LPFC precedes LIP.