HAL Id: hal-01787406
https://hal.archives-ouvertes.fr/hal-01787406
Submitted on 7 May 2018
HAL is a multi-disciplinary open access
archive for the deposit and dissemination of
sci-entific research documents, whether they are
pub-lished or not. The documents may come from
teaching and research institutions in France or
abroad, or from public or private research centers.
L’archive ouverte pluridisciplinaire HAL, est
destinée au dépôt et à la diffusion de documents
scientifiques de niveau recherche, publiés ou non,
émanant des établissements d’enseignement et de
recherche français ou étrangers, des laboratoires
publics ou privés.
3D Cities Rendering and Visualisation: A Web-Based
Solution
Noura El Haje, Jean Pierre Jessel, Véronique Gaildrat, Cédric Sanza
To cite this version:
Noura El Haje, Jean Pierre Jessel, Véronique Gaildrat, Cédric Sanza. 3D Cities Rendering and
Visual-isation: A Web-Based Solution. Eurographics Workshop on Urban Data Modelling and Visualisation
(UDMV 2016), Dec 2016, Liege, Belgium. pp. 95-100. �hal-01787406�
O
pen
A
rchive
T
OULOUSE
A
rchive
O
uverte (
OATAO
)
OATAO is an open access repository that collects the work of Toulouse researchers and
makes it freely available over the web where possible.
This is an author-deposited version published in :
http://oatao.univ-toulouse.fr/
Eprints ID : 18984
The contribution was presented at UDMV 2016
To link to this article URL :
http://dx.doi.org/10.2312/udmv.20161426
To cite this version :
El Haje, Noura and Jessel, Jean-Pierre and Gaildrat,
Véronique and Sanza, Cédric 3D Cities Rendering and Visualisation: A
Web-Based Solution. (2016) In: Eurographics Workshop on Urban Data Modelling
and Visualisation (UDMV 2016), 8 December 2016 - 8 December 2016
(Liege, Belgium).
Any correspondence concerning this service should be sent to the repository
administrator:
[email protected]
3D Cities Rendering and Visualisation: A Web-Based Solution
N. El Haje J.P. Jessel V. Gaildrat and C. Sanza
Institut de Recherche en Informatique, Toulouse, France
Abstract
3D cities reconstruction and visualisation have always been a challenging area. Many software have been developed for con-structing, editing and visualising 3D virtual cities. These software that allow the semi-automatic generation of virtual cities whether destined for visualisation, simulation and games have largely reduced the cost and charges of manual generation and sometimes their work outstrips the geometry to reach the semantics at a higher level. However, for faster and better perfor-mance, we are focusing on the visualisation and management of real-world data and more precisely geographic data for the web. This data is written in different standards and is largely available to users and cost free. This paper proposes a user intu-itive solution based on the quite recent ArcGIS software Application Programming Interface (API) and CityGML (Geography Markup Language) in order to visualise and manage a real interactive editable city.
1. Introduction
The advancement in computer graphics and web technologies have largely revolutionized large data reconstruction and management techniques. This allowed large data to be revealed to the user who could more easily interact and interpret large 3D data such as urban environments. Geographic Information Systems (GIS) based appli-cations have made rapid evolution in the web, which has created a need to develop platform-independent web applications, based on recent standards and formats.
CityGML [KGP05] is a common Information Model and an XML (Extensible Markup Language)-based encoding that de-scribes 3D objects with respect to their geometry, topology, seman-tics, and appearance. It aims at describing, storing and exchanging virtual 3D models. This standard not only allows to understand the spatial properties of urban data, but also provides a common plat-form to integrate city level inplat-formation from different resources and make them accessible to the concerned people.
ArcGIS [Arc] is a GIS (Geographic Information System) that works with maps and geographic information. It allows the cre-ation and use of maps, compilcre-ation of geographic data and analysis of mapped information. This information system provides an in-frastructure for making maps and geographic information available throughout an organization, across a community, and openly on the web.
The ArcGIS 3D has a City Information Model called (3DCIM) that works very well for data management, analysis, and visualisa-tion. With the 3DCIM, 3D city models can be brought into ArcGIS and used for a wide range of applications. Therefore, these two are
complementary, and interoperability between them is essential to achieve all the solution capabilities of the 3D cities environment. Up to now, there have been many web-based attempts to provide 3D contents using specific plugins. Our solution of city visualisa-tion suggests developping a web applicavisualisa-tion dependent on the two standards explained above. The final objective is to allow the user to reconstruct the geometry and manipulate the semantics of the 3D layers from the CityGML file.
In this paper, we will address in the first section existing web-based solutions for real cities rendering and visualisation. We will then explain our ArcGIS API-based solution tools and require-ments in details. In Section 3, we will hold a discussion about the solution, followed by a comparison between our solution and the widely used WebGL framework "Cesium" in the case study of sec-tion 4. In this secsec-tion we will eventually discuss the limitasec-tion of the Cesium framework. Finally we will conclude our paper and suggest our future research direction.
2. 3D Cities Visualisation
Three-dimensional city models are considered a very important resource for multi-purposes domains such as urban planning and decision-making [VOSL05]. Many of them are based on informa-tion stored in GIS. This direcinforma-tion is worse exploring because of many advantages it offers such as the large amount of data avail-able to the user, presented in different types and formats [SH15]. This allows the user the possibility to embed the data in one single interface and create multi-purposes applications.
city models became widely available. Recent works have been pro-posed for this purpose and several solutions for porting the frame-works on the web are investigated. The work of Rodriguez et al. [RFC13] describes how GIS for the 3D web is implemented by converting CITYGML into X3D models and is visualized through the web. Implementations about the use of WebGL frameworks for 3D geospatial applications are presented in the work of Kramer and Gutbell [RKT09].
To support 3D visualisation on the web an emerging technology is for sure WebGL. On top of WebGL a number of OpenSource frameworks that offer high-level application programming inter-faces (APIs) are quickly growing on the Internet community. In this paper, we will compare our solution for dynamic visualisation based on ArcGIS API with the webGL framework Cesium largely used for the same purpose.
2.1. 3D Visualisation: Tools, Standards and Software
In order to visualize a city in real-time, Beck [Bec03] directly em-loyed OpenGL to visualise 3D city models. In order to achieve the high speed, the framework employed the computer graphics re-lated technologies such as pre-stripping the triangles, frame con-trols, texture management etc. The data is contained in a databse in self-defined 3D format and integrated with the textures. LODs are used to display several geometric representations of the same object at different times. Fewer details are represented when the object is far away and more detailed when it is closer to the observer.
Dollner et al. (2005) [DB05] presented a direct illustrative visu-alisation technique to provide expressive representations of large-scale 3D city models. Their rendering algorithm consists of four phases: Phase 1 generates a texture encoding shadowed regions in image space, Phase 2 renders the scene with enhanced image-space edges, shaded and textured facades, Phase 3 renders stylized edges, and Phase 4 renders remaining components of the 3D city model.
Although it may increase the visualization speed, the direct vi-sualization framework has to deal with basic computer graphics is-sues such as frame control, scene rendering etc, which could in-crease development difficulties and workload. In addition, different versions of the visualization programs need to be developed for different platforms. Furthermore, the details related with the basic operation system and graphics interfaces may highly influence the portability of the visualization framework. For all of these reasons, we decided to focus on the visualization of 3D cities based on 3D standards.
An effective technique used for buildings rendering is the ex-trusion of 2D building shapes. This first modeling approach has been used successfully over the Internet, either with browser or plugins developed for this purpose (e.g.Google Earth [GM]), or using OpenGL web-based development. A number of automated techniques that generate block models including roof geometry ex-ist [BHF01]. The output represents LOD1 and LOD2 building mod-els according to the CityGML specification [OGe]. However, these techniques lack a differentiated treatment of general site models such as bridges and tunnels.
As for the web focused solutions, Google Maps is one of
the solutions of rendering real cities with a fluid experience to the user [VMNRG15]. OSM (OpenStreetMap) offers a large open source geospatial data. Some projects such as OSM Build-ings [OSM] use OpenStreetMap as their database and manage to display 3D models of a great number of cities.
CityEngine [cita] is a 3D modeling software application devel-oped by Esri R& D center Zurich and is specialized in the gener-ation of 3D urban environments. CityEngine supports the cregener-ation of detailed large-scale 3D city models. The software uses a proce-dural modeling approach to automatically generate models through a predefined rule set. It offers the possibility to directly publish the created scenes on the web for sharing 3D models, analysis results, or design proposals with decision makers or the public.
Another project that uses a declarative approach for 3D render-ing is CityServer3D [citb]. Cesium is an open source javascript li-brary [ces] to create 3D virtual globes as well as 2D maps on a web browser. Its advantage is the possibility to integrate layer imageries from different sources such as OpenStreetMap, ArcGIS MapServer and standard image files. It also includes libraries that support 2D as well as 3D geometries.
2.2. 3D City Storage
Object- Oriented databases are nowadays the most used to store 3D model building information [LFB11]. The CityGML schema uses dedicated tools to manage city models within most popular databases such as PostGIS and Oracle. According to Mao et al. [MHC∗14] and Han et al. [HS12] , recent databases: NoSQL,
Mon-godb and Hbase have been investigated as alternative systems to store 3D information.
The 3D City Database (3DCityDB) Importer Exporter [Dat] is an open source used to import CityGML files to a 3D city database and export the contents from this database in an earth browser com-patible format. Another solution has been proposed by Gesquiére and Manin [GM12]. It provides a WebGL visualisation with tiled data (terrain and buildings). Their paper proposes a strategy to ex-change only additional buildings that have not already been sent. In this solution, it is possible to exchange geometry and semantics data linked to city objects.
In recent years, several private companies have produced com-mercial softwares for building extraction (e.g BRec by virtualCi-tySystem [vci], TerraScan by TerraSolid [Ter], and VRMesh by Virtual Grid [Vrm]). In such products, datasets such as build-ings footprints and orthophotos are generally used to perform the generation of the 3D buildings geometries. However, a post-processing editing is generally performed on models in order to cor-rect and improve the quality of the automatically generated mod-els [MNA∗13].
Next, we are going to develop the architecture of our proposal for existing cities rendering, followed by explanation of each com-ponent of this architecture, and a comparison with the framework Cesium. The comparison includes the visualisation strategies used in both framework and the advantages of one over the other.
Architecture (SOA). They provide to the client scene graphs ge-ometry, triangle meshes and textures. Reitz et al. and Prieto et al. [RKT09] [PIdH12] developed a visualisation system based on SOA. Another famous applications such as Bing Maps and Google Maps depend on the generation of reliable meshes for visualisa-tion [Kus13].
3. Design and Implementation
The Information level is formed by 3D city database (3DCityDB) that is an open source geodatabase schema containing a set of tools for the management of large 3D city models and in particular to import the CityGML datasets. In order to import the 3D CityGML models, the 3DCityDB is used.
The 3DCityDB implementation is based on PostGIS database, which is the spatial extension of the open source Postgres database. This allows the capability to manage the access to the database ta-bles or views via web using standard web services developed by the OGC consortium. The combination of these two 3DcityDB fea-tures allows us to implement our system architecture by splitting the geometric part of the original 3D CityGML models from the semantic one.
The implementation consists of the three following steps: • Pre-Processing: this step is about converting the CityGML files
into 3D files formats such as Collaborative Design Activity (COLLADA) to be displayed in the web using the tool 3DCi-tyDB Importer Exporter explained in the previous section. This conversion is necessary because the CityGML file is not suit-able to be directly visualised on web browsers. It exists however softwares for externally visualise and edit a CityGML file such as FME. The choice of converting the CityGML file into COL-LADA is due to the compatibility of this format with the earth browser ArcGIS, our main interest from the beginning. • Server: the server includes running Apache HTTP, with an
HTML file and files related to ArcGIS API. The HTML file con-tains the interaface parameters in order to enable the user to visu-alise and interact with the ArcGIS map. The server includes also the resulting 3D file COLLADA obtained from the conversion process of the first step. It is parsed by the Javascript to allow the interaction with the 3D features of the city. Thanks to 3DC-ityDB, the features import could be chosen regarding the object id, bounding box or city objects such as buildings, water body, transportation or vegetation.
• User: In our opinion, this is the most challenging part of the project. The web application should allow the user to make some interactions and launch queries in the environment. Therefore, many functionality had to be put in place. The first was to load the buildings in their right place. These buildings are first loaded in LOD1. The user has the ability to zoom, pan and rotate the camera to visualise the buildings from different angles. The base layer used is ArcGIS API map.
3.1. Data Usage
The intention behind this solution is to allow the user (the client) to make use of the stored data in the 3DCityDB. In other words,
the semantics of the 3D objects should be visible to the user. To accomplish this, the server provides the client actual data in the form of an HTML file and a javascript for ArcGIS API.
The application level consists of many features:
• Data Exploration: Either by clicking on the search tool for a specific city or clicking directly on the city name. Tiles will be loaded without the 3D first. At this phase, only the 2D map of the city is loaded. 3D city objects are stored under the processed file (resulting from the pre-processing step of the CityGML file). It is stored on the HTTP server and the different layers are parsed by the javascript of the web application. The client is therefore able to load and unload the tiles geometry according to their vis-ibility.
• Accessing the information: Choose which layer to display from the city, in other worlds the client manages the picking of the 3D model geometries, its height or width.
• Modification: the client should be able to change the specifica-tion of a model in the city, which means changing its semantics and geometry, add more buildings or more vegetation in the city. It could also mean changing the light or adding shadows to the scene.
Figure 1 shows the general architecture of our solution.
Figure 1: The solution architecture with the different components
4. Case Studies
The case studies provided are for our solution ArcGIS API and the most used open source CesiumJS.
The first case study uses utilizes an API of the 3D plateform Ar-cGIS for 3D buildings visualisation. The data are exported from 3D CityDB in CityGML format, and are loaded in a custom servlet, which parses and transforms the CityGML file into the format COLLADA. This custom format contains only hierarchical, geom-etry and reference information which is then used by the client to get an object id to query and to potentially obtain all the informa-tion present in the 3D CityDB.
In this showcase (Figure 2), the base layer used is ArcGIS API map.
Figure 2: Display test of the city of Portland using ArcGIS API.
CesiumJS: CesiumJS is a Javascript based spinning globe. It uti-lizes WebGL to provide hardware acceleration and plugin indepen-dence and provides cross-platform and cross-browser functional-ity. CesiumJS allows the visualisation of geographical data through OGC standards for data interoperability. It also allows the render-ing of 3D models based on the glTF data format.
This case study uses the open source Cesium Server. A custom loader is implemented with low level API. A KML file of the city is then parsed and loaded into a data structure that holds geometry information, which is rendered by Cesium rendering code.
This solution could handle large amount of data but is not as performant as a custom built rendering engine. There’s also the memory problem occuring from such web solutions that need to be investigated further.
Figure 3: Display test using CesiumJS.
4.1. Visualisation Strategies
The major advantage of tile-based approach for visualising the city is that it allows progressive visualisation, which means, only the area required to be visualized will be fetched from the server.
ArcGIS provides a tile package that allows the creation of a set of tiles as images from a map, and then uses the set of tiles as a basemap in ArcGIS applications. The set of tiles in ArcGIS is known as a tile cache. Basemaps are usually made of pre-made
Figure 4: Classic Quadtree Subdivision
Figure 5: Traditional Octree Subdivision
tiles. This allows a faster visualisation than other basemaps. Al-though it takes the user some time to create the tile package, the cost is a one-time cost. Users of the resulting basemap will not have to wait for the images to be created. The more users there are, the higher the benefit of that one-time cost.
Meanwhile, if the user needs to visualise the data live on the basemap, with no time delay acceptable, then the tile packaging is not appropriate. The reason being that the tile package represents a snapshot of the map at one point in time. Therefore, the package works best with maps that do not change frequently, such as street maps, imagery, and terrain maps.
On the other hand, Cesium uses many 3D tiles approaches for vi-sualisation, grouped in what’s called a tileset. Each tile in Cesium has a bounding volume completely enclosing its contents. The tree has spatial coherence: the content for child tiles are completely in-side the parent’s bounding volume. To allow flexibility in render-ing, the tree can be any spatial data structure with spatial coherence, including k-d trees, quadtrees, octrees, and grids. Figures below show a representation of two 3D tiles subdivision used in Cesium: the Quadtree and the Octree subdivision.
In order to visualise properly the data, it has to be processed, so it can be handled by the client. In Cesium, two related open-source projects exist for this purpose.
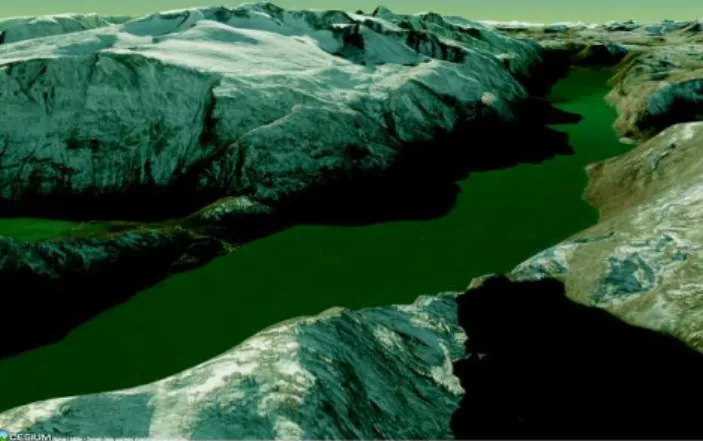
Cesium Terrain Builderprocesses the data so that is divided into an octree and stores it in Cesium’s standard height map for-mat. The Cesium Terrain Server can be used to host the data. The tools require only two commands to prepare or serve the data. Fig-ure below shows how a high resolution surface model looks like in Cesium with the standard height map format.
It can be seen that the structures next to the camera are detailed, but also in the distance enough detail is streamed so the viewer gets a good idea of the landscape structure. We could say that the terrain
server in Cesium makes the visualisation experience of landscapes more fluid in Cesium than in ArcGIS.
Figure 6: Visualisation based on Cesium with terrain processed
by Cesium Terrain Builder.
STK Terrain Server
The quantized mesh format is supposed to save transfer volume by optimising single tiles. The STK Terrain Server is a commercial product that can be accessed via a web interface and allows users to manage the source data files as well as the processed and hosted data. The processing is fast and the data is immediately accessible via a standard Cesium visualisation.
The benefit that this server has over the Cesium Terrain Builder is the support for light maps on the quantized mesh. Usually, Cesium contains a time slider that allows users to choose a time of day. The terrain will be rendered accordingly. Figure below shows a result of using the STK Terrain Server.
Figure 7: Visualisation based on Cesium with terrain processed
by Cesium Terrain Builder.
5. Conclusion and Recommendation
We have introduced a solution for 3D cities rendering that merges both the semantics and the geometry. This solution is based on many standards, tools and APIs that communicate together in order to offer to the user an optimized solution in terms of performance and offered functionality.
The user interaction with the web application should evolve and be more intuitive. This is an aspect we are currently working on. One of the interactions is the search for a specific city in the map. He could also load some of the buildings and by simply clicking on a building, he has the possibility to view the building’s type.
The ability to add more buildings to the environment which could not be loaded by our system is an aspect under investiga-tion. Another improvement to make is to add textures instead of materials for a more realistic vision.
As we have seen from the case study, CesiumJS is a very valid platform to start working with. However, it inherits Javascript lim-itations and performances issues, which greatly vary from browser to browser due to the different Javascript engines implementa-tion.To this reason, current WebGL browsers fail to render huge 3D city models.
In the other hand, Cesium is in a medium position between an open-source development and a proprietary one. Additional work is useful to propose 3D visualisations of large datasets. For this reason, we needed to develop the ad-hoc solution to overcome some of the mentioned limitations.
The servers which are offered by Cesium and detailed in sec-tion 4 represent a true advantage of rendering realistic landscapes. Since our focus is on 3D buildings display, this advantage is to be discarded. In our opinion, working on geospatial real data is go-ing to continue improvgo-ing with the evolution of web solutions and internet connection, which allows loading of thousands of build-ings within few seconds, not to mention the possibility of moving smoothly between different LODs.
The development of applications to render cities can be helpful for simulation, planning purposes and game content design, espe-cially if the reconstruction process offers the ability for the user to export the environment in compatible formats with the game en-gine.
References
[Arc] (ArcGIS for developers) http://developers.arcgis.com/ javascript/.1
[Bec03] BECKM.: Real-time visualization of big 3d city models.
Inter-national Archives of the Photogrammetry Sensing and Spatial Informa-tion Sciences 34(2003).2
[BHF01] BRENNERC., HAALAN., FRITSCHD.: Towards fully auto-mated 3d city model generation. Automatic Extraction of Man-Made
Objects from Aerial and Space Images (III)(2001), 47–57.2
[ces] (Cesium Virtual Globe and Map Engine)http://cesiumjs.org/.
2
[cita] (City Engine Software) http://esri.com/software/ cityengine/.2
[citb] (CityServer3D)http://cityserver3d.de/en/.2
[Dat] (3D City Database) http://kg.uni-bonn.de/index.php?id= 253/.2
[DB05] DÖLLNERJ., BUCHHOLZH.: Continuous level-of-detail mod-eling of buildings in 3d city models. In Proceedings of the 13th
an-nual ACM international workshop on Geographic information systems
(2005), ACM, pp. 173–181.2
[GM12] GESQUIÈRE G., MANINA.: 3d visualization of urban data based on citygml with webgl. International Journal of 3-D Information
Modeling (IJ3DIM) 1, 3 (2012), 1–15.2
[HS12] HAN D., STROULIA E.: A three-dimensional data model in hbase for large time-series dataset analysis. In 2012 IEEE 6th
Interna-tional Workshop on the Maintenance and Evolution of Service-Oriented and Cloud-Based Systems (MESOCA)(2012), IEEE, pp. 47–56.2
[KGP05] KOLBET. H., GRÖGERG., PLÜMERL.: Citygml: Interoper-able access to 3d city models. In Geo-information for disaster
manage-ment. Springer, 2005, pp. 883–899.1
[Kus13] KUSCHK G.: Large scale urban reconstruction from remote sensing imagery. International Archives of the Photogrammetry, Remote
Sensing and Spatial Information Sciences 5(2013), W1.3
[LFB11] LONGN., FLEMINGK., BRACKNEYL.: An object-oriented database for managing building modeling components and metadata.
Golden, CO: National Renewable Energy Laboratory. Preprint. Pre-pared for Building Simulation(2011), 14–16.2
[MHC∗14] MAOB., HARRIEL., CAOJ., WUZ., SHENJ.: Nosql based
3d city model management system. The International Archives of
Pho-togrammetry, Remote Sensing and Spatial Information Sciences 40, 4
(2014), 169.2
[MNA∗13] MOREIRAJ. M., NEXF., AGUGIAROG., REMONDINOF.,
LIMN. J.: From dsm to 3d building models: a quantitative evaluation.
Int Arch Photogramm Remote Sens Spatial Inf Sci XL1 W, Hannover, Germany 1(2013), 213–219.2
[OGe] (OpenGeospatial standards) http://opengeospatial.org/ standards/common/.2
[OSM] (OpenStreetMap Buildings Project ) http://osmbuildings. org/.2
[PIdH12] PRIETOI., IZKARAJ. L.,DELHOYOF. J. D.: Efficient vi-sualization of the geometric information of citygml: application for the documentation of built heritage. In International Conference on
Com-putational Science and Its Applications(2012), Springer, pp. 529–544.
3
[RFC13] RODRIGUESJ. I., FIGUEIREDOM. J., COSTAC. P.: Web3dgis for city models with citygml and x3d. In IV, University of London,
Lon-don, UK(2013), pp. 384–388.2
[RKT09] REITZT., KRÄMERM., THUMS.: A processing pipeline for x3d earth-based spatial data view services. In Proceedings of the 14th
international conference on 3D web technology, Darmstadt, Germany
(June 2009), ACM, pp. 137–145.2,3
[SH15] SHANGMINGQ., HAOSHENGH.: Web-based spatial data vi-sualization and analysis using the new web standard. In 2015 AASRI
International Conference on Circuits and Systems (CAS 2015)(2015), Atlantis Press.1
[Ter] (Terrascan Solution by Terrasolid) http://terrasolid.com/ home.php/.2
[vci] (Virtual City System)http://virtualcitysystems.de/en/.2
[VMNRG15] VALENCIA J., MUÑOZ-NIETO A., RODRIGUEZ -GONZALVEZP.: Virtual modeling for cities of the future. state-of-the art and virtual modeling for cities of the future. state-of-the art an. The
International Archives of Photogrammetry, Remote Sensing and Spatial Information Sciences 40, 5 (2015), 179.2
[VOSL05] VANOOSTEROMP., STOTERJ., LEMMENC.: Modelling of 3d cadastral systems. In 28th cadastral seminar, Busan, Korea (2005), pp. 594–606.1