Sequential effects of propofol on functional brain activation
induced by auditory language processing: an event-related
functional magnetic resonance imaging study
W. Heinke
1*, C. J. Fiebach
2, C. Schwarzbauer
3, M. Meyer
4, D. Olthoff
1and K. Alter
21
Department of Anaesthesiology and Intensive Care Therapy, University of Leipzig, Germany.
2Max Planck
Institute of Cognitive Neuroscience, Leipzig, Germany.
3MRC Cognition and Brain Sciences Unit,
Cambridge, UK.
4Department of Neuropsychology, Institute of Psychology, University of Zurich,
Switzerland
*Corresponding author. E-mail: [email protected]
Background. We have investigated the effect of propofol on language processing using event-related functional magnetic resonance imaging (MRI).
Methods. Twelve healthy male volunteers underwent MRI scanning at a magnetic ®eld strength of 3 Tesla while performing an auditory language processing task. Functional images were acquired from the perisylvian cortical regions that are associated with auditory and language processing. The experiment consisted of three blocks: awake state (block 1), induction of anaesthesia with 3 mg kg±1propofol (block 2), and maintenance of anaesthesia
with 3 mg kg±1h±1propofol (block 3). During each block normal sentences and pseudo-word
sentences were presented in random order. The subjects were instructed to press a button to indicate whether a sentence was made up of pseudo-words or not. All subjects stopped responding during block two. The data collected before and after the subjects stopped responding during this block were analyzed separately. In addition, propofol plasma concentra-tions were measured and the effect-site concentraconcentra-tions of propofol were calculated.
Results. During wakefulness, language processing induced brain activation in a widely distributed temporofrontal network. Immediately after unresponsiveness, activation disappeared in frontal areas but persisted in both temporal lobes (block 2 second half, propofol effect-site concentration: 1.51 mg ml±1). No activation differences related to the task were
observed during block 3 (propofol effect-site concentration: 4.35 mg ml±1).
Conclusion. Our ®ndings suggest sequential effects of propofol on auditory language processing networks. Brain activation ®rstly declines in the frontal lobe before it disappears in the temporal lobe.
Br J Anaesth 2004; 92: 641±50
Keywords: anaesthesia, anaesthetic action; anaesthetics i.v., propofol; brain, auditory language processing; brain, functional magnetic resonance imaging
Accepted for publication: December 7, 2003 Many anaesthetics, including propofol, depress cerebral metabolism. This metabolic depression seems to affect cognitive function gradually in a dose-dependent manner from full consciousness to drug-induced unconsciousness.1
Though much work has been done to reveal the action of propofol at the molecular level, the in vivo mechanism of propofol at the level of large cortical networks is not fully understood. Recent positron emission tomography studies have demonstrated that the effect of propofol is mediated by acting on speci®c neural networks rather than by causing a
global decrease in central nervous system activity.1 2 In
particular, frontal association areas have been suggested to be highly sensitive to the drug effect.2
Hierarchically organized cognitive mechanisms sup-ported by large-scale temporofrontal networks are thought to underlie the neurocognition of language. Models of language processing assume that anterior superior temporal regions are involved in the analysis of speech sounds, whereas more complex aspects of language processing involve the left frontal brain regions, such as Broca's
region.3 The frontal cortices are particularly sensitive to
anaesthetics and we therefore expected differential effects of propofol anaesthesia on complex auditory language processing compared to auditory language processing in the temporal lobe. In order to test this hypothesis we investi-gated how language processing networks are affected by propofol. We employed functional magnetic resonance imaging (fMRI) based on the blood oxygenation level dependent (BOLD)-contrast.4 Using this technique, fMRI
images of eight axial slices covering the perisylvian brain areas associated with auditory language processing were acquired during different anaesthetic conditions while subjects were performing an auditory language processing task.
Methods
Subjects
Twelve healthy male volunteers between the ages of 28 and 37 yr (mean: 32.4) participated in the study. Females were excluded from the study because of the possibility of sex differences in task-induced activation of the brain.5
All subjects were handed anaesthetists. The right-handedness was con®rmed using the Edinburgh Handedness Inventory.6 The study was approved by the local Ethics
Committee of the Medical Faculty, University of Leipzig. The Ethics Committee obliged us to choose anaesthetists as subjects for the study as they argued that, in contrast to other volunteers, anaesthetists were able to assess the risk of anaesthesia in a magnetic resonance (MR)-research environment. Therefore, the purpose of the study as well as the study design was explained to 14 young male anaesthetists of our department. After explanation of the study these colleagues were asked to participate: two refused. After detailed information about the experiment, written informed consent was obtained from each of the 12 participants prior to the study. The subjects were instructed not to eat or drink for 6 h before the experiment, and to refrain from consuming alcohol, caffeine or using any medication on the day of the experiment. All subjects were instructed about the task prior to the actual experimental session.
Experimental Design and Procedure
General procedure and anaesthesia
The volunteers were positioned supine on the gantry of the scanner. Foam padding was used to limit head movement. The subjects wore earplugs and special headphones designed for auditory fMRI experiments in order to avoid interference from the noise of the scanner.
An intravenous catheter was inserted in the left forearm to administer propofol and an intra-arterial catheter was placed in the left radial artery to draw blood samples in order to
determine arterial propofol plasma concentrations and arterial carbon dioxide partial pressure (PaCO2). The heart
rate, invasive blood pressure and peripheral arterial oxygen saturation were monitored continuously during the entire session using an MR-compatible monitoring system (MR 9500, MR-Equipment Corporation, Bayshore, NY, USA). Propofol was delivered via an MR-compatible infusion system. The participants breathed spontaneously and add-itional oxygen (5 litre min±1) was given via a face mask
during the experiment.
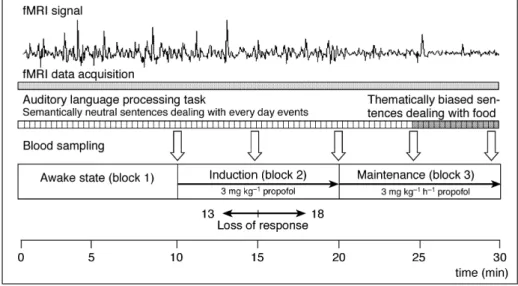
The experimental procedure consisted of three blocks. The duration of each block was 10 min. The ®rst block served as a control block, during which participants were awake and performed a cognitive task (see below). Sentences at a rate of one every 12 s were played to the participants through the headphones throughout the experi-ment (a total of 30 min).
At the beginning of the second block (induction block) anaesthesia was induced by a propofol infusion of 3 mg kg±1. Anaesthesia was induced over a period of 10 min
to achieve a slow transition from wakefulness to uncon-sciousness. Following the induction period, propofol anaesthesia was maintained using a continuous infusion rate of 3 mg kg±1 h±1 for 10 min in the third part of the
experiment (maintenance block). The experimental protocol is summarized in Figure 1.
Arterial blood samples were obtained 10, 15, 20, 25 and 30 min after the beginning of the experiment in order to determine the PaCO2, and at 15, 20, 25 and 30 min in order to
determine the arterial propofol plasma concentration. The PaCO2 samples were analysed immediately. Each blood
sample for determination of the propofol plasma concen-tration was collected in a heparinized tube and centrifuged at 2800 rpm for 15 min. The plasma was separated and stored at ±20°C. The arterial plasma propofol concentration was measured using high-pressure liquid chromatography (HPLC).
In addition, the propofol plasma and effect-site concen-trations were estimated based on a three-compartment pharmacokinetic model using the Stanpump software package (Diprifusorâ-algorithm, Pharmacokinetics and
Pharmacodynamics Software Server, Department of Anesthesia, Stanford University, USA) with an effect-site equilibration rate constant (ke0) of 0.20 min±1.7The
effect-site concentration is a concept that re¯ects the actual drug action in the brain: changes in the effect-site concentration lag behind changes in plasma concentration.
Auditory language task
Stimuli
For each block, 20 normal and 20 pseudo sentences as well as 10 `empty trials' were presented in random order (inter-stimulus interval, around 8.5 s; typical duration of sentence, 3.5 s; stimulus onset asynchrony, 12 s). The normal
sentences were grammatically, semantically and phonolo-gically correct sentences (e.g. The anxious mother searches for the crying child). The pseudo sentences were correct in syntax and phonology, but consisted of phonotactically legal pseudo words in the place of content words (e.g. The mumpfy folofel hongers the apolding trekon). During an `empty trial' no auditory information was presented. The random interleaving of the sentence events with such `empty trials' is essential for the ef®cient estimation of the entire haemodynamic response in rapid event-related fMRI designs.8
The subjects were instructed to press one of two buttons to indicate whether a sentence was made up of pseudo-words or not. This response was used to assess the behavioural state of the subjects during the experiment (note that we were not interested in processing differences between each type of speech). The lack of an explicit motor response was taken as behavioural evidence for a severe impairment of cognitive function produced by propofol.
As far as the normal sentences are concerned, semanti-cally neutral sentences dealing with everyday events were presented except for the last 5 min of block 3. During this period, thematically biased sentences exclusively dealing with aspects of food were presented. The subjects were assumed to be unconscious during this period and therefore not able consciously to perceive the meaning of the sentences. After waking, the volunteers were asked if they remembered a particular theme to the sentences (which they should not according to our predictions). The presentation of semantically biased sentences was employed as a method
to assess the memory of the participants during the third block of the experiment.
Functional magnetic resonance imaging
All experiments were performed on a 3 Tesla whole body scanner (Medspec 30/100, Bruker, Ettlingen, Germany) equipped with a quadrature birdcage head resonator and an actively shielded whole-body gradient set capable of switching 30 mT m±1 in 500 ms. The MPIL software
package developed at the Max-Planck-Institute of Cognitive Neuroscience in Leipzig was used to drive the console.
The fMRI was performed on the basis of a conventional blipped echo-planar imaging (EPI) sequence.9The imaging
parameters were: matrix size, 64 3 64; ®eld of view, 22.4 3 22.4 cm; in-plane spatial resolution, 3.5 3 3.5 mm; slice thickness, 5 mm; inter-slice gap, 2 mm; repetition time, 2 s; echo time, 30 ms; acquisition bandwidth, 100 kHz. Eight axial slices were acquired in parallel to the plane intersect-ing the anterior and posterior commissures (AC±PC plane), thus covering all cortical regions associated with auditory and language processing in the middle and inferior frontal lobe as well as in the middle and superior temporal lobe. Furthermore, the inferior parietal lobe, the occipital lobe and the thalamus were completely covered.
Prior to the fMRI experiment, high resolution anatomical images were obtained from the same slices by using a MDEFT (modi®ed driven equilibrium Fourier transform) imaging sequence10with the following imaging parameters:
matrix size 2563256; ®eld of view, 22.4322.4 cm; in-plane
Fig 1 Experimental protocol. Stimuli (auditory presented sentences vs resting state) were presented during three epochs corresponding to the following experimental conditions: awake state (block 1), induction of anaesthesia (block 2), and maintenance of anaesthesia (block 3). During each block 20 normal sentences (semantically neutral sentences during the ®rst two blocks, thematically biased sentences during the second half of the third block) and 20 pseudo sentences were presented in a random order (see Methods). All subjects stopped responding to the task during the second block of the experiment at between 5 and 8 min after commencement of the propofol infusion (mean 5.1 min, 15.1 min after beginning of the experiment). Functional magnetic resonance imaging (fMRI) data were continuously acquired during the entire experiment. As a representative example we show a typical fMRI signal response of a single voxel obtained from one subject at the gyrus temporalis superior (x=±63, y=±23, z=8).
spatial resolution, 0.87530.875 mm; slice thickness, 5 mm; inversion time, 0.65 s; recovery time, 0.65 s; echo time, 6.1 ms; total acquisition time, 5.5 min.
In a different imaging session, a three-dimensional (3D) data set was acquired using 3D MDEFT imaging.11 The
imaging parameters were: matrix size, 25632563128; ®eld of view, 25.0325.0319.2 mm; spatial resolution, 0.930.9831.5 mm; inversion time, 0.65 s; recovery time, 0.65 s; echo time, 6.1 ms; total acquisition time, 19 min.
Image processing and statistical analysis
The LIPSIA software package12was used for data analysis.
It comprises tools for pre-processing, registration, statistical evaluation and presentation of fMRI data. The statistical routines are identical with those of the SPM 99 package.
Functional data were pre-processed by applying a move-ment correction, a correction for slice acquisition time differences using sinc interpolation, as well as a baseline correction removing drifts and noise by applying a temporal high pass ®lter. The cut-off value was determined automat-ically, based on the frequency of occurrence of the different types of event. In the latter step, a spatial smoothing was also applied using a Gaussian kernel of 4.9 mm full width at half maximum (FWHM). Pre-processed data were co-registered with high-resolution anatomical 3D brain scans and then normalized to Talairach and Tournoux space.13
For the statistical analysis, the design matrix was generated with a box car function corresponding approxi-mately to the length of the sentences (i.e. two time steps) and was then convolved with the pre-processed raw data using a Gaussian kernel of dispersion of 4 s FWHM. The general linear model was used to estimate beta parameters for the stimulation condition (encompassing correct and pseudo-word sentences) and a resting baseline (consisting of the empty trials and the inter-trial periods). Statistical comparisons were made by calculating linear contrasts between stimulation and baseline separately for each phase of the experiment. The resulting individual contrast images were subjected to a group statistic which tested whether the difference in contrast values (i.e. stimulation minus resting baseline) differed signi®cantly from zero (one-sample t-test). Activation clusters in the Z-map representing the group statistics were considered as signi®cant when they passed a statistical threshold corresponding to P<0.001 uncorrected (i.e. z>3.09) and in addition had a cluster size corresponding to a corrected signi®cance level of P<0.05, as determined using the theory of Gaussian random ®elds.14 15
We ®rst calculated group activation maps contrasting auditory language processing against the resting baseline for the different phases of the experiment (awake state, induction period, maintenance of anaesthesia) as described above. All subjects stopped responding to the task during the induction period of the study which makes the analysis of this block problematic, because it re¯ects the functional activation of two different cognitive states. The exact point
at which the subjects stopped responding to the task varied between individuals (subjects stopped button pressing at between 13 and 18 min after the beginning of the experiment, see section on behavioural data). This point was assumed to re¯ect the inability of the subjects to perform the task produced by deep propofol sedation. Therefore, the induction block was subdivided into two parts according to the state of each subject (part 1: subject response; part 2: no subject response).
In a second step, we de®ned regions of interest (ROIs) that showed signi®cant activation during performance of the language task in the awake state (see Results section). These regions were identi®ed in the temporal and frontal lobe, namely in the primary auditory cortex (Heschl's gyrus) bilaterally, and the planum temporale bilaterally, as they re¯ect the primary analysis of the acoustic input and the analysis of complex sound types.16 17Furthermore, the ROIs
also included the left (Broca's area) and right posterior inferior frontal gyrus (Broca's homologue), and the deep frontal operculum bilaterally. These areas are known to be involved in sentence processing.3 18Based on the results of
the statistical parametric mapping during the awake state, the voxels of greatest activity within the selected regions were identi®ed and trial-averaged haemodynamic responses were calculated for each individual, condition (stimulation vs baseline) and for each experimental phase separately. These time courses representing percent signal change values were averaged across participants and plotted versus time. In addition, the mean value of percent signal change in a time window centred 1 s around the activation peak was determined per subject, condition and experimental phase for each ROI and then subjected of¯ine to a repeated measurements analysis of variance (ANOVA).19
Results
Physiological variables
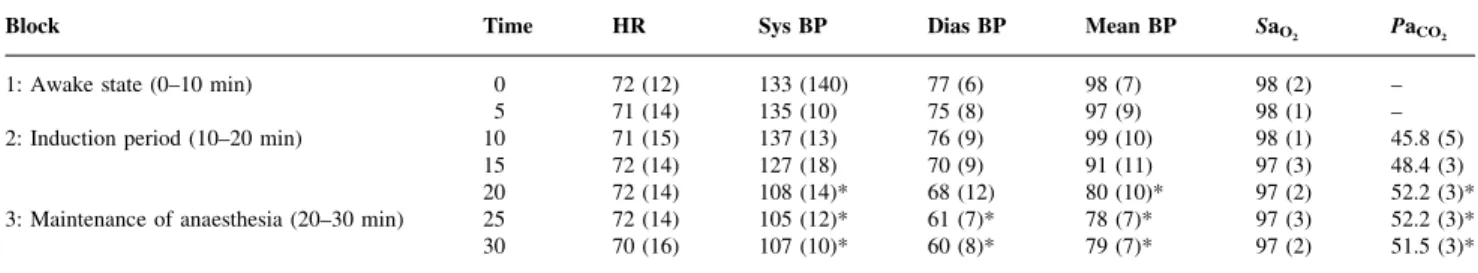
The changes in the physiological variables are shown in Table 1.ANOVAs were conducted to investigate differences
in the PaCO2, systolic blood pressure, diastolic blood
pressure, mean blood pressure, oxygen saturation and propofol plasma concentrations. The group-averaged evalu-ation of the physiological variables shows signi®cant decreases in systolic, diastolic and mean blood pressure at the end of the induction period (20 min) and during the third block of the experiment (maintenance period) caused by the propofol infusion (P<0.05). At the same time, an increase in PaCO2was observed (P<0.05). Other physiological variables
did not change signi®cantly.
Behavioural data and propofol plasma
concentrations
During the awake state (block 1), participants performed the task very accurately. During block 2, subjects stopped
responding to the task 3 to 8 min (mean time 5.1 min (1.7)) after the commencement of the propofol infusion. The average time at which subjects stopped responding to the task corresponded to the ®rst blood sampling time, which was done in order to determine the arterial propofol plasma concentration (see Fig. 1). At this time, the mean propofol plasma concentration was 3.27 (0.8) mg ml±1, the estimated
effect-site concentration was 1.51 mg ml±1. The predicted
arterial plasma concentrations of propofol were quite close to the measured concentrations, suggesting that the chosen model can be applied to estimate the effect-site concentra-tions (see Table 2). The highest propofol plasma concen-tration (4.04 (1.2) mg ml±1) was measured at the end of the
second block (see Table 2). This corresponds to an estimated effect-site concentration of 3.35 mg ml±1.
During the third block of the experiment (maintenance of anaesthesia) the measured propofol concentrations de-creased signi®cantly from 4.04 (1.2) mg ml±1to 1.77 (0.6)
(P<0.05). The estimated effect-site concentration decreased during this period from 3.35 mg ml±1to 2.5 mg ml±1.
As mentioned above, subjects were questioned after the experiment about the general topics covered by the sentences as a means to test whether participants achieved a conscious level of semantic processing of the sentences presented during the third block of the experiment. As expected, none of the subjects noticed a topic change.
Functional magnetic resonance imaging
Awake state
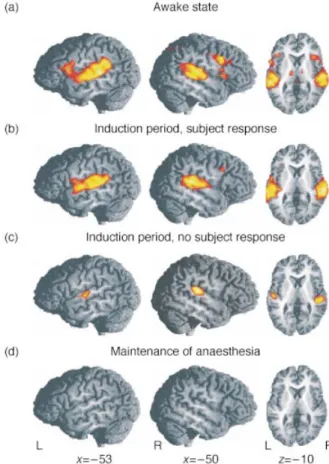
Figure 2A (see also Table 2) shows the activation maps
obtained by contrasting auditory language processing
against the resting baseline during the awake state, irrespective of the condition (as already mentioned, we were not interested in processing differences between both types of speech). Performing the auditory language task induced brain activation in a well-known language net-work.3 18 20In the left hemisphere, a large activation cluster
was observed extending from the superior temporal and supra-temporal areas (including the gyrus of Heschl, BA 41) to the inferior frontal areas such as the ventral premotor cortex (BA 6; BA 44 [Broca's area]; BA 45), and even involving the deep frontal operculum (BA 44). In the right hemisphere, another large area of activity was found which covered the superior and supra-temporal brain regions (BA 41/42/22). In addition, signi®cant activation was also present at the junction of the precentral and inferior frontal sulci of the right hemisphere (BA 6/8). Further task-related activation was found in the posterior cingulate cortex (BA 23) and at the thalamic level.
Induction of anaesthesia
The neural activity during the ®rst part of the induction period (Fig. 2B) resembled relatively closely activity
observed during the awake state (see Table 3). The extensive left and right activation clusters encompassed also the anterior superior temporal areas and inferior frontal structures (BA 41/42/22/6/8). In addition, a small activation cluster was observed in the vicinity of the calcarine sulcus (BA 17).
When comparing within ROI activity between block 1 and the ®rst part of block 2, we found a signi®cant decrease in Broca's area (P=0.02, ANOVA), in the right BA 44 Table 1 Physiological data (mean (SD), n=12). Signi®cant differences from baseline values (P<0.05) are indicated by asterisks. Time in min, HR=heart rate in beats per minute, Sys BP=systolic blood pressure in mm Hg, Dias BP=diastolic blood pressure in mm Hg, Mean BP=mean blood pressure in mm Hg, SaO2=arterial oxygen saturation in percent, PaCO2=arterial carbon dioxide partial pressure in mm Hg
Block Time HR Sys BP Dias BP Mean BP SaO2 PaCO2
1: Awake state (0±10 min) 0 72 (12) 133 (140) 77 (6) 98 (7) 98 (2) ±
5 71 (14) 135 (10) 75 (8) 97 (9) 98 (1) ±
2: Induction period (10±20 min) 10 71 (15) 137 (13) 76 (9) 99 (10) 98 (1) 45.8 (5)
15 72 (14) 127 (18) 70 (9) 91 (11) 97 (3) 48.4 (3)
20 72 (14) 108 (14)* 68 (12) 80 (10)* 97 (2) 52.2 (3)*
3: Maintenance of anaesthesia (20±30 min) 25 72 (14) 105 (12)* 61 (7)* 78 (7)* 97 (3) 52.2 (3)*
30 70 (16) 107 (10)* 60 (8)* 79 (7)* 97 (2) 51.5 (3)*
Table 2 Measured and predicted arterial plasma concentrations of propofol as well as estimated effect-site concentrations of propofol during the experiment (mean 6 standard deviation, n=12). Propofol concentrations were estimated according to a three-compartment pharmacokinetic model (see Methods). Time in min, concentration of propofol in mg ml±1
Block Time Plasma concentration of
propofol (measured) Plasma concentration ofpropofol (predicted) Effect-site concentration ofpropofol (estimated)
2: Induction period (10±20 min) 15 3.37 (0.8) 3.61 1.51
20 4.04 (1.2) 4.85 3.35
3: Maintenance of anaesthesia (20±30 min) 25 2.46 (1.1) 2.28 3.24
(Broca's homologue, P=0.005,ANOVA) and in the left deep
frontal operculum (P=0.04, ANOVA, Fig. 3). In contrast to
the decrease in functional activation in the frontal brain areas, the haemodynamic response in the selected regions of the temporal lobe did not change signi®cantly between block 1 and the ®rst part of block 2 (Fig. 4).
Interestingly, activity in the superior temporal areas was detectable even when participants had stopped producing behavioural responses (i.e. during the second half of block 2, Fig. 2C, 4). In both hemispheres, activation could be
observed in the middle portion of the superior temporal gyrus, i.e. in and around the gyri of Heschl (BA 41/42/22). However, these clusters were much more circumscribed than during conscious task performance (i.e. 75 voxels as compared to 728 voxels in the left hemisphere and 173 versus 595 voxels in the right hemisphere; see Table 3). Similar results were revealed by the ROI analysis. Activation was still present during the second part of block 2 (right primary auditory cortex P=0.008, left primary auditory cortex P=0.02), but was signi®cantly reduced within the auditory cortices when compared to the ®rst part of block 2 (P<0.02). In contrast to the preserved temporal activation, we found no signi®cant activation in the frontal cortex during this phase of the experiment.
Maintenance of anaesthesia
In the third block during which participants were uncon-scious, no activation related to the performance of the cognitive task could be detected. A distinct effect was found within the visual cortex (BA 17). This cluster, however, failed to reach corrected signi®cance (P=0.098, Table 3).
Discussion
During wakefulness the auditory language processing task induced functional brain activation in a widely distributed temporofrontal network in both hemispheres. This brain activation is consistent with previous results from neuro-imaging studies of language.3 18 20With increasing propofol
plasma concentrations, however, activity in these areas was sequentially suppressed: ®rst only frontal areas were affected. Then, after the subjects stopped responding to the task, a remarkable drop in the haemodynamic response occurred in almost all brain areas activated during the awake state. However, immediately after the subjects had stopped responding to the task, functional activation was still detectable within both temporal lobes. This activation disappeared after a further increase in propofol plasma concentration, indicating dose-dependent effects of propo-fol on functional brain activation induced by auditory language processing.
Discussion of the methods
It is important for the interpretation of our results to understand the underlying biophysical mechanisms of BOLD-based fMRI21and the possible confounding factors
secondary to changes in physiological variables caused by propofol. Deoxyhaemoglobin serves as a natural contrast agent during BOLD-based imaging. Due to its paramagnetic properties it distorts the local magnetic ®eld. Any increase in regional cerebral blood ¯ow associated with neuronal activation exceeds the increase in regional oxygen con-sumption. Thus, neuronal activation causes a transient decrease in the regional deoxyhaemoglobin concentration
Fig 2 Functional activation induced by the auditory language processing task (compared to rest) averaged over all 12 subjects (z thresholded at z=3.09 corresponding to P<0.001 mapped onto a reference brain. The local maxima of functional activation are summarized in Table 1). Functional images were acquired from eight axial slices covering perisylvian brain areas associated with auditory and language processing. Sagittal (left hemisphere [L], right hemisphere [R]) and axial view of the z-maps obtained during wakefulness (A), induction of anaesthesia before subjects stopped responding to the task (B), induction of anaesthesia after subjects stopped responding to the task (C) and maintenance of anaesthesia (D). (A) Activated areas include temporal (BA 41/42/22) and frontal regions (BA 6/8/44/45) along the perisylvian sulcus (see Tables 3 and 4). (B) The observed temporal activation is nearly identical to the
awake state. In contrast, the frontal activation is reduced. (C) Functional
activation obtained during the second block of the experiment (induction period) after subjects stopped responding to the task. Functional activation was markedly decreased, but still preserved bilaterally in the gyrus temporalis superior (BA 41/42/22) immediately after subjects stopped responding to the task. (D) No task-related activation was
and produces a higher MR signal intensity in areas around activated neurons.4Therefore, the measurable BOLD signal
change depends on two different factors. First, the change in neuronal activation induced by the stimulus, and second, the
coupling between oxidative metabolism and cerebral haemodynamics. Imaging studies investigating evoked cortical responses in animals suggest that a weaker ¯ow-metabolism coupling attributable to anaesthesia decreases
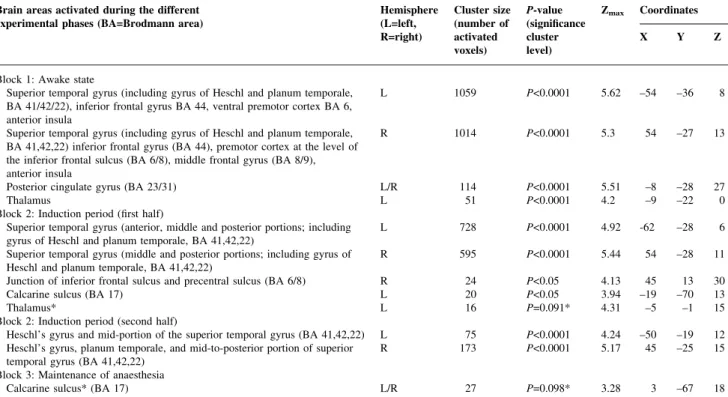
Table 3 Brain activation elicited during the performance of the language task (as compared to the resting baseline). Note: cluster size indicates the number of activated voxels (3 3 3 3 3 mm); P-value re¯ects the signi®cance of the cluster size corrected for multiple comparisons;14z-value re¯ects the local maxima
of the activated clusters (a z-value of 3.09 corresponds to a P-value <0.001), coordinates follow the stereotactic atlas of Talairach and Tournoux.13Brain
regions marked by an asterisk just failed to reach signi®cance corrected for multiple comparisons at the cluster level (P<0.1). They are nevertheless reported for descriptive purposes
Brain areas activated during the different
experimental phases (BA=Brodmann area) Hemisphere(L=left, Cluster size(number of P-value(signi®cance Zmax Coordinates R=right) activated
voxels) clusterlevel) X Y Z
Block 1: Awake state
Superior temporal gyrus (including gyrus of Heschl and planum temporale, BA 41/42/22), inferior frontal gyrus BA 44, ventral premotor cortex BA 6, anterior insula
L 1059 P<0.0001 5.62 ±54 ±36 8
Superior temporal gyrus (including gyrus of Heschl and planum temporale, BA 41,42,22) inferior frontal gyrus (BA 44), premotor cortex at the level of the inferior frontal sulcus (BA 6/8), middle frontal gyrus (BA 8/9), anterior insula
R 1014 P<0.0001 5.3 54 ±27 13
Posterior cingulate gyrus (BA 23/31) L/R 114 P<0.0001 5.51 ±8 ±28 27
Thalamus L 51 P<0.0001 4.2 ±9 ±22 0
Block 2: Induction period (®rst half)
Superior temporal gyrus (anterior, middle and posterior portions; including
gyrus of Heschl and planum temporale, BA 41,42,22) L 728 P<0.0001 4.92 -62 ±28 6
Superior temporal gyrus (middle and posterior portions; including gyrus of
Heschl and planum temporale, BA 41,42,22) R 595 P<0.0001 5.44 54 ±28 11
Junction of inferior frontal sulcus and precentral sulcus (BA 6/8) R 24 P<0.05 4.13 45 13 30
Calcarine sulcus (BA 17) L 20 P<0.05 3.94 ±19 ±70 13
Thalamus* L 16 P=0.091* 4.31 ±5 ±1 15
Block 2: Induction period (second half)
Heschl's gyrus and mid-portion of the superior temporal gyrus (BA 41,42,22) L 75 P<0.0001 4.24 ±50 ±19 12 Heschl's gyrus, planum temporale, and mid-to-posterior portion of superior
temporal gyrus (BA 41,42,22) R 173 P<0.0001 5.17 45 ±25 15
Block 3: Maintenance of anaesthesia
Calcarine sulcus* (BA 17) L/R 27 P=0.098* 3.28 3 ±67 18
Fig 3 Mean percentage BOLD signal change induced by auditory language processing in selected regions of interest in the frontal lobe obtained during the four experimental phases. Error bars represent the standard error of the mean. TheANOVAshowed signi®cant decreases in the BOLD signal
in the posterior inferior frontal gyrus bilaterally (Broca's area and Broca's homologue) as well as in the left deep frontal operculum (DFO) from block 1 to the ®rst part of block 2. An additional BOLD signal decrease was found from the ®rst part to the second part of block 2 in Broca's area and in the left as well as right deep frontal operculum. (BA=Brodmann area, *P<0.05, **P<0.01.)
the functional signal depending on changes in the cerebral microcirculation.22 Therefore, decreases in functional
acti-vation during anaesthesia could re¯ect either a decreased neuronal activity or an impaired ¯ow-metabolism coupling or both. Flow-metabolism coupling is retained during propofol anaesthesia,23 suggesting that the measured
changes in BOLD contrast indeed re¯ect changes in neuronal activity, rather than alterations in the coupling between cerebral haemodynamics and oxidative metabol-ism.
Furthermore, changes in baseline cerebral blood ¯ow caused by the moderate increase in PaCO2 (see Table 1)
during propofol anaesthesia or by propofol itself may have in¯uenced our results, because the basal level of cerebral blood ¯ow affects the BOLD response to neural stimula-tion.24 An increase in baseline cerebral blood ¯ow was
reported to cause a decrease of the BOLD response, whereas the opposite effect was observed during a decreased baseline cerebral blood ¯ow during hypocapnia.
Therefore, the increase in global cerebral blood ¯ow caused by the PaCO2increase during propofol anaesthesia may have
caused an underestimation of the task-induced brain acti-vation during anaesthesia. On the other hand, propofol causes a decrease in cerebral blood ¯ow. This suggests that there were compensatory effects of propofol anaesthesia and the concomitant PaCO2 increases on baseline cerebral
blood ¯ow during our experiment. This idea is supported by a recently published positron emission tomography study, which reported antagonistic effects of propofol and increas-ing PaCO2on global cerebral blood ¯ow.
25In this study, the
antagonistic effect of both variables (note that the increases in propofol plasma concentration and PaCO2in the study by
Fiset and colleagues25 were very similar to our study)
resulted in similar cerebral blood ¯ow values during anaesthesia and wakefulness.
Providing anaesthesia in a high-®eld MR-research envir-onment involves some limitations to data acquisition and monitoring. For experiments such as ours, it would be highly desirable to use computer-controlled infusion sys-tems as well as simultaneous neuromonitoring (e.g. EEG) in order to achieve stable anaesthetic conditions. Such systems are currently not adapted for use in an MR environment. Another complicating factor is that the anaesthetist cannot see the subject during the experimental procedure.
To summarize the methodological discussion: (i) fMRI experiments during anaesthesia have some limitations due to the strong electromagnetic ®eld in the environment of the scanner. (ii) We cannot exclude an in¯uence of global cerebral blood ¯ow changes caused by anaesthesia on our results. However, we assume an only marginal impact of baseline cerebral blood ¯ow changes. In addition, haemo-dynamic changes caused by PaCO2changes would be global
in nature and could not explain the differences in the behaviour of the investigated regions (see Figs 3, 4). Thus,
Fig 4 Mean percentage BOLD signal change induced by auditory language processing in selected regions of interest in the temporal lobe obtained during the four experimental phases. Error bars represent the standard error of means. TheANOVAshowed signi®cant BOLD signal decreases in the
primary auditory cortex (PAC) bilaterally as well as in the planum temporale (PT) bilaterally after subjects stopped responding to the task. (*P<0.05, **P<0.01.)
Table 4 Talairach coordinates for the region of interest (ROI) analysis (see Figs 3 and 4). The ROIs represent the local activation maxima within the frontal and temporal activation clusters described in Table 3
Brain areas activated during the different
experimental phases (BA=Brodmann area) Coordinates
X Y Z
Gyrus of Heschl, left ±47 ±28 9
Gyrus of Heschl, left 54 ±25 15
Planum temporale, left ±56 ±40 24
Planum temporale, right 49 ±34 17
Inferior frontal gyrus (BA 44, Broca's area), left ±53 15 15 Inferior frontal gyrus (BA 44), right 51 20 6
Deep frontal operculum, left ±41 25 6
we conclude that these potential methodological concerns should have only marginally in¯uenced our results.
Discussion of the results
The preserved haemodynamic response during the second part of the induction period is one of the most striking ®ndings of our study, suggesting ongoing auditory infor-mation processing in the temporal lobe immediately after the subjects had stopped responding to the task. This phenomenon was present only for a brief period of time. Therefore, it is possible that the observed temporal activation disappears at a constant effect-site concentration of propofol over a period of time. Alternatively, the residual auditory processing in the temporal lobe could be inter-preted as a stationary phenomenon observable at a certain brain concentration of propofol.
The regions mainly involved in auditory processing during the second part of the induction period are Heschl's gyri bilaterally and its adjacent regions, as well as the right planum temporale. These regions are involved in the primary analysis of the acoustic input, mainly in the discrimination, identi®cation, conceptualization and the auditory memory of sound.15 17 In particular, the right
temporal lobe appears to be involved in information processing at this depth of anaesthesia. Recently, several proposals have been formulated to explain the ®ndings regarding the right hemispheric specialization in different aspects of language processing.17 In contrast to the
preserved temporal activation during the second part of the induction period, frontal regions showed no functional response to the presented sentences after subjects stopped responding to the task. With respect to the role of the frontal lobe in auditory language processing3our ®ndings indicate
that, at this anaesthetic depth, basic auditory sound identi-®cation processes were preserved, whereas higher cognitive functions of auditory sentence processing were lost, which probably caused the missing behavioural response to the task.
The point at which subjects stopped responding to the task could either indicate deep sedation associated with amnesia or loss of consciousness induced by propofol. During clinical anaesthesia loss of consciousness is usually con®rmed by loss of the appropriate response to speci®c spoken commands from the anaesthetist. This technique could not be applied in our study due to limited access to the subjects during scanning. Thus, we had to rely on weaker methods to con®rm the behavioural state, such as the appropriate response to the auditory discrimination task and the estimated effect-site concentration of propofol. The estimated effect-site concentration of propofol at the time at which subjects stopped responding was around 1.5 mg ml±1
(see Table 2). This concentration is usually associated with deep sedation. Therefore it is reasonable to assume that subjects were deeply sedated but still with the potential to be aroused by forceful verbal commands at this time. This
could explain the residual temporal activation (see Fig. 2C)
after subjects stopped responding to the task. The further increase in the effect-site concentration of propofol from 1.51 mg ml±1to 3.35 mg ml±1(see Table 2) during the second
half of block 2 and the fact that all subjects were unconscious as they were removed from the scanner suggests that subjects lost consciousness during block 2 after they stopped responding to the task.
In this context it is also interesting to compare our results with the ®ndings of studies using recordings of auditory evoked potentials (AEPs): The frontal cortex is a major contributor to long latency AEPs. These late AEPs disap-pear in the presence of low propofol concentrations.26
Although localization of the midlatency AEP (10±80 ms) sources is very dif®cult, they are generally assumed to be evoked in, and in the close vicinity of, the primary auditory cortex.27Midlatency AEPs are preserved at low
concentra-tions of propofol, and progressively attenuated by increas-ing concentrations until they disappear.28 We found a
signi®cant alteration of the event-related fMRI response to propofol merely within the frontal cortex before subjects stopped responding to the task (i.e. at low plasma propofol concentrations). After subjects stopped responding to the task, the haemodynamic response in the gyrus temporalis superior was still preserved (i.e. at intermediate propofol plasma concentrations, see Figure 1 block 2 after loss of consciousness). Only the highest measured plasma propofol concentration at the end of the induction period caused a complete suppression of the haemodynamic response, indicating that at a concentration of 4.04 mg ml±1 (i.e. at
an estimated effect site concentration of 3.35 mg ml±1)
adequate anaesthesia was established.
Our results indicate that propofol exhibits stronger effects on cognitive processes that involve frontal cortices com-pared to processes merely involving auditory areas in the temporal lobe. Alternatively, a higher sensitivity of the frontal vascular system to propofol could result in similar ®ndings. Both ideas are supported by a recently published positron emission tomography study2 which demonstrates
that propofol preferentially decreases cerebral blood ¯ow in the frontal cortex. This decrease could cause regional speci®c alterations in baseline cerebral blood ¯ow in the frontal lobe as well as cause speci®c effects on processes mediated by the frontal lobe, or both. Further investigations with simultaneous cerebral blood ¯ow measurements are necessary to make these suggestions more speci®c.29
In addition to the basic aspects discussed above, the present study also has some clinical implications. The use of fMRI has been suggested for investigations of hearing disorders involving auditory cortices in children.30Children
and uncooperative adult patients are often anaesthetized using propofol during the scanning procedure. Our results clearly demonstrate that propofol doses causing unrespon-siveness are associated with a markedly suppressed fMRI response.
Conclusions
The present study demonstrates a gradual breakdown of the investigated language processing network during the slow transition from wakefulness to propofol-induced uncon-sciousness. Language processing in primary auditory areas in the temporal lobe appears to be more resistant to propofol anaesthesia compared to processing stages in frontal areas that support more high-level cognitive processes. This is indicated by a preserved task-related brain activation of the auditory cortices after subjects stopped responding to the task.
Acknowledgements
The authors thank the subjects who participated in the study. This study was supported by the project FR 517/3 by the Deutsche Forschungsgemeinschaft (German Research Foundation, DFG) as well as by the Human Frontier Science Program (HFSP) awarded to Kai Alter.
References
1 Heinke W, Schwarzbauer C. In vivo imaging of anaesthetic action in humans: approaches with positron emission tomography (PET) and functional magnetic resonance imaging (fMRI). Br J Anaesth 2002; 89: 112±22
2 Veselis RA, Reinsel RA, Feshchenko VA, Dnistrian AM. A neuroanatomical construct for the amnesic effect of propofol. Anesthesiology 2002; 97: 329±37
3 Friederici AD. Towards a neural basis of auditory sentence processing. Trends Cogn Sci 2002; 6: 78±84
4 Bandettini PA, Wong EC. Magnetic resonance imaging of human brain function. Principles, practicalities, and possibilities. Neurosurg Clin N Am 1997; 8: 345±71
5 Shaywitz BA, Shaywitz SE, Pugh KR, et al. Sex differences in the functional organization of the brain for language. Nature 1995; 373: 607±9
6 Old®eld RC. The assessment and analysis of handedness: the Edinburgh inventory. Neuropsychologia 1971; 9: 97±113 7 Billard V, Gambus PL, Chamoun N, Stanski DR, Shafer SL. A
comparison of spectral edge, delta power, and bispectral index as EEG measures of alfentanil, propofol, and midazolam drug effect. Clin Pharmacol Ther 1997; 61: 45±58
8 Burock MA, Buckner RL, Woldroff MG, Rosen BR, Dale AM. Randomized event-related experimental designs allow for extremely rapid presentation rates using functional MRI. Neuroreport 1998; 9: 3735±9
9 Schmitt F, Stehling MK, Turner R. Echo-planar imaging: theory, technique and application. Berlin: Springer, 1998
10 Norris DG. Reduced power multislice MDEFT imaging. J Magn Reson Imaging 2000; 11: 445±51
11 Lee JH, Garwood M, Menon R, et al. High contrast and fast three-dimensional magnetic resonance imaging at high ®elds. Magn Reson Med 1995; 34: 308±12
12 Lohmann G, MuÈller K, Bosch V, et al. LipsiaÐA new software system for the evaluation of functional magnetic resonance images of the human brain. Comput Med Imaging Graph 2001; 25: 449±57
13 Talairach P, Tournoux J. A Stereotactic Coplanar Atlas of the Human Brain. Stuttgart: Thieme, 1998
14 Worsley K, Friston K. Analysis of fMRI time-series revisited-again. Neuroimage 1995; 2: 341±52
15 Kiebel SJ, Goebel R Friston KJ. Anatomical informed basis functions. Neuroimage 2000; 11: 656±67
16 Grif®ths TD, Warren JD. The planum temporale as a computational hub. Trends Neurosci 2002; 25: 348±53
17 Hickok G, Poeppel D. Towards a functional neuroanatomy of speech perception. Trends Cogn Sci 2000; 4: 131±8
18 Meyer M, Alter K, Friederici AD, Lohmann G, von Cramon DY. FMRI reveals brain regions mediating slow prosodic modulations in spoken sentences. Hum Brain Mapp 2002; 17: 73±88 19 Bosch V. Statistical analysis of multi-subject fMRI data:
assessment of focal activations. J Magn Reson Imaging 2000; 11: 61±4
20 Friederici AD, Meyer M, von Cramon DY. Auditory language comprehension: an event-related fMRI study on the processing of syntactic and lexical information. Brain Lang 2000; 75: 289±300 21 Attwell D, Iadecola C. The neural basis of functional brain
imaging signals. Trends Neurosci 2002; 25: 621±5
22 Shtoyerman E, Arieli A, Slovin H, Vanzetta I, Grinvald A. Long-term optical imaging and spectroscopy reveal mechanisms underlying the intrinsic signal and stability of cortical maps in V1 of behaving monkeys. J Neusci 2000; 20: 8111±21
23 Enlund M, Andersson J, Hartvig P, Valtysson J, Wiklund L. Cerebral normoxia in the rhesus monkey during iso¯urane- or propofol induced hypotension and hypocapnia, despite disparate blood-¯ow patterns. Acta Anaesthesiol Scand 1997; 41: 1002±10 24 Cohen ER, Ugurbil K, Kim SG. Effect of basal conditions on the magnitude and dynamics of the blood oxygenation level-dependent fMRI response. J Cereb Blood Flow 2002; 22: 1042±53 25 Fiset P, Paus T, Daloze T, et al. Brain mechanism of propofol-induced loss of consciousness in humans. J Neurosci 1999; 19, 5506±13
26 Simpson TP, Manara AR, Kane NM, Barton RL, Rowlands CA, Butler SR. Effect of propofol anaesthesia on the event-related potential mismatch negativity and the auditory-evoked potential N1. Br J Anaesth 2002; 89: 382±8
27 Pockett S. Anesthesia and the electrophysiology of auditory consciousness. Conscious Cogn 1999; 8: 45±61
28 Tooley MA, Greenslade GL, Prys-Roberts C. Concentration-related effects of propofol on the auditory evoked response. Br J Anaesth 1996; 77: 720±6
29 Schwarzbauer C. Simultaneous detection of changes in perfusion and BOLD contrast. NMR Biomed 2000; 13: 37±42
30 Thai-Van H, Fraysse B, Berry I, et al. Functional magnetic resonance imaging may avoid misdiagnosis of cochleovestibular nerve aplasia in congenital deafness. Am J Otol 2000; 21: 663±70