David Aldaba, Martin Glaus, Olivier Leupin, Luc Van Loon, Miquel Vidal, and Anna Rigol*
Suitability of various materials for porous filters
in diffusion experiments
Abstract: The suitability of different porous materials
(stainless steel, VYCOR® glass,Al2O3and PEEK) for use as confining filters in diffusion experiments was evalu-ated by measuring the effective diffusion coefficients (𝐷e) of neutral (HTO) and ionic solutes (Na+,Cs+,Sr2+,Cl−, SeO42−) in the materials in through-diffusion experiments. For stainless steel filters, the𝐷e values of the target
so-lutes correlated satisfactorily with their bulk diffusion co-efficient in water (𝐷w); thus, the diffusion process in the
stainless steel filters was primarily controlled by the dif-fusivity of the solvated ions. For the remaining materi-als, the𝐷e and𝐷w values were also correlated for the target solutes, and the geometric factors were in the se-quence: VYCOR® glass< Al2O3 <PEEK. Stainless steel and VYCOR® glass were the most appropriate materials because of their high𝐷evalues, but a specific interaction
of caesium with VYCOR®glass was hypothesised because the𝐷evalues obtained for this solute were slightly higher
than expected.
Keywords: Effective diffusion coefficient, porous filter,
Archie’s relationship, geometric factor.
||
*Corresponding Author: Anna Rigol, Departament de Química
Analítica, Universitat de Barcelona, 08028-Barcelona, Spain, e-mail: [email protected]
David Aldaba, Miquel Vidal: Departament de Química Analítica,
Universitat de Barcelona, 08028-Barcelona, Spain
Martin Glaus, Luc Van Loon: Laboratory for Waste Management,
Paul Scherrer Institut, 5232 Villigen PSI, Switzerland
Olivier Leupin: Nagra, 5430 Wettingen, Switzerland
1 Introduction
Based on international consensus [1] for the disposal of high-level radioactive waste (HLW) and spent fuel (SF), geological repositories have been promoted as the safest option to isolate the waste from the biosphere. In most versions of these repositories, the isolation of waste from the biosphere relies on passive multi-barrier systems. The space around the emplaced canisters is usually
back-filled with swelling clay to reduce the hydraulic conduc-tivity in the near field to values similar to those mea-sured in the host rock [2, 3] and to ensure diffusion-controlled transport of radionuclides when the canisters are breached [4]. Thus, the development and application of laboratory methodologies for the characterisation of the diffusion of the radionuclides present in spent nuclear fuel and high-level waste in the compacted materials used in engineered barriers has become an important issue for long-term safety considerations.
The diffusive transport of radionuclides through a porous medium is quantified by the effective diffusion coefficient (𝐷e), which includes the effect of the
geomet-ric properties of the pores of the material on the diffusion of the target solutes. Therefore,𝐷edepends, among other
terms, on the porosity accessible for diffusion, the pore di-ameter and the connectivity of the porous network [5]. In this sense, the diffusion of various radionuclides through compacted swelling clays and argillaceous rocks has been extensively evaluated in laboratory tests by obtaining the
𝐷e, primarily by through-diffusion experiments. The
lit-erature on through-diffusion experiments is vast but im-portant references are: Molera and Eriksen [6], in which the diffusion of22Na+,85Sr2+,134Cs+ and57Co2+in com-pacted bentonite was studied as a function of different compaction densities; Van Loon et al. [7], who applied through-diffusion and the complementary out-diffusion method to study the diffusion of HTO,36Cl− and125I− in Opalinus Clay under different confining pressures; and Glaus et al. [8], who investigated the diffusion of HTO,
22Na+ and36Cl− in compacted kaolinite, illite and
mont-morillonite as a function of the concentration of back-ground electrolyte in the solution in contact with the clay sample.
The through-diffusion method usually requires a sandwiched filter-clay-filter experimental setup. The filters allow the tracer solution to enter and leave the clay samples [9] and maintain sample integrity. Moreover, in experiments with swelling clays (mainly compacted bentonites), stainless steel filters are often preferred because they can resist the high swelling pressures [6,9]. The effect of the filters on the diffusion process is usually neglected; the prevailing argument for this neglect is that
the solute diffusivity is much higher in filters than in clays. However, only a few studies have systematically evaluated radionuclide diffusion in stainless steel porous filters as a preliminary step [6, 9]. Thus, Molera and Eriksen [6] measured the diffusivities of solutes through stainless steel porous filters, and included these diffusivities in a model for solute diffusion in compacted bentonite. Glaus et al. [9] measured the 𝐷e values of various solutes in
stainless steel porous filter discs before and after the use of these discs in diffusion experiments with clay minerals, and they concluded that used filters might impede solute diffusion because of the clogging of filter pores by clay. However, other factors, such as pore geometry or possible solute-filter interactions in unused filters, might also affect the𝐷evalues obtained in through-diffusion experiments
and have not yet been evaluated. This evaluation could be performed by examining the diffusivities of a series of uncharged, positively and negatively charged solutes in a set of presumably inert porous media; this approach has not yet been fully and systematically tested in the literature.
Thus, in this work, the effect of the pore geometry (porosity, pore diameter and connectivity) on the quan-tification of𝐷e by through diffusion [9], as well as the
potential existence of solute-filter interactions, was eval-uated in various materials for a series of solutes (HTO,
Na+,Cs+,Sr2+,Cl−,SeO2−4 ), either radionuclides or, for safety, stable elements representative of relevant radionu-clides. Archie’s relationship [10] was assessed for stain-less steel porous filters with different pore diameters and porosities. In addition, the applicability of other materi-als (VYCOR®glass,Al2O3 and PEEK) for use as filters in through-diffusion experiments was also evaluated based on the relationship between the𝐷evalues obtained for the
target solutes in these materials and the corresponding dif-fusion coefficients of the solutes in free water (𝐷w).
2 Experimental
2.1 Materials and reagents
The stainless steel filters used in this study were pur-chased from MOTT industrial division (Code 316L, Farm-ington, Connecticut, USA). The pore diameters of the fil-ters were 10, 5, 2, 1 and0.5 𝜇m. The diameter of the discs was25.4 mm, and the thickness was1.5 mm. VYCOR® glass filter discs, composed of 96% SiO2, 3% B2O3 and
0.4%Na2O, were provided by Corning Incorporated (New York, USA). Typical pore sizes are of the order of4 nm. Fil-ters made from porousAl2O3 were provided by Metoxit
(Thayingen, Switzerland). Only the particle size for the sin-tering process is known for this material (order of5 𝜇m); typical pore sizes are thus in the low𝜇mrange. The PEEK (Polyether ether ketone) filters were provided by Poro-gen (Woburn, MA, USA). The diameter of the disks was
25.6 mmin all cases and typical pore sizes for this mate-rial are in the1 𝜇mrange. The thickness of the filter discs ranged from 1.00 to1.03 mmfor VYCOR®glass, from 1.50 to1.53 mmforAl2O3, and from 1.65 to1.68 mmfor PEEK. The porosities (𝜀) of all the filters tested were calcu-lated from the weights of the dry and water-saturated fil-ters.
P.A. grade CsCl, SrCl2and KCl were purchased from Fluka (Buchs, Switzerland). Radioisotopically pure solu-tions of HTO,22Na+,36Cl−,134Cs+ and75SeO32−were ob-tained from Isotope Products Europe (Blaseg, Germany). Selenite was oxidised to selenate with NaClO based on similar procedures described in Glauset al. [11] for the oxi-dation of iodide to iodate. The subsequent isolation of the reaction product by semi-preparative high-performance anion chromatography was performed with an IonPac AS18 column (Dionex, Switzerland).
2.2 Through-diffusion experiments
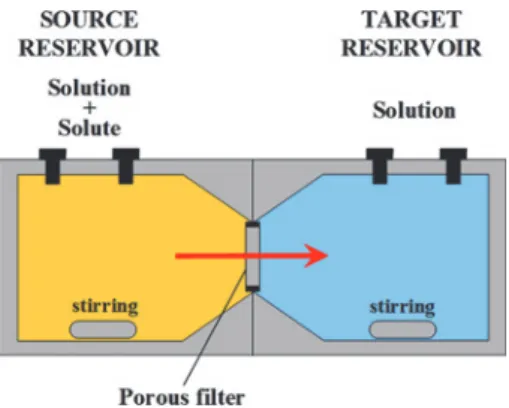
For the through-diffusion experiments, the manufactured acrylic diffusion cells developed in a previous work [9] were used. Figure1shows a schematic of this experimen-tal setup, which is composed of two solution reservoirs of125 mLseparated by the filter. Advective solute trans-port was prevented by the use of FKM fluoroelastomer flat seals (Angst+Pfister, Switzerland) that encased the filters. Once assembled, the cells were filled with approximately
115 mLof electrolyte solution (NaClO4 0.1 mol L−1) and subjected to vacuum in a desiccator for approximately
15 minto evacuate any air trapped in the pore space of the filters. Then, the cells were allowed to stand for24 h
to ensure that the level of the solution was identical in both reservoirs. The solutions were stirred magnetically to maintain homogeneity. No special precaution was taken to fix the pH in the solutions. It can be assumed that pH was largely controlled by uptake of CO2.
At the beginning of the experiments,500 𝜇Lof a solu-tion containing the target solute was added to one of the reservoirs (the source reservoir), and a similar amount of solution without the solute was simultaneously added to the other reservoir (the target reservoir). The initial con-centration of solute added to the source reservoir was de-termined to facilitate quantification of the solute. This ini-tial concentration was 1 MBq L−1 for the radionuclides
Fig. 1: Experimental setup for the through-diffusion method.
and3 mmol L−1for the stable elements. Once the diffusion process had started,250 𝜇Laliquots were simultaneously removed from both reservoirs, and special care was used to avoid fluxes between the reservoirs that could lead to advective transport of the target solute. Aliquots were re-moved every1.5 hfor approximately7 h, and afterwards, additional aliquots were removed during the diffusion ex-periments, which lasted up to10 d.
Through-diffusion experiments with stainless steel fil-ters were performed, on one hand, with a mixture of HTO and22Na+ and, on the other hand, with a mixture of stable Cl−, Cs+ and Sr2+, as analogues of radionu-clides. For the evaluation of the remaining materials, three through-diffusion experiments were performed in parallel with a mixture of HTO and36Cl−, with134Cs+ and with
75SeO 42−.
2.3 Measurement of solute concentrations
2.3.1 Experiments with stainless steel filters
The concentrations of HTO and22Na+ present in the sam-pled aliquots were simultaneously determined by liquid scintillation with a Tri-carb 2250 CA counter (Canberra-Packard). The 250 𝜇L sample aliquots were mixed with
10 mLof deionized water and10 mLof scintillation cock-tail (Ultima Gold XR, Canberra-Packard) for the measure-ments. 𝛽-𝛽discrimination was used in two energy win-dows:0–9 keVfor HTO and 9–160 keV for 22Na+. The lower energy window covered scintillation signals caused by the two radionuclides, while the upper window was specific for22Na+. The activity of22Na+ was thus deter-mined unequivocally from the upper window, and this in-formation was subsequently used for determining the ac-tivity of HTO.
The concentrations of stableCs+ andSr2+were mea-sured by high-performance cation exchange chromatogra-phy (HPCEC) by a Dionex DX-600 system (Dionex, Switzer-land) consisting of a metal-free GP50-2 quaternary gra-dient pump, a CD25A conductivity detector and an AS50 autosampler, equipped with a 9750 motor-driven Rheo-dyne injection valve and a 50 𝜇l PEEK injection loop. The separation column was a 4 mm × 250 mm IonPac CS12A used in combination with a4 mm × 50 mm Ion-Pac CG12A guard column (Dionex, Switzerland). The elu-ent was18 mmol L−1methanesulphonic acid at a flow rate of 1 mL min−1. For stable Cl−, a 4 mm × 250 mm Ion-Pac AS16 separation column and a4 mm × 50 mm Ion-Pac AG16 guard column (Dionex, Switzerland) were used for the separation. The eluent was0.02 mol L−1NaOH at a flow rate of1 mL min−1. Conductivity after electrochem-ical eluent suppression (autosuppression mode) was ap-plied in both cases for analyte detection.
2.3.2 Experiments with VYCOR®glass, Al2O3and PEEK filters
The concentration activities of HTO and 36Cl− present in the aliquots sampled were determined simultaneously by liquid scintillation with a Tri-carb 2250 CA counter (Canberra-Packard). The 250 𝜇L sample aliquots were mixed with10 mLof deionized water and10 mLof scin-tillation cocktail (Ultima Gold XR, Canberra-Packard) for the measurements.𝛽-𝛽discrimination was used in two en-ergy windows of 0 to9 keVfor HTO and 9 to710 keVfor
36Cl−. The lower energy window covered scintillation
sig-nals caused by the two radionuclides, while the upper win-dow was specific for36Cl−. The activity of36Cl−was thus determined unequivocally from the upper window, and this information was subsequently used for determining the activity of HTO. The concentration activities of134Cs+
and75SeO42−were determined with a𝛾-counter
(Minaxi-𝛾, Autogamma 5000 series, Canberra-Packard) in spectral windows of615–675 keV, and76–136 keV, respectively.
2.4 Determination of the
D
evalues
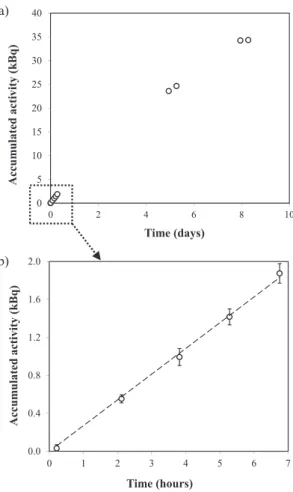
The breakthrough curve for the solute was obtained by plotting the accumulated activity (in kBq, for radionu-clides) or the accumulated mass (in mol, for stable ele-ments) in the target reservoir as a function of time (s). Al-though the concentration changes are not linear with time because of variable boundary conditions in the source reservoir, the initial phase of the process (1–8 h) can be
treated as being pseudo-linear because the concentration in the source reservoir did not change significantly dur-ing this time span. Subsequently, the curve evolved non-linearly until the concentration of the solute was equal in both reservoirs. For example, Figure2a shows the break-through curve of HTO for the experiments with VYCOR® glass filter, and Figure2b shows the linear fit of the pseudo-linear phase.
The𝐷evalue for a given experiment was calculated by
applying the following equation [9]:
𝐷e=
𝑎 𝐿e
𝑆 𝐶0 (1)
where 𝑎 (kBq s−1 or mol s−1) is the slope of the break-through curve obtained from a linear regression of the pseudo-linear phase,𝐿e(m) and𝑆(m2) are, respectively,
the thickness and the cross-sectional area of the filter disc, and𝐶0is the initial concentration (kBq m−3or mol m−3) in the source reservoir.
No anomalies were detected in the diffusion experi-ments because the initial concentration of each given
so-a) b) 0 5 10 15 20 25 30 35 40 0 2 4 6 8 10 Accum u lated activity (k Bq) Time (days) 0.0 0.4 0.8 1.2 1.6 2.0 0 1 2 3 4 5 6 7 Accum u lated activity (k Bq) Time (hours)
Fig. 2: (a) Breakthrough curve for HTO and (b) pseudo-linear phase
of the breakthrough curve in the target reservoir for the experiments with the VYCOR®glass filter.
lute matched well (±5%) the sum of the final concentra-tions of the solute in the source and target reservoirs at the end of the experiment.
The global errors in the𝐷evalues were calculated by
propagation of the errors associated with the parameters involved in Eq. (1). The errors were lower than10%in all cases, and the main source of error originated from the cal-culation of the slope.
3 Results and discussion
3.1 Effective diffusion coefficients for the
stainless steel porous filters
Table1summarises the effective diffusion coefficients of the target solutes for each pore diameter and porosity tested for the stainless steel porous filters.
For a given pore diameter and porosity, the results followed the sequence𝐷e(HTO)> 𝐷e(Cs+)∼ 𝐷e(Cl−)>
𝐷e(Na+)> 𝐷e(Sr2+); this sequence matches the sequence
of the bulk diffusion coefficients in water (𝐷w) reported in
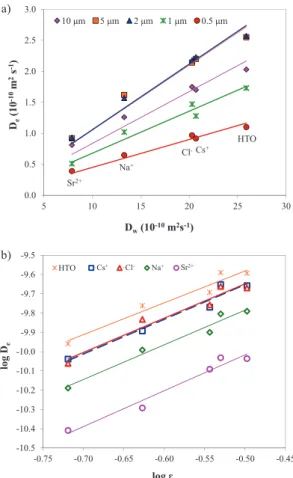
the literature [12–14]. As shown in Figure3a, the𝐷e
val-ues obtained for all the examined solutes showed a satis-factory linear correlation (0.92 < 𝑅2 < 0.98) with the re-spective𝐷wvalues. The linear relation between𝐷wand
𝐷evalues was evaluated through the well-established for-malism for the diffusion of a solute in a saturated porous system [15]:
𝐷e =
𝜀
𝐺𝐷w (2)
where 𝐺is the overall geometric factor, which accounts for the geometric properties of the pore network, such as the constrictivity and tortuosity.𝐺values were calculated
Table 1: Pore diameter, porosity (𝜀), 𝐷evalues and geometric factor
(G) obtained by through-diffusion experiments with stainless steel porous filters. Pore dia- 𝜀a 𝐷e(10−10m2s−1)b G meter (𝜇m) HTO Cs+ Cl− Na+ Sr2+ 10 0.286 (0.016) 2.0 1.7 1.8 1.3 0.81 3.4 5 0.318 (0.002) 2.6 2.2 2.1 1.6 0.92 3.0 2 0.295 (0.001) 2.6 2.2 2.2 1.6 0.93 2.8 1 0.235 (0.001) 1.7 1.3 1.5 1.0 0.51 3.5 0.5 0.190 (0.001) 1.1 0.92 0.97 0.65 0.39 4.2
aMean (standard deviation) given for measurements on 10 different
filters from the same production lot.
bThe error associated with the𝐷
evalues was less than10% in all
0.0 0.5 1.0 1.5 2.0 2.5 3.0 5 10 15 20 25 30 De (1 0 -1 0m 2s -1) Dw(10-10m2s-1) 10 μm 5 μm 2 μm 1 μm 0.5 μm a) Sr2+ Na+ Cs+ Cl -HTO -10.5 -10.4 -10.3 -10.2 -10.1 -10.0 -9.9 -9.8 -9.7 -9.6 -9.5 -0.75 -0.70 -0.65 -0.60 -0.55 -0.50 -0.45 log D e log ɛ HTO Cs Cl Na Sr b) Cs+ Cl- Na+ Sr2+
Fig. 3: Archie’s correlations in the stainless steel porous filters: (a)
𝐷eas a function of𝐷wand (b)log 𝐷eas a function oflog 𝜀. The symbols correspond to the experimental data, and the lines correspond to the fits.
from the slope of the correlation of𝐷e vs. 𝐷w and the
respective porosity (Table1). Higher values of 𝐺, in this study, imply a poorer interconnection of the pores. The re-sults obtained indicated that the effect of the pore network is the same for all the solutes investigated and that the ob-served sequence of𝐷e values must be explained by the intrinsic properties of their diffusion in bulk water. This sequence can be explained well by the Stokes–Einstein equation:
𝐷w= 𝑘𝐵𝑇
6 𝜋 𝜂 𝑟 (3)
where𝑘Bis Boltzmann’s constant,𝑇is the temperature,
𝜂is the viscosity of the solution, and𝑟is the hydrated ra-dius of the ion. Thus, the largest𝐷evalues were obtained for the neutral HTO. Similar𝐷evalues were obtained for
Cs+andCl−; this result is consistent with the similar hy-drated radii of these ions (333 pmforCl−and 328 forCs+). Lower𝐷evalues were obtained forNa+relative to those of
Cs+andCl−in accordance with the larger hydrated radius
(358 pm) ofNa+, and finally, the lowest𝐷evalues were ob-tained forSr2+because it has the largest hydrated radius (412 pm) [16,17].
In addition to the porosity and the size distribution of pores, the topology of the pore space is a crucial prop-erty for flow and transport in porous media. The way that pores are interconnected (pore connectivity) may be even more significant than the number and size of the pores. As shown in Table1, the porosity increased with pore size in the stainless steel filters up to the5-𝜇mfilters, but this in-crease was not observed for the10-𝜇mfilters, which had a lower porosity. The opposite trend was observed for the G values. This fact might be related to the production process for these filters, in which a higher pore diameter did not consistently lead to a higher porosity and connectivity. The
𝐷eof a given solute increased with the filter porosity (up to the maximum𝐷evalues for porosities of approximately
0.30-0.32) but not with the pore size. Therefore, the exper-imental results indicated that the filter pore size is not the critical parameter governing the𝐷e values. Instead, the dependence between 𝐷eand the porosity values can be
examined based on Archie’s empirical relationship in its general form [10,18]:
𝐷e= 𝐴 ⋅ 𝜀𝑚 (4)
where𝐴is a pre-exponential factor, which is expected to equal𝐷wfor an inert porous medium in the limiting case
of𝜀 → 1;𝑚is the empirical cementation exponent, which with the porosity, is a measure of how the pore space is ar-ranged in terms of pore size and connectivity (pore geom-etry) [10]. Thus, the cementation exponent characterises the tendency of the pore network to increase the diffusive resistivity. Note the formal analogy between Eq. (2) and Eq. (4) for the identity of𝐴and𝐷w, from which it follows
that𝐺 = 𝜀1−𝑚. Archie’s relation can also be applied to si-multaneously derive the𝑚and𝐴values for each solute through the log transformation of Eq. (4),
log 𝐷e= log 𝐴 + 𝑚 ⋅ log 𝜀 (5) thus,log 𝐷ecan be correlated tolog 𝜀for every solute. The
𝐴and𝑚values can then be derived from the intercept and slope of the regression curve, respectively. As shown in Fig-ure3b, all the correlations were excellent (𝑅2> 0.93), and Table2summarises the𝐴and𝑚values calculated for all the solutes. The corresponding𝐷wvalues from the litera-ture are also included for comparison.
Reasonably constant values of𝑚were obtained for all the solutes, from 1.7 to 1.9; this result suggests that the pore geometry is quite homogeneous in the stainless steel fil-ters for the various pore sizes and porosities evaluated.
Table 2: The𝑚 factor and 𝐷wvalues derived from the correlations of
log 𝐷eas a function oflog 𝜀 and the literature 𝐷wvalues for each
solute. The standard errors for𝑚 and 𝐷ware given within the
parentheses.
Solute Derived A Literature𝐷w
𝑚 factor (10−10m2s−1) (10−10m2s−1) HTO 1.7 (0.2) 19 (5) 22.3a–25.9b Cs+ 1.8 (0.2) 18 (5) 20.7c Cl− 1.8 (0.2) 19 (6) 20.3c Na+ 1.8 (0.2) 13 (3) 13.3c Sr2+ 1.9 (0.2) 8 (2) 7.9c a [14],b [15],c [13].
Furthermore, the𝑚values obtained in these filters were lower than the values reported in the literature for natu-ral samples and indicated a less complex pore geometry because of a more ordered aggregation of particles. Val-ues of𝑚in the literature ranged from theoretical values of 1.35, for a homogeneously connected isotropic medium of spherical particles [19], to higher values (up to 3), cor-responding to the more complex pore geometries present in natural samples. For example, a value of𝑚 = 2.3was estimated for limestone and sandstone [19],𝑚 = 2.5was estimated for Opalinus clay and Boom clay [7] and𝑚 = 3
was estimated for Oxfordian limestones and argillite [20]. The𝐴values forCs+,Cl−,Na+andSr2+deduced from the respective correlations were similar to the literature values of𝐷w; thus, these values validated the assumption
of bulk water properties for the pore fluid, and suggested that the stainless steel filters behaved as inert porous me-dia and did not interact with the solute. This result is not given for reactive porous media, such as clays, in which𝐴
does not equal𝐷w, as in montmorillonite (see,e.g., Glaus
et al., 2010). Therefore, in view of the obtained results, un-used stainless steel filters are considered to be appropriate for use as confining porous filters in through-diffusion ex-periments. Additionally, Archie’s relationship might also be used to roughly estimate the𝐷wvalues of a given so-lute in stainless steel porous filters.
3.2 Effective diffusion coefficients for
VYCOR
®glass, Al
2O
3and PEEK porous
filters
Table3shows the measured effective diffusion coefficients of HTO,Cs+,Cl− andSeO42−. In contrast to the experi-ments with steel filters, the𝐷evalues for VYCOR
®glass,
Al2O3and PEEK porous filters were measured only for the
Table 3: The porosities (𝜀), effective diffusion coefficients and
geometric factors (G) obtained by through-diffusion experiments with VYCOR®glass, Al2O3and PEEK porous filters.
Material 𝜀 𝐷e(10−10m2s−1) G
HTO Cs+ Cl− SeO42−
VYCOR®glass 0.20 2.5 2.5 1.8 0.72 2.2
Al2O3 0.30 1.9 1.9 1.5 0.42 4.2
PEEK 0.36 1.4 1.0 1.0 0.20 7.1
single porosity given in Table3. In PEEK filters, the se-quence of𝐷e values was𝐷e(HTO)> 𝐷e(Cl−)≈ 𝐷e(Cs+)
> 𝐷e(SeO42−), which can be explained roughly by the dif-fusivity of the solvated ions, as already observed in stain-less steel filters. In contrast, the sequence of𝐷e values obtained in the experiments with the VYCOR®glass and
Al2O3filters did not follow the same trend because the𝐷e
value forCs+was slightly higher than that expected from the hydrated radius of Cs+. Gimmi and Kosakowski [21] also observed that some sorbing cations, such as caesium, diffused at larger rates than expected in clay materials; this faster diffusion was attributed to surface diffusion, a process that occurs in parallel to pore diffusion. This interaction process could also be hypothesised to occur with caesium in Al2O3 and especially VYCOR® glass fil-ters with the smallest pores; however, no evidence of this interaction could be deduced from the mass balance of the caesium concentration in the experiments performed with these two materials. Additionally, note that the pore sizes in these two materials are of completely different orders of magnitude, so completely different preconditions exist for such a process to be relevant.
0.0 0.5 1.0 1.5 2.0 2.5 3.0 3.5 5 10 15 20 25 30 De (1 0 -10 m 2s -1) Dw(10-10m2s-1)
VYCOR® glass Al2O3Al2O3 PEEK
SeO4
2-Cs+
Cl
-HTO
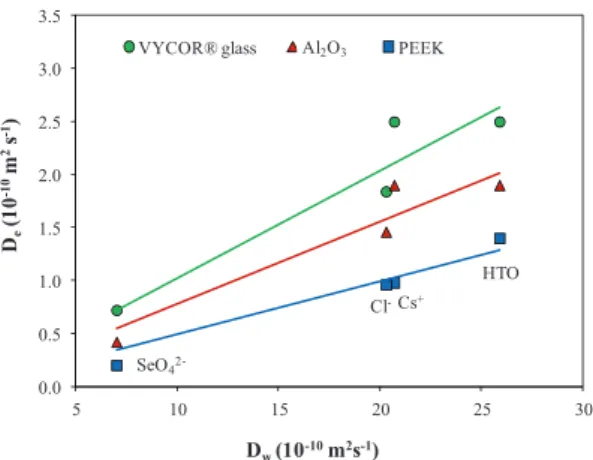
Fig. 4:𝐷eas a function of𝐷wfor VYCOR®glass, Al2O3and PEEK
porous filters. The symbols correspond to the experimental data, and the lines correspond to the fits.
Another important aspect is that the highest𝐷e val-ues were obtained for VYCOR®glass, which had the low-est porosity, whereas the lowlow-est values were obtained for PEEK, which had the highest porosity. In contrast, as shown in Table3, the highest values of G were obtained for PEEK filters, with the highest porosity, whereas the low-est values were obtained for VYCOR® glass filters, with the lowest porosity. This result indicates that the𝑚values (see Archie’s relation) are not the same for these materials (or according to the equation,𝐺 = 𝜀1−𝑚and suggests that porosity alone is insufficient to explain the differences in solute diffusion in these materials, and the geometry of the pores, including the pore connectivity, might also have an effect.
As shown in Figure4, despite these irregularities, a fairly linear relation was obtained for the three porous materials between the𝐷evalues of each solute and the
re-spective𝐷wvalues obtained from the literature [12–14], ex-cept forSeO42−, for which a𝐷wvalue of7 × 10−10m2s−1,
obtained in this work by a capillary method [22], was used. The correlation in the PEEK filters was excellent (𝑅2= 0.95), but was slightly worse in VYCOR®glass (𝑅2 = 0.89) andAl2O3(𝑅2= 0.91) filters because of the different pat-tern of the𝐷evalues obtained forCs+relative to the
re-maining solutes. The correlations improved for the two materials (𝑅2 = 0.97for VYCOR®glass and𝑅2= 0.99for
Al2O3) if theCs+values were excluded; this improvement indicated that interaction processes possibly affected the diffusion ofCs+ in these materials. Nevertheless, these processes must be considered to be merely speculative be-cause of the few number of points considered.
4 Conclusions
This work demonstrated that testing the correlation be-tween𝐷e and𝐷wvalues in a series of uncharged,
posi-tively and negaposi-tively charged solutes in presumably inert porous media is a useful strategy for the evaluation of the suitability of a given material for use as a porous filter in through-diffusion experiments. This strategy allows infor-mation to be obtained about the potential interactions of the solutes with the filter and anticipates the possible ef-fects of the pore geometry of the filter material on the𝐷e
values obtained for different solutes, as a preliminary step in the design of diffusion experiments. Thus, filter materi-als that result in good correlations and that allow a good estimate of the𝐷wvalues for a solute from Archie’s
rela-tionship are suitable for diffusion experiments. However, there are also other criteria for the selection of filter mate-rials, such as the cementation factor in Archie’s relation-ship, when dealing with different porosities of the same material, or the geometrical factor, which permits compar-isons among materials. The lower the𝐷evalues obtained
for a filter, the less suitable the filter material is. The me-chanical stability or the presence of solute-material inter-action processes are also other criteria to consider.
Therefore, for high 𝐷e values, stainless steel filters
with a pore size of 2 to5 𝜇mor VYCOR®glass filters would be the most suitable materials. However, VYCOR® glass may have a potential interaction withCs+ whereas stain-less steel filters showed a good correlation for a wide range of solutes.
Acknowledgement: This research was funded by the
Spanish Government (CICYT, contracts CTM2008-01147/TECNO and CTM 2011-27211) and the Generalitat de Catalunya (2009SGR1188). The authors would like to thank the Paul Scherrer Institut and Nagra for material support of this research. David Aldaba was awarded a PhD fellowship by the Universitat de Barcelona.
Received August 16, 2013; accepted February 10, 2014.
References
1. OECD/NEA. The Environmental and Ethical Basis of Geological Disposal of Long-Lived Radioactive Wastes. A Collective Opin-ion of the Radioactive Waste Management Committee of the OECD Nuclear Energy Agency, OECD, Paris (1995).
2. Andra. Dossier 2001 Argile: Progress report on feasibility studies & research into deep geological disposal of high-level, long-lived waste. Synthesis Report, Andra, Paris, France (2001).
3. Nagra. Project Opalinus Clay: Safety Report- Demonstration of disposal feasibility for spent fuel, vitrified high-level waste
and long-lived intermediate-level waste (Entsorgungsnach-weis). Nagra Technical Report NTB-02-05, Nagra, Wettingen, Switzerland (2002).
4. Enresa. El almacenamiento geológico profundo de los residuos radiactivos de alta actividad: Principios básicos y tecnología. Enresa, Madrid, España (2001).
5. Shackelford, C. D.: Fundamentals of soil behaviour (Book re-view). J. Contam. Hydrol.7, 177 (1991).
6. Molera, M., Eriksen, T.: Diffusion of22Na+,85Sr2+,134Cs+ and57Co2+in bentonite clay compacted to different
densi-ties: experiments and modelling. Radiochim. Acta.90, 753
(2002).
7. Van Loon, L. R., Soler, J. M., Jakob, A., Bradbury, M. H.: Effect of confining pressure on the diffusion of HTO,36Cl−and125I−in
layered argillaceous rock (Opalinus Clay): diffusion perpendic-ular to the fabric. Appl. Geochem.18, 1653 (2003).
8. Glaus, M. A., Frick, S., Rossé, R., Van Loon, L. R.: Comparative study of tracer diffusion of HTO,22Na+and36Cl−in compacted
kaolinite, illite and montmorillonite. Geochim. Cosmochim. Acta.74, 1999 (2010).
9. Glaus, M. A., Rossé, R., Van Loon, L. R., Yaroshchuk. A.E.: Tracer diffusion in sintered stainless steel filters: measurement of the effective diffusion coefficients and implications for dif-fusion studies with compacted clays. Clays and Clay Minerals
56(6), 677 (2008).
10. Boving, T. B., Grathwohl, P.: Tracer diffusion coefficients in sedimentary rocks: Correlation to porosity and hydraulic con-ductivity. J. Contam. Hydrol.53, 85 (2001).
11. Glaus, M. A., Müller, W., Van Loon, L. R.: Diffusion of iodide and iodate through Opalinus Clay: Monitoring of the redox state using an anion chromatographic technique. Appl. Geochem.
23, 3612 (2008).
12. Li, Y-H., Gregory, S. Diffusion of ions in sea water and in deep-sea sediments. Geochim. Cosmochim. Acta88, 703 (1974).
13. Mills, R.: Self-diffusion in normal and heavy water in the range 1–45∘. J. Phys. Chem.77, 685 (1973).
14. Pruppacher, H. R.: Self-diffusion coefficient of supercooled water. J. Chem. Phys.56, 101 (1972).
15. Shackelford, C. D., Daniel, D. E.: Diffusion in saturated soil: I: Background. J. Geotech. Eng. ASCE117, 467 (1991).
16. Conway, B. E.: Ionic hydration in chemistry and biophysics, New York: Elsevier Scientific Pub. Co., 1981.
17. Dove, P. M., Nix, C. J.: The influence of the alkaline earth cations, magnesium, calcium and barium on the dissolution kinetics of quartz. Geochim. Cosmochim. Acta61, 3329 (1997).
18. Archie, G. E.: The electrical resistivity log as an aid in determin-ing some reservoir characteristics. Trans. AIME146, 54 (1942).
19. Bruggeman, D. A. G.: Berechnung verschiedener physikalicher Konstanten von heterogenen Substanzen. Ann. Phys.24, 636
(1935).
20. Descostes, M., Blin, V., Bazer-Bachi, F., Meier, P., Grenut, B., Radwan, J., Schlegel, M. L., Buschaert, S., Coelho, D., Tevis-sen, E.: Diffusion of anionic species in Callovo-Oxfordian argillites and Oxfordian limestones (Meuse/Haute-Marne, France). Appl. Geochem.23, 655 (2008).
21. Gimmi, T., Kosakowski, G.: How mobile are sorbed cations in clays and clay rocks? Environ. Sci. Technol.45, 1443 (2011).
22. Mills, R., Perera, A., Simonin, J. P., Orcil, L., Turq, P.: Coupling of diffusion processes in multicomponent electrolyte solutions. J. Phys. Chem.89, 2722 (1985).