Received: January 9, 2015; Revised: April 29, 2015; Accepted: May 20, 2015
© The Author 2015. Published by Oxford University Press. All rights reserved. For Permissions, please email: journals.permissions@oup.com. doi:10.1093/carcin/bgv074
Advance Access publication May 25, 2015 Original Manuscript
876
original manuscript
CCDC26, CDKN2BAS, RTEL1 and TERT Polymorphisms in
pediatric brain tumor susceptibility
Maral Adel Fahmideh
*
, Catharina Lavebratt
1, Joachim Schüz
2,
Martin Röösli
3,4, Tore Tynes
5,6, Michael A.Grotzer
7, Christoffer Johansen
8,9,
Claudia E.Kuehni
10, Birgitta Lannering
11, Michaela Prochazka,
Lisbeth S.Schmidt
12and Maria Feychting
Unit of Epidemiology, Institute of Environmental Medicine, Karolinska Institutet, Box 210, Stockholm SE-171 77, Sweden, 1Neurogenetics Unit, Department of Molecular Medicine and Surgery, Karolinska Institutet, and Center for Molecular Medicine, Karolinska University Hospital, Stockholm SE-171 76, Sweden, 2Section of Environment and Radiation,
International Agency for Research on Cancer (IARC), 69372 Lyon CEDEX 08, France, 3Department of Epidemiology and Public Health, Swiss Tropical and Public Health Institute, Basel 4002, Switzerland, 4University of Basel, Basel 4003, Switzerland, 5The Cancer Registry of Norway, Oslo N-0304, Norway, 6National Institute of Occupational Health, Oslo NO-0033, Norway, 7Department of Oncology, University Children’s Hospital of Zurich, Zurich 8091, Switzerland, 8Unit of Survivorship, The Danish Cancer Society Research Centre, Copenhagen DK-2100, Denmark, 95073 Oncology Clinic, Finsen Centre Rigshospitalet, University of Copenhagen, Copenhagen DK-2100, Denmark, 10Swiss Childhood Cancer Registry, Institute of Social and Preventive Medicine, University of Bern, Bern 3012, Switzerland, 11Department of Clinical Sciences, Pediatric Oncology, University of Gothenburg, SE 416 85 Gothenburg, Sweden and 12Department of Pediatric Oncology, University Hospital Rigshospitalet, Copenhagen DK-2100, Denmark
*To whom correspondence should be addressed. Tel. +46 8 524 839 54; Fax. +46 8 313961; Email: maral.adel.fahmideh@ki.se
Abstract
The role of genetic polymorphisms in pediatric brain tumor (PBT) etiology is poorly understood. We hypothesized that single nucleotide polymorphisms (SNPs) identified in genome-wide association studies (GWAS) on adult glioma would also be associated with PBT risk. The study is based on the Cefalo study, a population-based multicenter case–control study. Saliva DNA from 245 cases and 489 controls, aged 7–19 years at diagnosis/reference date, was extracted and genotyped for 29 SNPs reported by GWAS to be significantly associated with risk of adult glioma. Data were analyzed using unconditional logistic regression. Stratified analyses were performed for two histological subtypes: astrocytoma alone and the other tumor types combined. The results indicated that four SNPs, CDKN2BAS rs4977756 (p = 0.036), rs1412829 (p = 0.037), rs2157719 (p = 0.018) and rs1063192 (p = 0.021), were associated with an increased susceptibility to PBTs, whereas the TERT rs2736100 was associated with a decreased risk (p = 0.018). Moreover, the stratified analyses showed a decreased risk of astrocytoma associated with RTEL1 rs6089953, rs6010620 and rs2297440 (ptrend = 0.022, ptrend = 0.042, ptrend = 0.029, respectively) as well as an increased risk of this subtype associated with RTEL1 rs4809324 (ptrend = 0.033). In addition, SNPs rs10464870 and rs891835 in CCDC26 were associated with an increased risk of non-astrocytoma tumor subtypes (ptrend = 0.009, ptrend = 0.007, respectively). Our findings indicate that SNPs in CDKN2BAS, TERT, RTEL1 and CCDC26 may be associated with the risk of PBTs. Therefore, we suggest that pediatric and adult brain tumors might share common genetic risk factors and similar etiological pathways.
Introduction
Brain tumors are the second most common type of pediatric cancer and the leading cause of childhood cancer mortality. The etiology of pediatric brain tumors (PBTs) is poorly understood (1). As in adults (2), the only established risk factors for brain tumors in children are exposure to high doses of ionizing radi-ation and several inherited disorders, and these cause only a minority of cases. Therefore, it is likely that brain tumorigenesis results from complex interactions between genetic and epige-netic variations in concert with exposure to environmental fac-tors (1).
Although large genetic studies on adult brain tumors have been conducted (3–7), very few and only small studies of brain tumors in children and adolescents have been reported (8–11). In the last few years, four genome-wide association studies (GWAS) on adult glioma identified seven susceptibility loci at 5p15.33 (TERT), 8q24.21 (CCDC26), 9p21.3 (CDKN2A-CDKN2B), 20q13.33 (RTEL1), 11q23.3 (PHLDB1) and 7p11.2 (EGFR) (4–7). However, lim-ited data are available on the role of genetic polymorphisms in the etiology of PBTs, probably because of difficulties in collecting a sufficient number of DNA samples. Considering this lack of knowledge about genetic risk factors for brain tumors in chil-dren, it is important to identify germ-line DNA polymorphisms that might influence the susceptibility to PBTs.
The aim of this study, based on the largest series of PBT cases to date, was to test the hypothesis that the single nucleotide polymorphisms (SNPs) identified by GWAS on adult glioma are also associated with the risk of brain tumors in children.
Materials and methods
Study population and procedures
This study is based on the Cefalo study, a large, international, population-based, case–control study of brain tumors in children and adolescents conducted in centers in Sweden, Denmark, Norway and Switzerland. All centers followed a common protocol for data collection, as described in more detail elsewhere (12,13). Eligible cases were children aged 7–19 years during the period 1 April 2004 to 31 August 2008, diagnosed with a pri-mary intracranial brain tumor defined according to the International Classification of Childhood Cancer, third edition (ICCC-3) (14), group III, restricted to the third edition of the International Classification of Diseases for Oncology (ICD-O-3), location C71 and subclassified according to the fourth edition of the World Health Organization (WHO) classifica-tion of tumors of the central nervous system (15). Medulloblastoma cases will be the subject of a separate study and therefore have been excluded from the present analysis. Two controls per case were randomly selected from the general population matched to the case by age, sex and geo-graphical region. Interviews were conducted with 352 (82%) cases and 646 (71%) controls. Participants with neurofibromatosis or tuberous sclerosis were excluded from the analyses. The study was approved by the national data protection boards and ethical committees in all participating coun-tries, and written informed consent was obtained from all participants and/or their parents.
The Oragene self-collection kit (DNA Genotek, Ottawa, ON, Canada) was used for saliva collection and DNA extraction, following the manufac-turer’s recommended protocol. DNA samples are stored at the Karolinska Institutet Biobank. The DNA yield was quantitated by using PicoGreen
(Invitrogen, Carlsbad, CA). Overall, saliva DNA from 245 cases and 489 con-trols was included in this study.
SNP selection and genotyping
A total of 29 SNPs reported by GWAS to be significantly associated with risk of adult glioma were selected for genotyping (4–7). Genotyping was performed at the Mutation Analysis core Facility, Clinical Research Centre, Huddinge University Hospital, Stockholm, Sweden, with staff blinded to sample status, using the Sequenom iPlex Gold platform with matrix-assisted laser desorption/ionization-time-of-flight (MALDI-TOF) mass spectrometry. The average success rate was 97% and the concordance rate for duplicate genotyping was 100%.
Statistical analysis
The consistency of allele frequencies with Hardy–Weinberg equilibrium was assessed in the controls for all SNPs using the χ2 goodness-of-fit test, and p < 0.001 was considered statistically significant. Analyses were per-formed based on the subset of Cefalo subjects who provided saliva sam-ple. Unconditional logistic regression was used to estimate the association between SNPs and PBT susceptibility based on the Cochran–Armitage trend test of additivity (trend) as well as dominant (DOM) and recessive (REC) models, with adjustment for the matching variables (age, sex and country). The allelic frequencies of the genotyped SNPs were compared between cases and controls using the χ2 test. Analyses were also conducted stratified by astrocytoma alone and the combination of other tumor types, including ependymoma, intracranial embryonal tumors (except medul-loblastoma), other gliomas, other specified intracranial neoplasms and unspecified intracranial neoplasms. Country specific analyses were per-formed to assess consistency across countries. The Wald test was used to evaluate the significance of interactions between SNPs and demographic variables and D´, a measure of the linkage disequilibrium (LD) between the genotyped SNPs, was calculated. Haploblocks were defined based on the default linkage disequilibrium block parameters in Haploview v4.2. Haplotype analyses were performed for the haplotype blocks harboring the SNPs that were found to be associated with PBTs. Haplotypes with a frequency of >1% were considered in the analyses. The effects of specific haplotypes were analyzed if the distribution of all the haplotypes was sug-gestively different between cases and controls (p < 0.05 for all PBTs; p < 0.1 for subgroup analyses). Selection of SNPs for the analyses was based on a priori knowledge from GWAS on adults, and therefore odds ratios (ORs) are presented with 95% confidence intervals (CIs). The possibility of false-positive findings was, however, considered by also providing the reference
p value for an experiment-wide significance with Bonferroni correction.
The analyses were performed using PLINK v1.07 (16) and SAS statistical software version 9.3 (SAS Institute, Cary, NC).
Results
We successfully genotyped 29 SNPs in 245 cases and 489 con-trols. The distributions of allele frequencies in the controls were in agreement with the Hardy–Weinberg equilibrium. Table 1 shows demographic characteristics of cases and controls and the distributions of diagnostic subtypes. The age and sex dis-tributions were similar in cases and controls. More than 50% of cases were diagnosed with astrocytoma. No significant interac-tions were detected between SNPs and confounders including age, sex and country (Table 2).
As shown in Table 2, TERT rs2736100 A allele was associated with a decreased risk of PBTs [ORDOM 0.66 (95% CI 0.46–0.93), p = 0.018], whereas the SNPs rs4977756 G allele [ORDOM 1.45 (95% CI 1.03–2.06), p = 0.036], rs1412829 G allele [ORDOM 1.45 (95% CI 1.02–2.05), p = 0.037], rs2157719 C allele [ORDOM 1.53 (95% CI 1.08– 2.19), p = 0.018] and rs1063192 G allele [ORDOM 1.53 (95% CI 1.07– 2.19), p = 0.021] in CDKN2BAS were associated with increased susceptibility to this tumors.
The stratified analyses of two histological subtypes indicated that the risk effects of CDKN2BAS rs1063192, rs2157719, rs1412829 and rs4977756 remained significant in patients with astrocytoma Abbreviataions
CI confidence interval
GWAS genome-wide association studies
OR odds ratio
PBT pediatric brain tumor
(ptrend = 0.036, ptrend = 0.034, ptrend = 0.044 and ptrend = 0.023, respec-tively), whereas the protective effect of TERT rs2736100 was more evident in patients with other brain tumor subtypes [ORDOM 0.53 (95% CI 0.34–0.85), p = 0.007]. Moreover, the stratified analyses showed a decreased risk of astrocytoma associated with the
polymorphisms RTEL1 rs6089953 A allele, rs6010620 A allele and rs2297440 T allele (ptrend = 0.022, ptrend = 0.042 and ptrend = 0.029, respectively), as well as an increased risk of this subtype associ-ated with the C allele of RTEL1 rs4809324 (ptrend = 0.033). In addi-tion, an increased risk of non-astrocytoma tumor subtypes was associated with the SNPs rs10464870 C allele and rs891835 G allele in CCDC26 (ptrend = 0.009 and ptrend = 0.007, respectively) (Table 3).
The non-significant findings, possibly resulting from the limited statistical power of the study, are shown in the online appendix Supplementary Tables 1–3 (available at Carcinogenesis Online) and the raw data showing the number of cases and controls for each genotype of significant SNPs are reported in Supplementary Table 4 (available at Carcinogenesis Online).
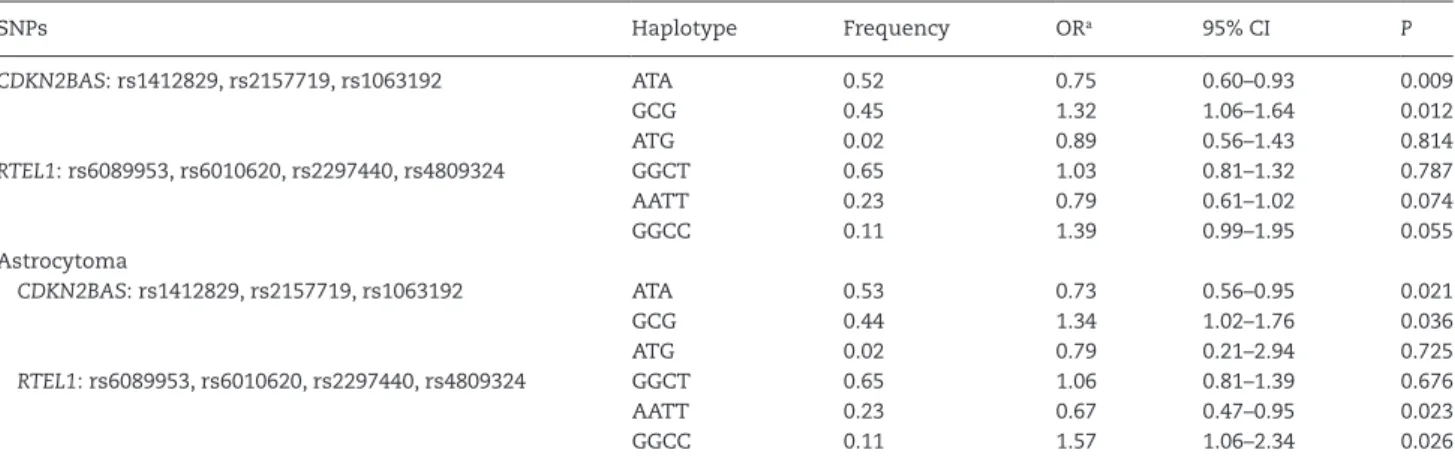
Strong linkage disequilibrium (D´ ≥ 0.95) was observed between three of the genotyped SNPs in CDKN2BAS (rs1412829, rs2157719 and rs1063192) and four SNPs in RTEL1 (rs6089953, rs6010620, rs2297440 and rs4809324). For each of the two blocks, three haplotypes with frequency of >1% were found. The dis-tribution of haplotypes was different for PBT patients com-pared with controls for the CDKN2BAS block (χ2 = 7.0, df = 2 and p = 0.030) and showed a tendency to be different for the RTEL1 block (χ2 = 5.9, df = 2 and p = 0.053). The most common haplo-type (ATA) of CDKN2BAS SNPs had a significant protective effect compared with the other haplotypes combined [OR 0.75 (95% CI 0.60–0.93), p = 0.009], whereas the second most common haplo-type (GCG) had a significant risk effect [OR 1.32 (95% CI 1.06–1.64), p = 0.012]. The haplotype analyses suggested an increased risk of PBTs by increasing the number of risk alleles in CDKN2BAS and RTEL1 SNPs. In the astrocytoma subgroup, the same hap-loblocks and haplotypes with frequencies of >1% were detected. However, in this subgroup, the distribution of haplotypes in the RTEL1 block was significantly different between patients and controls (χ2 = 9.0, df = 2 and p = 0.011), whereas this difference was not statistically significant in the CDKN2BAS block (χ2 = 5.7, df = 2 and p = 0.059). In the astrocytoma subgroup, a significant protective effect was observed for the most common haplotype (ATA) of CDKN2BAS SNPs compared with the other haplotypes combined [OR 0.73 (95% CI 0.56–0.95), p = 0.021], whereas the second most common haplotype (GCG) showed a significant risk effect [OR 1.34 (95% CI 1.02–1.76), p = 0.036]. Moreover, in the RTEL1 block, the second most common haplotype (AATT) had a significant protective effect compared with the other haplo-types combined [OR 0.67 (95% CI 0.47–0.95), p = 0.023], whereas the third most common haplotype (GGCC) had a significant risk effect [OR 1.57 (95% CI 1.06–2.34), p = 0.026] (Table 4).
Overall, we performed 116 testing procedures as described above. When the Bonferroni correction is applied, the reference p value is 0.0004 for an experiment-wide significance level of 0.05, and 0.0009 for a significance level of 0.10; none of the observed associations met these limits. The consistency of results across countries was investigated and the results of stratified analyses are reported in the online appendix Supplementary Tables 5–8 (available at Carcinogenesis Online). No significant differences between countries were observed.
Discussion
The results of this study indicate that several SNPs associated with adult glioma risk are also associated with the risk of PBTs. Our findings suggest that SNPs rs4977756 G allele, rs1412829 G allele, rs2157719 C allele and rs1063192 G allele in CDKN2BAS may increase the risk of PBTs, whereas the A allele of TERT rs2736100 polymorphism may confer protection against PBTs. In addition, polymorphisms rs6089953 A allele, rs6010620 A allele
Table 1. Characteristics of cases and controls
Characteristics Cases Controls No. of participants 245 489 Sex
Males 136 (56%) 261 (53%)
Females 109 (44%) 228 (47%) Age-group (at reference date)
7–9 years old 48 (20%) 112 (23%) 10–14 years old 108 (44%) 219 (45%) 15–19 years old 89 (36%) 158 (32%) Country Sweden 106 (43%) 174 (36%) Norway 24 (10%) 62 (13%) Denmark 62 (25%) 134 (27%) Switzerland 53 (22%) 119(24%) Type of tumor (International Classification
of Childhood Cancer-3 group III)a
Astrocytoma (IIIb) 134 (55%) Pilocytic astrocytoma 93 Supependymal giant cell astrocytoma 5 Pleomorphic xanthoastrocytoma 4 Diffuse astrocytoma 13 Anaplastic astrocytoma 11 Fibrillary astrocytoma 2
Glioblastoma 5
Giant cell glioblastoma 1 Other gliomas (IIId) 20 (8%) Malignant glioma 11 Oligoastrocytoma 2 Oligodendroglioma 6 Anaplastic oligodendroglioma 1 Ependymoma (IIIa) 19 (8%) Subependymoma 2
Choroid plexus papilloma 4 Choroid plexus caricinoma 1
Ependymoma 7
Papillary ependymoma 1 Anaplastic ependymoma 4 Intracranial embryonal tumors (IIIc) 7 (3%) CNS primitive neuroectodermal
tumor
6 Neuroepithelioma 1 Other specified intracranial neoplasms
(IIIe)
49 (20%)
Germinoma 7
Yolk sac tumor 1 Teratoma, mature 1 Haemangioblastoma 1 Desmoplastic infantile ganglioglioma 2 Dysembryoplastic neuroepithelial tumor 6 Ganglioglioma 26 Anaplastic ganglioglioma 1 Centrol neurocytoma 3 Neurilemoma 1
Unspecified intracranial neoplasm (IIIf) 16 (6%)
aRestricted to ICD-O-3 location C71, subclassified according to World Health Organization histological subclassification, 2007; patients with neurofibromato-sis and tuberous scleroneurofibromato-sis were excluded.
Ta
ble 2.
Summar
y r
esults for SNPs associated with pediatric br
ain tumors SNP Chr . Gene Location (bp) Minor allele MAF a in cases MAF a in contr ols Model OR b 95% CI P CHISQ Pinter action c rs2736100 5 TER T 1286516 A 0.47 0.50 Dominant 0.66 0.46–0.93 0.018 0.702 Recessi ve 1.19 0.82–1.71 0.359 Additi ve 0.89 0.72–1.12 0.351 Allelic 0.333 0.94 rs1063192 9 CDKN2B AS 22003367 G 0.52 0.45 Dominant 1.53 1.07–2.19 0.021 0.889 CDKN2B Recessi ve 1.36 0.95–1.95 0.095 Additi ve 1.31 1.05–1.63 0.015 Allelic 0.009 6.64 rs2157719 9 CDKN2B AS 22033366 C 0.51 0.44 Dominant 1.53 1.08–2.19 0.018 0.825 Recessi ve 1.36 0.94–1.97 0.099 Additi ve 1.32 1.06–1.64 0.014 Allelic 0.009 6.67 rs1412829 9 CDKN2B AS 22043926 G 0.50 0.43 Dominant 1.45 1.02–2.05 0.037 0.734 Recessi ve 1.38 0.95–1.99 0.089 Additi ve 1.29 1.04–1.61 0.021 Allelic 0.014 6.04 rs4977756 9 CDKN2B AS 22068652 G 0.49 0.42 Dominant 1.45 1.03–2.06 0.036 0.954 Recessi ve 1.30 0.89–1.91 0.176 Additi ve 1.27 1.02–1.59 0.032 Allelic 0.024 5.09 aMAF , minor allele fr equenc y. bOR adjusted for a ge , se x and countr y. cP v
alue for inter
actions betw
een SNPs and demo
gr aphic v aria bles including a ge , se x and countr y.
Ta
ble 3.
Summar
y r
esults for SNPs associated with pediatric br
ain tumors str atified b y histolo gical subtypes SNP Chr . Gene Location (bp) Minor allele MAF a in cases MAF a in contr ols Model OR b 95% CI P CHISQ Astr oc ytoma rs1063192 9 CDKN2B AS 22003367 G 0.52 0.45 Dominant 1.84 1.15–2.94 0.011 CDKN2B Recessi ve 1.21 0.76–1.91 0.419 Additi ve 1.34 1.02–1.76 0.036 Allelic 0.038 4.29 rs2157719 9 CDKN2B AS 22033366 C 0.51 0.44 Dominant 1.75 1.11–2.77 0.016 Recessi ve 1.26 0.79–1.99 0.329 Additi ve 1.34 1.02–1.76 0.034 Allelic 0.035 4.43 rs1412829 9 CDKN2B AS 22043926 G 0.50 0.43 Dominant 1.64 1.05–2.57 0.029 Recessi ve 1.28 0.81–2.03 0.294 Additi ve 1.32 1.01–1.74 0.044 Allelic 0.043 4.09 rs4977756 9 CDKN2B AS 22068652 G 0.5 0.42 Dominant 1.85 1.17–2.91 0.008 Recessi ve 1.25 0.78–2.01 0.358 Additi ve 1.38 1.05–1.82 0.023 Allelic 0.025 5.02 rs6089953 20 R TEL1 62291008 A 0.18 0.25 Dominant 0.64 0.43–0.96 0.032 Recessi ve 0.49 0.19–1.31 0.157 Additi ve 0.67 0.48–0.95 0.022 Allelic 0.019 5.46 rs6010620 20 R TEL1 62309839 A 0.19 0.25 Dominant 0.66 0.44–0.99 0.048 Recessi ve 0.59 0.24–1.45 0.254 Additi ve 0.71 0.50–0.99 0.042 Allelic 0.039 4.27 rs2297440 20 R TEL1 62312299 T 0.17 0.24 Dominant 0.64 0.41–0.98 0.038 Recessi ve 0.52 0.19–1.37 0.187 Additi ve 0.68 0.47–0.96 0.029 Allelic 0.023 5.18 rs4809324 20 R TEL1 62318220 C 0.15 0.10 Dominant 1.54 0.98–2.39 0.060 Recessi ve 2.94 0.78–11.14 0.112 Additi ve 1.54 1.04–2.28 0.033 Allelic 0.029 4.74 Other rs2736100 5 TER T 1286516 A 0.44 0.50 Dominant 0.54 0.34–0.85 0.007 Recessi ve 1.07 0.64–1.77 0.802 Additi ve 0.78 0.57–1.07 0.122 Allelic 0.139 2.19 rs10464870 8 CCDC26 130477823 C 0.32 0.23 Dominant 1.70 1.11–2.60 0.014 Recessi ve 1.78 0.87–3.66 0.115 Additi ve 1.53 1.11–2.11 0.009 Allelic 0.004 8.11 rs891835 8 CCDC26 130491752 G 0.34 0.24 Dominant 1.59 1.04–2.44 0.032 Recessi ve 2.32 1.18–4.57 0.015 Additi ve 1.55 1.13–2.14 0.007 Allelic 0.003 8.65 aMAF , minor allele fr equenc y. bOR adjusted for a ge , se x, and countr y.
and rs2297440 T allele in RTEL1 were associated with decreased susceptibility to astrocytoma, whereas the C allele of RTEL1 rs4809324 was associated with an increased risk of this sub-type. Furthermore, an increased risk of non-astrocytoma tumor subtypes associated with polymorphisms CCDC26 rs10464870 C allele and rs891835 G allele was detected. Our findings suggest that genetic risk profiles of PBTs differ by histology.
To our knowledge, this study represents the largest series of pediatric brain tumor cases assembled for genetic association testing to date. The association between the 29 SNPs investi-gated in this study and the risk of PBTs has not been examined in previous studies (8–11). The SNPs were selected a priori for analyses in this study based on findings in GWAS on adult gli-oma, and our significant findings of associations between SNPs in CDKN2BAS, TERT, RTEL1 and CCDC26, and risk of PBTs were consistent with findings on adult brain tumors with respect to the direction of ORs for the minor alleles (4–7).
CDKN2BAS (ANRIL) encodes antisense non-coding RNA in the INK4 locus which is a long non-coding RNA (ncRNA). The exact function of CDKN2BAS is unclear, but it is known to be involved in regulating the expression of CDKN2A and CDKN2B genes that encode cyclin-dependent kinase inhibitors and block cell cycle division during the G1/S phase. Therefore, CDKN2BAS has a regulatory role in the context of cellular proliferation, and its alterations result in abnormal self-renewing capabilities typi-cal of cancer cells (17,18). Germ-line mutations in CDKN2BAS predispose to a wide variety of human cancers (19,20).
Telomerase reverse transcriptase (TERT) is a catalytic subu-nit of telomerase that maintains telomere by adding telomeric repeat sequences onto chromosome ends. Telomerase expres-sion can prevent telomere eroexpres-sion in most eukaryotic cells, and cancer cells can prevent telomere loss through the abnor-mal upregulation of telomerase (21). The mutant allele of TERT rs2736100, which is an intronic polymorphism, may downregu-late telomerase expression and consequently decrease the risk of brain tumors.
RTEL1 produces regulator of telomere elongation helicase 1 which is essential for telomere maintenance and genome stability by preventing homologous recombination (22). Polymorphisms in RTEL1 are correlated with high grade glioma in adults (4,5,7,23). In contrast, CCDC26 variations are associated with low grade tumors (4,5,23). CCDC26 encodes a retinoic acid– dependent regulator of cell differentiation and death. CCDC26 increases apoptosis induced by death stimuli in neuroblastoma cells (24) and in glioblastoma cells with downregulation of tel-omerase activity (25).
The majority of genetic variations found in this study to be associated with the risk of PBTs are related to telomerase activ-ity which has an important role in the initiation and progression of gliomas (26). Moreover, it has been shown that telomerase expression is related to high grade gliomas and poor survival (27,28). Thus, telomerase could be considered as a therapeutic target for brain tumors (29,30).
The aim of this study was to provide evidence of the asso-ciations between SNPs and PBT risk, and not to investigate the mechanisms behind such associations; nevertheless the fact that we did not consider the effect of environmental risk factors represents a limitation of this work. Therefore, additional studies are needed to examine potentially relevant gene-environment interactions and to explore the mechanisms through which these genetic polymorphisms influence cancer susceptibility.
The present study was conducted based on a specific hypothesis that may lead to detection of clinically meaningful risk and protective factors. Moreover, the selection of SNPs for analysis was based on a priori knowledge from GWAS on adults, and therefore Bonferroni correction may be overly conservative and may make researchers miss important findings (31). To be able to evaluate potential false-positive findings, reference p values with Bonferroni corrections have been presented and the consistency of results across four countries has been reported. No significant differences between countries were observed. Replication studies are necessary to confirm these results in larger sample sizes.
In conclusion, the present findings indicate that SNPs in CDKN2BAS are associated with increased susceptibility to PBTs, whereas TERT polymorphisms may decrease the risk of these tumors. Moreover, polymorphisms in RTEL1 and CCDC26 genes are associated with the risk of astrocytoma and non-astrocy-toma subtypes, respectively. Thus, we suggest that pediatric and adult brain tumors might share common genetic risk factors and similar etiological pathways.
Supplementary material
Supplementary Tables 1–8 can be found at http://carcin.oxford-journals.org/.
Funding
Swedish Council for Working Life and Social Research (2004-0504 and 2007-0224); Swedish Research Council (K2008-70X-15366-04-3); Swedish Cancer Society (09 0666); Swedish
Table 4. Haplotype analysis of SNPs in CDKN2BAS and RTEL1
SNPs Haplotype Frequency ORa 95% CI P CDKN2BAS: rs1412829, rs2157719, rs1063192 ATA 0.52 0.75 0.60–0.93 0.009 GCG 0.45 1.32 1.06–1.64 0.012 ATG 0.02 0.89 0.56–1.43 0.814 RTEL1: rs6089953, rs6010620, rs2297440, rs4809324 GGCT 0.65 1.03 0.81–1.32 0.787 AATT 0.23 0.79 0.61–1.02 0.074 GGCC 0.11 1.39 0.99–1.95 0.055 Astrocytoma CDKN2BAS: rs1412829, rs2157719, rs1063192 ATA 0.53 0.73 0.56–0.95 0.021 GCG 0.44 1.34 1.02–1.76 0.036 ATG 0.02 0.79 0.21–2.94 0.725 RTEL1: rs6089953, rs6010620, rs2297440, rs4809324 GGCT 0.65 1.06 0.81–1.39 0.676 AATT 0.23 0.67 0.47–0.95 0.023 GGCC 0.11 1.57 1.06–2.34 0.026
Childhood Cancer Society (PROJ06/050 and PROJ09/086); Swedish Radiation Protection Authority (SSI P 1572); Danish Strategic Research Council (2103-05-0006 and 2064-04-0010); Swiss Federal Office of Public Health (05.001626); Swiss Research Foundation on Mobile Communication (A2006.18); Swiss National Science Foundation (PDFMP3_122873); Research Council of Norway (175163/V40).
Acknowledgements
We gratefully acknowledge collaboration with and support from clinicians and other hospital staff in all countries, as well as assistance from national and local cancer registers with iden-tification of patients. We also acknowledge the skillful work of the research nurses, interviewers, and research assistants in all countries. Finally, we acknowledge all those with whom we have collaborated previously within the CEFALO study. Please see Aydin et al. for an exhaustive list (12).
Conflict of Interest Statement: None declared.
URLs: PLINK: http://pngu.mgh.harvard.edu/~purcell/plink/; SAS: http://www.sas.com/
References
1. Pollack, I.F. et al. (2011) Childhood brain tumors: epidemiology, current management and future directions. Nat. Rev. Neurol., 7, 495–506. 2. Fisher, J.L. et al. (2007) Epidemiology of brain tumors. Neurol. Clin., 25,
867–890.
3. Adel Fahmideh, M. et al. (2014) Association between DNA repair gene polymorphisms and risk of glioma: a systematic review and meta-analysis. Neuro Oncol.,16, 807–814.
4. Rajaraman, P. et al. (2012) Genome-wide association study of glioma and meta-analysis. Hum. Genet., 131, 1877–1888.
5. Sanson, M. et al. (2011) Chromosome 7p11.2 (EGFR) variation influences glioma risk. Hum. Mol. Genet., 20, 2897–2904.
6. Shete, S. et al. (2009) Genome-wide association study identifies five susceptibility loci for glioma. Nat. Genet., 41, 899–904.
7. Wrensch, M. et al. (2009) Variants in the CDKN2B and RTEL1 regions are associated with high-grade glioma susceptibility. Nat. Genet., 41, 905–908.
8. Jeon, S. et al. (2013) Genetic variants of AICDA/CASP14 associated with childhood brain tumor. Genet. Mol. Res., 12, 2024–2031.
9. Salnikova, L.E. et al. (2010) Association study of xenobiotic detoxication and repair genes with malignant brain tumors in children. Acta Natu-rae, 2, 58–65.
10. Searles Nielsen, S. et al. (2010) Childhood brain tumors, residential insecticide exposure, and pesticide metabolism genes. Environ. Health Perspect., 118, 144–149.
11. Sirachainan, N. et al. (2008) Folate pathway genetic polymorphisms and susceptibility of central nervous system tumors in Thai children. Cancer Detect. Prev., 32, 72–78.
12. Aydin, D. et al. (2011) Mobile phone use and brain tumors in children and adolescents: a multicenter case-control study. J. Natl Cancer Inst., 103, 1264–1276.
13. Christensen, J.S. et al. (2012) Brain tumors in children and adolescents and exposure to animals and farm life: a multicenter case-control study (CEFALO). Cancer Causes Control, 23, 1463–1473.
14. Steliarova-Foucher, E. et al. (2005) International Classification of Child-hood Cancer, third edition. Cancer, 103, 1457–1467.
15. Louis, D.N. et al. (2007) The 2007 WHO classification of tumours of the central nervous system. Acta Neuropathol., 114, 97–109.
16. Purcell, S, et al. (2007) PLINK: a tool set for whole-genome association and population-based linkage analyses. Am J Hum Genet., 81, 559–575. 17. Cunnington, M.S. et al. (2010) Chromosome 9p21 SNPs Associated with
Multiple Disease Phenotypes Correlate with ANRIL Expression. PLoS Genet., 6, e1000899.
18. Wapinski, O. et al. (2011) Long noncoding RNAs and human disease. Trends Cell Biol., 21, 354–361.
19. Gu, F. et al. (2013) Common genetic variants in the 9p21 region and their associations with multiple tumours. Br. J. Cancer., 108, 1378–1386. 20. Turnbull, C. et al. (2010) Genome-wide association study identifies five
new breast cancer susceptibility loci. Nat Genet., 42, 504–507. 21. Baird, D.M. (2010) Variation at the TERT locus and predisposition for
cancer. Expert Rev. Mol. Med., 12, e16.
22. Barber, L.J. et al. (2008) RTEL1 maintains genomic stability by suppress-ing homologous recombination. Cell, 135, 261–271.
23. Simon, M. et al. (2010) Genetic risk profiles identify different molecular etiologies for glioma. Clin. Cancer Res., 16, 5252–5259.
24. Jiang, M. et al. (2008) Retinoic acid induces caspase-8 transcription via phospho-CREB and increases apoptotic responses to death stimuli in neuroblastoma cells. Biochim. Biophys. Acta., 1783, 1055–1067. 25. Das, A. et al. (2007) Differentiation decreased telomerase activity in
rat glioblastoma C6 cells and increased sensitivity to IFN-gamma and taxol for apoptosis. Neurochem. Res., 32, 2167–2183.
26. Shervington, A. et al. (2006) Glioma: what is the role of c-Myc, hsp90 and telomerase? Mol. Cell. Biochem., 283, 1–9.
27. Tabori, U. et al. (2006) Human telomere reverse transcriptase expres-sion predicts progresexpres-sion and survival in pediatric intracranial epend-ymoma. J. Clin. Oncol., 24, 1522–1528.
28. Tchirkov, A. et al. (2003) Clinical implications of quantitative real-time RT-PCR analysis of hTERT gene expression in human gliomas. Br. J. Cancer, 88, 516–520.
29. Kim, J.H. et al. (2013) Ependymoma in children: molecular considera-tions and therapeutic insights. Clin. Transl. Oncol., 15, 759–765. 30. Wong, V.C. et al. (2010) Telomerase inhibition as a novel therapy for
pediatric ependymoma. Brain Pathol., 20, 780–786.
31. Rothman, K.J. (1990) No adjustments are needed for multiple compari-sons. Epidemiology, 1, 43–46.